Introduction
The distance between obstacles is a fundamental part of task on sport tournaments in modern course design and should fit into the level of training possibilities of horses that are expected to enter the competition (Gego, Reference Gego2006). The criteria for course building are very seldom the subject of scientific research (Plewa von, Reference Plewa von1992), even this kind of investigation is not the newest one (Leach, Reference Leach1984 and 1993; Clayton, Reference Clayton1989; Deuel and Clayton, Reference Deuel and Clayton1995). The selection of young horses that are bred for show-jumping sport is very often based on free jumping performance tests. Free jumping tests are used for preselection and as a part of performance tests for breeding stallions in many sport horse associations. In some countries, free jumping is also popular as a separate kind of competition. Basic conditions of free jumping test could be found in performance test programs, but detailed information is not obvious. The effect of distance between obstacles in free jumping lane on the style of jumping was not investigated even if free jumping tests are commonly used.
The instructions for stallion performance tests in Polish Horse Breeders Association allow to keep the distance from 6.5 to 7.2 m between the 2nd vertical obstacle and the 3rd doublebarre obstacle in the jumping lane. These regulations allow to keep the distance that seems to be the most suitable for horses in the tested group. Such attitude allows to demonstrate horse technical skills in the best way according to their training status, but with a lower attention to other skill – ‘ability to react’. The ability to learn and respond to different stimuli usually directly influences the horse usefulness and value to human (McCall, Reference McCall1990).
The aim of the study was to investigate the changes of jumping parameters as a horse response on different distances in obstacle combination. Observations carried on sport events give some information about designed distance as the additional knowledge (Jeleń, Reference Jeleń1976; Deuel and Park, Reference Deuel and Park1993; Hole et al., Reference Hole, Clayton and Lanovaz2002). It seems that there is a lack of scientific data in this field of research, and practitioner information being of the wide range should be confirmed or corrected. The information on changes of horse jumping technique on different distances in the jumping lane could have an important meaning for free jumping style evaluation.
Methods
Horses
The investigated horse material consists of two groups of stallions that attended tests for Polish halfbred riding horses. There were 14 horses in the first group and 22 horses in the second one. All horses were filmed at the same training centre 1 week before the final test. Basic measurements of the investigated groups were:
1. first tested group: height at withers 165.3 cm (s.d. 2.6), circumference of the chest 192.3 cm (2.5), circumference of the cannon bone 21.6 (0.6).
2. second tested group: height at withers 165.7 cm (s.d. 3.2), circumference of the chest 192.4 (5.3), circumference of the cannon bone 22.1 (0.7).
Horses were evaluated by the official horse commission and received the following marks: for free jumping skills in trainers opinion 7.0 points (s.d. 0.8) first group and 7.2 points (s.d. 0.9) second one and in judges opinion it was, respectively, 7.15 (0.8) and 7.14 (0.9). Horses were in the age of 1241 days (s.d. 121) and 1425 days (s.d. 174).
Testing procedures
Horses taking part in investigations were trained during the obligatory 100-days stallion performance test. The training consists of 6 days of exercise to about 30 min daily work. From the beginning of the training period, horses performed mostly basic dressage work and 2 days of free jumping exercise. The scheme of training at the end of the test contains 3 days of dressage work, 2 days of jumping work under rider and 1 day of free jumping exercises. Both investigated groups of horses were filmed during their regular free jumping work in the jumping corridor. According to the instructions of Polish Horse Breeders Association, a free jumping corridor consists of elements placed on the longer side of riding hall in the following order:
• the guard-pole on the ground (in the distance 2.5 m to the next obstacle)
• the cross-pole obstacle (5.8 to 6.5 m)
• the next cross-pole obstacle (6.8 to 7.2 m)
• the doublebarre obstacle with the height 70 to 130 cm.
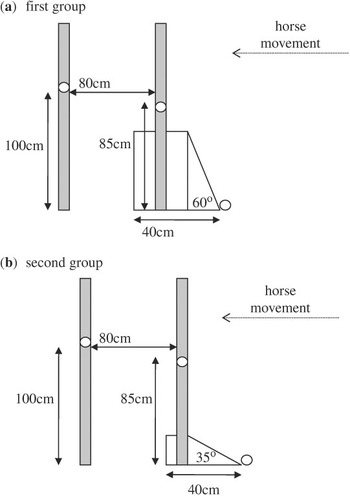
During investigations the distance between cross-poles was 6.4 m for both groups of horses. The investigated distance between the 2nd (cross-pole) and 3rd (doublebarre) obstacles was 6.8 and 7 m for the first group and 6.8 and 7.1 m for the second group. The jumping parameters were filmed on the doublebarre obstacle of the same size in both cases. The obstacles were of the same colours – white stands with white-red poles and white additional wall-kind elements at the foot. The structure of the obstacles is presented in Figure 1.
Structure of the obstacles.

The warm-up for both groups of horses consists of 15 to 20 min of longing (mostly trot) outside the riding hall, then horses were allowed to run in a riding hall for about 1 to 2 min in the jumping corridor. During the test, horses jumped 5 to 7 times. The first warm-up jump was performed always on the vertical obstacle with the height of 0.85 m. This warm-up jump could be repeated on the basis of the trainer’s decision. After warm-up, jumping the vertical obstacle was changed to the spread doublebarre obstacle. Only jumps performed on the spread obstacle were analysed. Height of the first part of the obstacle was always 0.85 cm and height of the second part was 1 m. The width of the filmed obstacle was 0.80 m. All filmed jumps were performed on the same size of the obstacle. The first two successive jumps were considered for the investigated distance (6.8 m) between the 2nd cross-pole and the 3rd doublebarre, then the distance was changed to the second one (7 m for the first group and 7.1 m for the second one) and next two successive jumps were filmed. In total, the first group of 14 stallions performed 56 jumps on the doublebarre obstacle and the second group of 22 stallions performed 104 jumps on the investigated distances.
The data were collected by a digital camera Panasonic AG-EZ35 (operating 25 frames/s) standing in the middle of the riding hall and filming the last doublebarre obstacle. Linear measurements were obtained by video image analysis using digitalisation of frames and taken from selected frames by manual MultiScan program. The scale for measurement was obtained by measuring the distances between natural marks on the wall behind the filmed combination. The temporal data were received from the counter of frames by using 25 frames/s (Motion DV Panasonic program, VW-DTM22E).
Temporal and linear jumping parameters
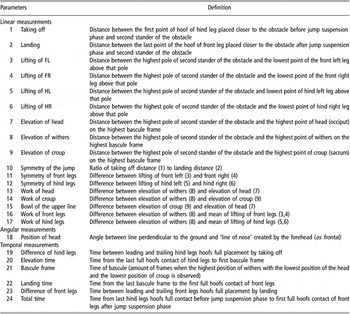
Jumps of horses were characterised by the following linear measurements (Table 1):
Definition of the measured parameters

• taking-off and landing distances
• height of lifting of leg above the obstacle for each leg separately
• height of selected bascule points of horse silhouette above the obstacle (withers, croup, head)
• position of the head measured as a head angle.
Bascule points were measured on the frame when the highest point of withers together with the lowest points of croup and head were observed. If the bascule position was observed at more than one digitalised frame, measurements allowed the identification one frame when the bascule position described as the highest position of wither with the lowest positions was available.
In order to describe the silhouette of horse above the obstacle in a more detailed way, additional parameters were calculated from the basic measurements (Table 1): symmetry of jump, symmetry of front legs, symmetry of hind legs, ‘work’ of head, ‘work’ of croup, bow of back upper line, ‘work’ of front legs, ‘work’ of hind legs. Names of traits are used according to the breeders’ specification (http://www.pzhk.pl), even if they do not follow physical definition. The following temporal measurements were achieved (in frames of film):
• difference between full contacts of limb placements for hind legs by taking off
• time from the last hind limbs’ full contact to the bascule position
• account of frames when the bascule position could be observed
• time from the bascule position to the first front limbs contact
• difference between full contacts of limb placements for the front legs by landing.
Statistical analysis
Statistical analysis for both investigated groups of horses was performed separately. Data regarding horse conformation and quality were taken into account by preliminary analysis of variance (ANOVA) computed by proc GLM of SAS program with the model included test group as fixed effect and regression on age. No differences between tested groups were found for quality of horses expressed by judges’ marks for jumping as well as for conformation of horses. Regression on age was also without statistical significant importance. To avoid other influences that could be connected with unknown effect of the individual animal, the effect of the horse as a random one was included in the statistical model. ANOVA was computed by using the GLM procedure (SAS v. 9.1). The statistical model included fixed effects: successive jump on every distance (1st on 6.8 m and 2nd on 6.8 m, and 1st on 7 to 7.1 m and 2nd on 7 to 7.1 m), distance between obstacles (6.8 and 7 to 7.1 m) as well as the random effect of the horse. The statistical model for two separate files of investigations was as follows:

where yijkl is the value of the parameter, μ is the mean, ai is the random effect of horse for the first group (i = 1,…,14) and for the second group (i = 1,…,22), Dj is the fixed effect of distance (j = 1,2), Jk is the fixed effect of successive numbers of jumps (k = 1,2) and eijkl is the error.
Results
First test
The effect of horse was statistically significant for almost all traits. Only symmetry of front legs, symmetry of hind legs and the ‘work’ of hind legs were not influenced by this random effect. The effect of successive jump was statistically significant for lifting of hind legs above the obstacle (P < 0.05). Lifting of hind legs above the obstacle was 4 to 5 cm lower in the second jump.
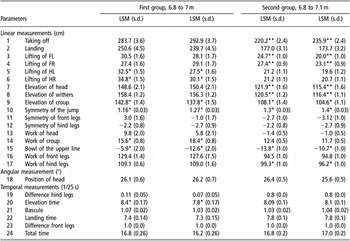
The effect of distance between the 2nd and 3rd obstacles is presented in Table 2. Significant differences between investigated distances were noticed for the linear parameters of lifting of hind legs above the obstacle as well as for elevation of croup above the obstacle. The elevation of croup was lower by longer distance about 5 cm. The symmetry of jump was closer to 1 by a closer distance. Higher value of the ‘work’ of croup as well as deeper bowl of back upper line were measured on longer distance. All parameters differ by investigated distances at a statistically significant level of P lower than 0.05. Temporal measurements were affected by distance only in the case of elevation time (P ⩽ 0.05). Elevation time was shorter by longer distance 0.4 frame.
Results of the effect of the distance in investigated groups

*Differences in rows statistically significant for P < 0.05.
**Differences in rows statistically significant for P < 0.01.
Second test
The effect of horse was significant for almost all traits as it was observed in the first group. Only symmetry of front legs, symmetry of hind legs and work of hind legs were not influenced by this random effect. The effect of successive jump was not statistically significant for this group. Results received for the investigated effect of distance between obstacles are also presented in Table 2. In general, more linear parameters were affected by the distance in this investigated group. Taking-off distance, lifting of front legs, elevation of bascule points, symmetry of jump as well as additional parameters – bowl of back upper line and the ‘work’ of hind legs – were different. The differences for taking off, lifting of front legs, elevation of head and withers were received as statistically significant at P ⩽ 0.01. The differences for elevation of croup, symmetry of jump, bowl of back upper line as well as for the ‘work’ of hind legs were significant at P ⩽ 0.05.
On the longer distance in the obstacle, combination horses took off at a further distance from the obstacle and landed in the same place. The lifting of front legs and the elevation of body (measured as bascule points) were lower by a longer distance. The silhouette of the horse above the obstacle was less bent and legs were closer to the trunk of the horse by a longer distance. Temporal measurements were not influenced in this group.
Discussion
The error of data measurements was calculated from 0.7% to 7% for these kinds of two-dimensional linear measurements (Lewczuk, Reference Lewczuk1996). The errors calculated by other researchers reached from 3% to 5% for two and three-dimensional measurements (Hole et al., Reference Hole, Clayton and Lanovaz2002; Crevier-Denoix et al., 2005). The three-dimensional equipment (Crevier-Denoix et al., 2005) allows to receive more precise measurements; however it is not always useable in the field condition of investigations.
The linear jumping parameters – taking off and landing are – usually discussed in instructions and books for parcours designers; however, data given in these books are much more created for adult sport horses. The calculations of distance are conducted basically on the calculations that the average stride length of the horse (being mentioned as 3.5 m) and required landing and taking-off distances that are given according to the class of the parcours (Polish Equestrian Federation, 1994). The last instructions took into account that second stride length in the combination is mostly shorter (Koziarowski and Jankowski, Reference Koziarowski and Jankowski2002). These differences between strides before and after the obstacle were scientifically proved (Knisel and Loeffler, Reference Knisel and Loeffler1982).
In comparison with biomechanical research data, the average length of canter stride given in that instruction is in the range of measurements achieved by dressage competition for foule of canter from 2 to 3.47 m by speed of 3.27 to 5.97 m/s (Clayton, Reference Clayton1991, Reference Clayton1995a and Reference Clayton1995b; Back and Clayton, Reference Back and Clayton2001).
According to the Polish equestrian instructions, the following distances for taking off and landing could be given (Polish Equestrian Federation, 1994):
• vertical obstacle:
○ up to 1.35 m high – taking off about 2.0 m, landing about 50% longer
○ from 1.35 m high – taking off about 2.5 to 3 m, landing 50% longer
• spread obstacle:
○ taking off about 1.5 m, landing 1.6 to 2.4 m.
The last Polish course-design instructions for the obstacles being about 1.5 m, following distances are used (Koziarowski and Jankowski, Reference Koziarowski and Jankowski2002):
• vertical obstacle: 1.9 m taking off and 2.6 m landing
• spread obstacle: 1.6 m taking off and 2.1 m landing
• triplebarre: 1.2 m taking off and 2.1 m landing
• water jump: 0.5 m taking off.
In the equestrian books, except taking-off and landing points also the term ‘jump stride zone’ is discussed (d’Orgeix, Reference d’Orgeix1986). Following foreign and Polish information was found in books written by sport practitioners:
• height of obstacle: 0.8 m, 1 to 2 m before and behind the obstacle (d’Orgeix, Reference d’Orgeix1993)
• height of obstacle: 1.0 m, 2 m before and behind (d’Orgeix, Reference d’Orgeix1993)
• height of obstacle: 1.0 m, 1.5 to 2 m before and 1.8 to 2.4 m behind (Holz, Reference Holz1996)
• height of obstacle: 1.2 m, 2 to 3 m before and behind (Becher, Reference Becher1987)
• height of obstacle: 1.5 m, 1.75 to 2.25 m before and 2.05 to 2.65 m behind (Holz, Reference Holz1996)
• height of obstacle: 2.0 m, 2 to 2.5 m before and 2.3 to 2.9 m behind (Holz, Reference Holz1996).
These data were not confirmed by science except that the average length of the jump was about 5 m as written in German books (Zasady jazdy konnej, 2003) and measured by German scientists (Knisel and Loeffler, Reference Knisel and Loeffler1982). The jump stride zone is considered as a speed-dependent variable (d’Orgeix, Reference d’Orgeix1986). Less is written even in practical books about the influence of obstacle width on jumping parameters, perhaps because it is commonly accepted that height of jump influences jumping parameters more than its width.
Visualisation of the front view of obstacle is an important factor that should also be taken into account. Obstacles with walls or other elements that make the front view of the obstacle more recognisable for horses are expected to influence the jumping technique. Horses are expected to jump more ‘fluent’ and ‘round’ (Becher, Reference Becher1987). The lowest number of mistakes on the wall-kind obstacles was observed in the scientific research in the show-jumping competition (Stachurska et al., Reference Stachurska, Pieta and Nesteruk2002).
The Federation Equestrian International (FEI) rules give some regulations according to parcours design for adult sport horses. Article 212 of FEI Jumping regulations – ‘Combination obstacles’ gives a broad range of the distance from 7 to 12 m. Except for some special competitions (Hunting, Speed and Handiness – art.262 and 263 FEI – that required two or more successive efforts), values below 7 m between obstacles are not allowed. The National Regulations are in accordance with FEI rules.
The studied equestrian literature gives limited amount of information on the effect of distance on jumping parameters (Skulicz, Reference Skulicz1992; de Nèmethy, Reference de Nèmethy1997; Królikiewicz, Reference Królikiewicz2000; Pollmann-Schweckhorst, Reference Pollmann-Schweckhorst2002). The theory that horses should be trained to jump from different distances is underlined, but not much detailed information is given.
On the basis of the conducted study, it is possible to conclude that the effect of distance was statistically significant for jumping parameters for both groups of horses; however, it does not influence all jumping parameters in the same way. The first group of horses did not change parameters connected with length of the jump. The effect of distance in this group was not important for the front part of the silhouette of horse body (elevation of head and withers by bascule and lifting of front legs above the obstacle were not affected), while heights of the hind part of the horse body were measured lower above the obstacle (elevation of croup and lifting of hind legs above the obstacle were influenced by this effect). The second group of horses react on changes of distances in not exactly the same way – they took off at different places as the first group, but their landing distance was the same. So they were able to compensate the different taking-off distances during the jump and landed in the same distance behind the obstacle. The silhouette of the body over the obstacle was observed higher by the front part, which was measured as elevation of the head and withers and lifting of front legs. Hind part of the horse’s body was of the same value, however high enough to clear the jump.
Data regarding temporal measurements seem to be influenced by the limitations of equipment (low amount of frames), especially in case of very short-lasting variables. The bascule position could be observed mostly at one frame and in some cases on two frames. Differences in placements of hind legs by taking off or front legs by landing could be investigated more precisely.
Differences observed by the jumping technique in two investigated groups of horses depended on horse effect even if there were no statistically significant differences between performance marks and basic measurements of conformation. Differences in the jumping technique could not be explained by the age of horses as the age of horses was not statistically significant in the preliminary analysis. Effect of the horse was used in the statistical model to reduce the influence related to the individual animal, also variation caused by previous interaction with humans as suggested by McKinley and Sambrook (Reference McKinley and Sambrook2000).
The size and kind of the doublebarre obstacles were the same in both tests; however, the front view of the obstacle was not exactly the same (Figure 1). In both tests, the distance between obstacles influenced jumping parameters. Studies conducted on the investigated distances (6.8 to 7.1 m) allow to conclude that the shorter the distance, the higher the jump – but not always in the same part of the horse’s body. Better understanding of the nature of horse free jumping seems to be of a great importance to evaluate jumping horse skills. Some research on jumping technique was conducted in a very detailed manner underlying the possibility of early detection and a recognisable technique of good jumping (Santamaria et al., Reference Santamaria, Back, Weeren Van, Knaap and Barneveld2002, Reference Santamaria, Bobbert, Back, Barneveld and Weeren Van2004a and Reference Santamaria, Bobbert, Back, Barneveld and Weeren Van2004b; Bobbert and Santamaria, Reference Bobbert and Santamaria2005; Bobbert et al., Reference Bobbert, Santamaria, Weeren Van, Back and Barneveld2005; Santamaria et al., Reference Santamaria, Bobbert, Back, Barneveld and Weeren Van2005). Regarding horse conformation (Dufosset and Langlois, Reference Dufosset and Langlois1984), the problem of possible bias by free jumping judging still exists (Santamaria et al., Reference Santamaria, Bobbert, Back, Barneveld and Weeren van2006). Repeatable characteristic of some jumping parameters underline the needs for further research in this field (Cassiat et al., 2000; Lewczuk et al., Reference Lewczuk, Słoniewski and Reklewski2006).