Introduction
There is growing interest in the development of follow-up clinics for patients discharged from UK intensive care units. Although intensive care was previously considered a ‘service stop-over’,Reference Griffiths and Jones1 interest in the long term outcomes of critical care (many of which may be related to the intensive care experience)Reference Rattray and Crocker2 has more recently resulted in the development of follow-up services across the country. Currently, approximately 30 per cent of UK intensive care units offer such a service; approximately 70 per cent of these follow-up clinics are nurse-led.Reference Griffiths, Barber, Cuthbertson and Young3 In 2000, the Department of Health (DoH) recommended, as part of its critical care review, that National Health Service trusts ensure appropriate follow up for those patients who would benefit.4 Further, 2003 DoH recommendations supported a multi-disciplinary approach to follow-up services, and the availability of ‘fast track’ referral systems.5 When designing follow-up care pathways for patients discharged from critical care, the collection of evidence to quantify problems encountered in the post-critical care period was recommended.5
These issues have been addressed by the UK-based Practical study, a multi-centre, randomised trial of standard hospital and intensive care unit follow-up programmes.Reference Cuthbertson, Rattray, Johnston, Wildsmith, Wilson and Hernendez6
By investigating long term outcomes in intensive care unit survivors, clinicians can better understand the effects of such care, and can consider modifications in care delivery which may improve patient recovery and subsequent quality of life.Reference Rattray and Crocker2
The authors' anecdotal evidence, collected while working in an ENT-led voice clinic, suggested that patients who had been intubated and ventilated were at risk of developing voice problems. Various factors have been shown to adversely affect voice, including intubation,Reference Kastanos, Estopa Miro, Marin Perez, Xaubet Mir and Agusti-Vidal7, Reference Colice, Stukel and Dain8 tracheostomy,Reference Steele, Evans, Afaq, Robson, Dourado and Tayar9 ventilation and laryngopharyngeal reflux.Reference Oguz, Tarhan, Korkmaz, Yilmaz, Safak and Demirci10 These same factors, encountered during critical care, could predispose patients to vocal morbidity. This group of patients may therefore benefit from identification and referral to otolaryngology and speech and language therapy services.
Although published evidence is lacking regarding patient vocal function following critical care, it has been reported that up to 40 per cent of patients requiring a tracheostomy in an intensive care setting subsequently develop voice problems.Reference Leonard, Lewis, Singh and van Heerden11–Reference Mittendorf, McHenry, Smith, Yowler and Peerless13 It is unclear whether this is due to prior morbidity, endotracheal intubation, tracheostomy, other aspects of patients' intensive care unit stay, or a combination of factors.
Although dysphonia has been shown to correlate with voice-related quality of life in a sample of patients attending an out-patient voice clinic,Reference Jones, Carding and Drinnan14 it has never been assessed in intensive care unit survivors. The impact of dysphonia in relation to the multitude of significant physical and psychological problems encountered by intensive care unit patients is currently unknown.
Objective
We set out to identify the degree of perceived vocal morbidity suffered by patients discharged from an intensive care unit.
Materials and methods
Design
A questionnaire-based, prospective, cohort study of consecutive patients admitted to an intensive care unit.
Setting
The intensive care unit of the Western Infirmary, Glasgow, Scotland, UK, a tertiary referral centre and university hospital.
Participants
A total of 273 consecutive admissions to our eight-bed adult intensive care unit were identified between 26 March and 7 November 2006. All patients admitted to the intensive care unit were included. Patients confirmed as deceased eight weeks after the date of intensive care unit discharge were then excluded. On the advice of the regional ethics committee, patients were also excluded if they could not be confirmed as alive.
Ethical considerations
The study received ethical approval from the regional ethics committee (NRES West of Scotland Research Ethics Committee code AB/78217/1). If a patient's general practitioner could not be contacted, the patient was excluded in order to reduce the risk of mistakenly contacting a bereaved family.
Main outcome measure
The Voice Symptom Scale questionnaire was chosen as our primary outcome measure. This is a validated questionnaire which measures patient perceived, self-reported vocal function.Reference Deary, Wilson, Carding and MacKenzie15, Reference Wilson, Webb, Carding, Steen, MacKenzie and Deary16 The questionnaire can be completed by the patient with or without assistance.
The Voice Symptom Scale questionnaire consists of 30 items, each of which is scored from zero to four, giving a total score range of zero to 120.
Methods
A computerised database held records relating to all aspects of the patients' stay in the intensive care unit. Consecutive admissions were identified from this source. Eight weeks following discharge from the intensive care unit, the patients' general practitioners were contacted to establish whether the patients in question were alive. All patients confirmed as alive were then posted an information sheet, consent form and questionnaire with pre-paid reply envelope. Any patient who had not responded after one month was sent a second copy of the same documents.
Patients reporting perceived vocal morbidity were invited to attend a voice clinic, where they were assessed by both an otolaryngologist and a speech and language therapist.
Analysis
Results were entered into an Excel spreadsheet for analysis.
As Voice Symptom Scale scores were not normally distributed, the Mann–Whitney U test for non-parametric data was used for statistical analysis.
Results and analysis
Of the 273 patients included, eight weeks after intensive care unit discharge, 71 (26 per cent) were deceased. In a further 21 cases (8 per cent), it was not possible to contact a general practitioner. The remaining 181 patients were included. Ninety-five patients (52 per cent) did not respond. Of the 86 patients who did respond, three (2 per cent) declined to be involved. Eighty-three (46 per cent) patients' responses were included in the analysis.
The respondents' mean age was 60.6 years (median 62 years; range 18–87 years). There were 51 male and 34 female responders.
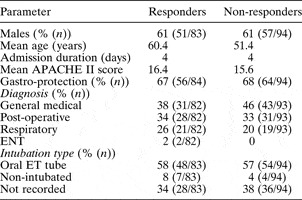
The intensive care unit admission diagnosis was recorded for 81 patients: 31 were admitted for a general medical diagnosis, excluding respiratory causes; 28 were post-operative surgical admissions; 20 were admitted with a respiratory diagnosis; and two had a primary ENT diagnosis (Table I).
Results: responders vs non-responders

APACHE = Acute Physiological and Chronic Health Evaluation; gastro-protection = received gastro-protective medication; ET = endotracheal
Patients' mean Acute Physiological and Chronic Health Evaluation II scoreReference Knaus, Zimmerman, Wagner, Draper and Lawrence17 was 16.4 (median 15).
The average duration of intensive care unit admission was four days (median three days).
Forty-eight of the 83 patients (58 per cent) were recorded as undergoing tracheal intubation during their intensive care unit admission. Seven of the 83 patients (8 per cent) were recorded as not undergoing tracheal intubation during their admission, one of whom had undergone tracheostomy prior to arrival in the intensive care unit, and two of whom were managed with naso-pharyngeal airways. The remaining 28/83 patients (34 per cent) had no data records regarding intubation.
The mean length of intubation in the group requiring tracheal intubation was 49.7 hours (median 21.5 hours).
The provision of histamine receptor blockers and proton pump inhibitors was recorded. Doses were obtained from the British National Formulary.18 Fifty-six of the 83 patients (67 per cent) received either histamine receptor blockers or proton pump inhibitors during their intensive care unit stay, although only 23 of the 83 patients (28 per cent) were treated for the duration of their admission.
Table I compares the above results with those for non-responders.
Voice outcomes
The mean number of days between intensive care unit discharge and completion of the Voice Symptom Scale questionnaire was 96 (median 90 days; interquartile range 70–119 days).
The total Voice Symptom Scale score data were not normally distributed. The median score was 12 (interquartile range 6–26.5).
Figure 1 shows patients' total Voice Symptom Scale scores.
Distribution of total Voice Symptom Scale scores.

Twenty-seven of the 83 patients (33 per cent) had a total Voice Symptom Scale score of over 20, while 13 of the 83 (16 per cent) had a score of 40 or greater.
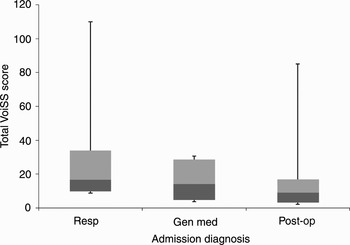
Responders were categorised by their diagnosis on intensive care unit admission (see Figure 2). Patients with a respiratory diagnosis on admission were found to have statistically significantly higher Voice Symptom Scale scores when analysed using the two-tailed Mann–Whitney U test (p < 0.05). The Voice Symptom Scale scores of all other groups showed no statistically significant difference.
Total Voice Symptom Scale (VoiSS) scores by diagnosis at admission: respiratory (Resp; n=20); general medical (Gen med; n = 31); and post-operative (Post-op; n = 28). Box and whiskers plots display minimum, q1, median, q3 and maximum.

No correlation was found between total Voice Symptom Scale scores and age, Acute Physiological and Chronic Health Evaluation II score, duration of admission, duration of intubation, or amount of gastro-protective medication received.
Follow-up voice outcomes
All patients who responded and scored 10 or higher were invited to a follow-up voice clinic.
Fifty-one patients (61 per cent) had a Voice Symptom Scale score of 10 or more. Of these patients, four (8 per cent) had subsequently died. Sixteen of the 51 patients (31 per cent) attended for follow up.
Nine male and seven female patients attended for follow up. The mean age of patients attending for follow up was 65 years, compared with 54 years for all patients invited to the clinic.
The mean Voice Symptom Scale score of patients attending for follow up was 39.2 (median 34.5). Patients' Voice Symptom Scale scores at follow up were not statistically different from the same patients' initial Voice Symptom Scale scores following discharge from the intensive care unit.
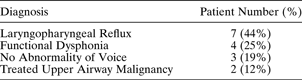
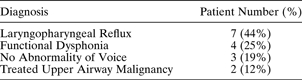
Forty-four per cent of patients seen at follow up were diagnosed with laryngopharyngeal reflux based on history and examination findings, 25 per cent had functional dysphonia, 12 per cent had previously been treated for an upper airway cancer, and 19 per cent reported no vocal morbidity on follow up. Table II shows the diagnoses of the patients seen at follow up.
Diagnosis of patients seen at follow up
Following assessment at the voice clinic, 10 of the 16 attending patients (62 per cent) were offered treatment by an otolaryngologist and/or speech and language therapist. Only six of the 16 patients (38 per cent) did not require any further treatment.
Discussion
Our results suggest that one-third of patients discharged from intensive care suffer perceived vocal morbidity at a level similar to patients treated for early laryngeal cancer.Reference Loughran, Calder, MacGregor, Carding and MacKenzie19 One-sixth of our patients reported vocal morbidity similar to that reported in average UK voice clinic populations.Reference Jones, Carding and Drinnan14, Reference Wilson, Webb, Carding, Steen, MacKenzie and Deary16 Almost two-thirds of our patients seen at follow up were offered treatment for their voice.
Study strengths and limitations
We are the first group to address this clinical question in detail. By considering all patients admitted to an intensive care unit, we aimed to characterise the degree of vocal morbidity suffered by this population as a whole.
We identified published papers with results derived from postal questionnaires sent to patients discharged from intensive care units. Studies from Germany,Reference Schelling, Stoll, Haller, Briegel, Manert and Hummel20, Reference Graf, Wagner, Graf, Koch and Janssens21 FinlandReference Niskanen, Ruokonen, Takala, Rissanen and Kari22 and SwedenReference Orwelius, Nordlund, Edell-Gustafsson, Simonsson, Nordlund and Kristenson23 had higher response rates (61–92 per cent). Work from UK units had response rates varying from 56 to 77 per cent. Differences in methodology included our policy of universal inclusion, and the use of two rather than three mailings.
Our response rate was low (46 per cent), introducing the potential for bias. We analysed patients' results by sex, age, duration of admission, Acute Physiological and Chronic Health Evaluation II score, diagnosis on intensive care unit admission, form of intubation, and provision of gastro-protective medication. The only significant difference between groups was age: the non-responders' mean age was nine years less than that of the responders. The significance of this result is unclear but may be related to non-responders' lifestyle choices. We did not feel that this was likely to bias our Voice Symptom Scale results.
An internal audit of patients treated in our intensive care unit showed that alcohol contributed directly to 11 per cent of admissions and indirectly to a further 19 per cent. Twenty-five per cent of patients admitted are documented, regular abusers of alcohol. This high rate of alcohol use amongst our patients will have an effect on their lifestyle, and may have had an effect on our response rate.Reference Orwelius, Nordlund, Edell-Gustafsson, Simonsson, Nordlund and Kristenson23
Studies researching critical care survivors have well recognised difficulties with patient follow up.Reference Rubenfeld24 This problem is also likely to confront those seeking to establish intensive care follow-up clinics. The Department of Health 2003 critical care outreach publication5 considered tertiary referral centres to have particular problems relating to the distances patients must travel. Such problems may be overcome by the use of questionnaire assessment by telephone.
Comparison with other studies
The Voice Symptom Scale questionnaire has been used to assess patients from voice clinics and those treated for early laryngeal cancer.
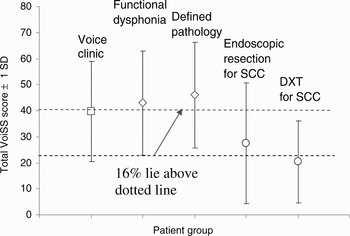
A Manchester-based study found that patients attending a specialist voice clinic reported a mean Voice Symptom Scale score of 39.8 (standard deviation (SD) 19.2).Reference Jones, Carding and Drinnan14 Further work from voice clinics in Newcastle and GlasgowReference Wilson, Webb, Carding, Steen, MacKenzie and Deary16 found that patients with functional dysphonia had a mean score of 43 (SD 20), whilst those with defined pathology had a mean score of 46 (SD 20.4).
In patients with early laryngeal cancer treated with radiotherapy or endoscopic resection, post-treatment mean Voice Symptom Scale scores of 20.4 (SD 15.7) and 27.5 (SD 23.1) have been reported, respectively.Reference Loughran, Calder, MacGregor, Carding and MacKenzie19
There is currently no published normative data for the Voice Symptom Scale questionnaire, although preliminary work from the south of England has suggested that a score of 10 or less may represent a normal voice. Figure 3 compares our results with those available in the literature.
Published Voice Symptom Scale (VoiSS) scores in specific patient groups. Thirty-three per cent of our patients had a VoiSS score above the lower dotted line, sixteen per cent had a score above the higher dotted line. SCC = squamous cell carcinoma; DXT = radiotherapy; SD = standard deviation; □ = ref 14; ⋄= ref 16; ○ = ref 19

Thirty-three per cent of patients responding to our questionnaire had a total Voice Symptom Scale score of 20 or more. This suggests that up to one-third of patients who survive intensive care will have a degree of perceived vocal morbidity similar to or worse than that reported by patients treated for early laryngeal cancer. Up to 16 per cent of patients have a score comparable to or worse than patients attending specialist UK voice clinics.
Clinical applications
A link has been demonstrated between dysphonia and voice-related quality of life measured by the Voice Symptom Scale.Reference Jones, Carding and Drinnan14 Our results suggest that a significant number of patients discharged from intensive care units may benefit from both ENT and speech and language therapy follow up. It is possible that the Voice Symptom Scale questionnaire could be administered in intensive care follow-up clinics to identify patients most likely to benefit from such referral. This would be an ideal tool in the nurse-led clinic setting.
Although our response rate was low, one-third of respondents reported perceived vocal morbidity at a level similar to patients treated for early laryngeal cancer, and one-sixth reported perceived vocal morbidity of the same degree as a voice clinic population. These populations would traditionally have access to both an otolaryngologist and a speech and language therapist.
• Patients attending intensive care follow-up clinics may benefit from contact with otolaryngology and speech therapy services
• In this study, up to one-third of patients suffered clinically significant vocal morbidity following discharge from intensive care
• Intensive care survivors are difficult to study due to low response rates
Our work highlights the difficulties encountered when developing follow-up services for survivors of intensive care. The role of clinical nurse specialists in maintaining patient contact may be influential in ensuring good levels of follow up. Low response rates and poor attendance at follow-up clinics may be due to the many physical and psychological problems encountered by this group of patients, but may also reflect patients' perceptions of vocal morbidity being of low relative importance compared with their overall health.
Conclusion
This first attempt to address the issue of vocal morbidity in intensive care survivors suggests that such patients may suffer significant vocal morbidity. Further study, in the setting of a well attended follow-up clinic, could help to further characterise this problem.