

When, in 2000, the draft of the sequenced human genome was introduced, many new avenues of research for exploring human health became available. One field that experienced an explosion of interest was proteomics, the study of the protein complement of a cell under certain conditions. Although these newly uncovered genome sequences revealed which protein sequences could be expressed, splicing, post-translational modifications (PTMs), tertiary structure, enzymatic activity, formation of complexes and ligand interactions combine to produce a much richer protein environment than what is simply coded for, and it is these intricate and complex processes that dictate how biological functions occur. Proteomic research is the attempt to understand all that is occurring in this complex environment, with the aim of elucidating protein-level processes involved in biological activity.
The first tentative steps towards mass spectrometry (MS)-based proteomics started in the late 1980s, well before the human genome was sequenced, when the development of soft-ionisation techniques such as electrospray ionisation (ESI) (Ref. Reference Fenn1) and matrix-assisted laser desorption/ionisation (MALDI) (Ref. Reference Tanaka2) allowed MS analysis of intact biological macromolecules for the first time. These technologies, together with the fact that peptides produced through the digestion of proteins with highly specific proteases are characteristic of their parent protein, permitted protein identification by comparison of MS data with known sequences, in silico. Progress in this field generated a great deal of fervour, and researchers began to develop new techniques, as well as incorporate established techniques, to aid proteome analysis by MS. The years that followed saw gargantuan leaps in the capabilities of MS and related technologies.
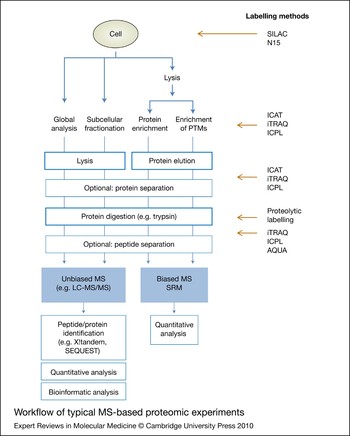
So why all the excitement? It is mainly due to the ability of MS to obtain specific and sensitive information about a complex sample quickly, over a wide dynamic range. Given that the genome of a given species codes for many thousands of protein products [~20 500 for humans (National Human Genome Research Institute, http://www.genome.gov)], which cover many orders of magnitude in abundance (ten in the case of plasma) (Ref. Reference Anderson and Anderson3), two-dimensional (2D) gel electrophoresis was initially the only technology capable of sensitive and reproducible visualisation of the proteome. MS, combined with a host of affiliated technologies, provided the first opportunity to go beyond gel-based visualisation, enabling discovery and identification of the components of a proteome on a large scale, to a depth that immunoprecipitations and 2D gels could not provide. These proteome-wide discovery experiments were the basis of the initial thrust in MS-based proteomics, inspiring a rapid rate of creation and improvement of new techniques and instrumentation in an attempt to dig deeper into the proteome, with more certainty, less sample and less time. This focus on instrumentation brought together different combinations of mass analyser and ion source, and fostered the utilisation of the strengths of different mass analysers in hybrid instruments (Ref. Reference Aebersold and Mann4). Research and development continue to produce and improve mass spectrometers to this day (Ref. Reference Hu5). Although these technique and technology improvements have resulted in the greatly increased utility and robustness of MS-based proteomics, what does this mean for tangible benefits to human health research? Essentially, it means that proteomics has moved beyond simply asking the ‘what’ of a biological question, and now can routinely and robustly study the ‘when, where, how and how much’. Current popular techniques and experiment types employed in MS-based proteomics that are now being utilised in biomedical research are discussed in this review (Fig. 1).
Workflow of typical MS-based proteomic experiments. Whole-cell lysates can be used for a global proteome analysis, or more in-depth analysis and additional spatial information can be obtained using subcellular fractionation. Alternatively, cells can be lysed and proteins or post-translation modifications (PTMs) of interest can be isolated by affinity enrichment methods. All methods produce protein mixtures, which can be separated further by exploiting various protein properties such as molecular weight or isoelectric points, and are digested in the next step. Separating the generated peptides is recommended and leads to deeper resolution. Peptides are then analysed by MS (e.g. LC-MS/MS) and in unbiased discovery experiments peptides and the corresponding proteins are identified using database-matching search algorithms, followed by quantitative and bioinformatic evaluation of the data. Alternatively, targeted MS for specific peptides and proteins can be performed using SRM. Quantitative information can be obtained either by label-free methods or by applying a differential isotopic labelling method at one of the stages indicated on the right: metabolic labels such as SILAC and N15 can be introduced at cell level, whereas chemical labelling methods such as iTRAQ, ICPL or ICAT are utilised either at protein or at peptide level. Isotopic labelling can also be introduced during proteolysis, and synthetic standard isotopic peptides can be added to the peptide mixture (AQUA). Abbreviations: AQUA, absolute quantitation; ICAT, isotope-coded affinity tags; ICPL, isotope-coded protein labelling; iTRAQ, isobaric tags for relative and absolute quantitation; LC-MS/MS, liquid chromatography tandem mass spectrometry; MS, mass spectrometry; N15, 15N isotope; PTM, post-translational modification; SILAC, stable isotope labelling of amino acids in cell culture; SRM, selected reaction monitoring.

Protein and peptide separation techniques
The field of MS-based proteomics can be categorised into two broad approaches. The increasingly popular ‘top-down’ proteomic approach focuses on the analysis of intact proteins, whereas the more widely used ‘bottom-up’ proteomic approach focuses on the analysis of peptides following proteolytic digestion of proteins, and is the main topic of this review (Ref. Reference Han, Aslanian and Yates6). Because ‘bottom-up’ proteomic approaches require digestion of proteins into peptides prior to their analysis by MS, preanalytical sample processing plays an important role and should be carefully considered when designing and conducting these types of experiments. By far the most popular method to prepare a proteomic sample is enzymatic digestion using trypsin, which is very well suited to downstream analysis by the most common MS and tandem MS (MS/MS) techniques. However, information regarding PTMs or protein isoforms could be missed, and it is often worth considering other proteolytic enzymes or applying a panel of enzymes (Ref. Reference Swaney, Wenger and Coon7). The digestion of proteins into peptides prior to MS analysis greatly increases the complexity of samples, and the separation of these complex samples into manageable, reproducible fractions is an issue that proteomics has battled with since its inception.
Owing to several factors, including competitive ionisation of coeluting species, dynamic range limitations (the ability to analyse a weak signal in the presence of a strong signal), duty cycle constraints (how many things can be analysed per unit of time) and resolving power, it is generally known that the greater the separation before MS sequencing, the better the results (Ref. Reference Yates, Ruse and Nakorchevsky8). Powerful separations are therefore a necessity for in-depth proteome analysis and there has been much research into separation technologies that are compatible with proteomic workflows. The art is now such that what was cutting-edge experimental work five years ago is now routinely performed in laboratories all over the world. For example, separation of samples in at least two dimensions in the liquid phase, a strategy known as multidimensional liquid chromatography (MDLC), has many different permutations and is a large field of research on its own, leading to many of its own reviews (Refs Reference Dugo9, Reference Tang10).
Protein separation
Although the final dimension of separation for MS-based proteomics is generally a reversed-phase separation at the peptide level, upstream separations can use a number of different properties for fractionation of complex samples at the peptide or protein level. Many options exist for protein-level separation, each of which can utilise a different physical property of proteins to obtain varying but complementary first-dimension separations. Cation exchange (Ref. Reference Shen11) and anion exchange (Ref. Reference Zhou12), for example, offer good separation orthogonality in fractionating proteomic samples before liquid chromatography (LC)-MS/MS. Two different technologies, however, have emerged recently and joined the mainstream: chromatofocusing (CF) (Refs Reference Sluyterman and Elgersma13, Reference Sluyterman and Wijdenes14, Reference Schlautman15), a variant of ion-exchange chromatography that separates proteins based on pH; and isoelectric focusing (IEF) (Ref. Reference Michel16), which separates proteins based on their isoelectric point (pI), as is done in the first dimension of 2D gel electrophoresis. These methods are easily automatable and provide powerful protein-level separation and useful information of the physical properties of the proteins, while keeping the analytes soluble and compatible with proteomic experiments, and are therefore widely used (Ref. Reference Fang, Robinson and Foster17).
Another commonly used method for protein-level sample fractionation prior to MS is the ‘GeLC’ approach. It harnesses the well-established ability and available equipment for running gels, by separating a complex sample by molecular weight at the protein level in a single 1D SDS-PAGE gel lane, and using that lane as the first dimension in a multidimensional separation. After staining, the entire lane is excised, cut into bands and each band is treated as a fraction of the same sample. After the proteins in these bands are enzymatically digested, each band's peptide mixture can be analysed on an LC-MS/MS instrument and the results combined. The benefits of gel-based protein-level first-dimension separation are threefold: gels are often a good way of making biological samples compatible with MS analysis (e.g. by removal of detergents), method development is not needed as SDS-PAGE is a well-established technique, and the number of identifications obtained per experiment is currently second to none. In fact, of the aforementioned protein-level separation techniques, the GeLC approach has been found to provide the highest number of confident protein or peptide identifications, although the alternative approach of immobilised pH gradient (IPG)-based IEF has the benefit of slightly higher sample recovery over the GeLC separation (Ref. Reference Fang, Robinson and Foster17). A recently developed fractionation method termed GELFrEE (gel-eluted liquid fraction entrapment electrophoresis) also separates proteins based on their size using a gel column; however, in contrast to the GeLC method, the proteins are eluted and collected in the liquid phase (Ref. Reference Tran and Doucette18). The researcher needs to be aware of these performance differences in first-dimension separations when deciding on the priorities for a given experiment.
Peptide separation
The development of powerful techniques and chemistries for separation at the peptide level has led many MS-based workflows to forgo the aforementioned protein-level separations entirely. Many options exist for the first-dimension separation, which have varying degrees of orthogonality: for example, reversed-phase chromatography, which resolves issues with solvent compatibility; or strong ion exchange, different forms of which can provide good sample complementarity. One of the most common first-dimension separations for large-scale proteomic experiments is peptide-level strong cation exchange (SCX) chromatography. There is no ‘best’ answer for separation; despite each of the techniques being optimal for particular sample types, they will all provide complementary results.
First-dimension separations can be performed off-line with a fraction collector, although when they are performed in-line with a reversed-phase column as the second dimension prior to MS, in a workflow called multidimensional protein information technology (MudPIT) (Refs Reference Washburn, Wolters and Yates19, Reference Lin, Alpert and Yates20), the experiment is capable of significant proteome coverage (approximately 60%) in one – albeit very long – experiment (Ref. Reference Bendall21). This type of workflow is described thoroughly in a published protocol (Ref. Reference Delahunty and Yates22). Reproducing an experiment of this type also provides 60% of the proteome, with a large number of the peptides sequenced being species that were not sequenced in the first experiment. It is estimated that it would take five MudPIT experiments performed in this way to achieve near-complete sequence coverage, a phenomenon attributed to MS/MS peptide-sampling rates. As with any MS-based analysis of complex samples, the limitations of this method are time and instrument duty cycle – issues that should be considered when designing experiments and choosing which proteomic approach to use. These limitations can be attenuated by conducting biological and technical repeats and maximising separation and fractionation prior to MS analysis. Also, the development of dynamic exclusion lists to avoid run-to-run resequencing of peptides has recently increased the number of extracellular proteins identified in repeat analyses of the human embryonic stem cell secretome by an order of magnitude (Ref. Reference Bendall21). Expanding the MudPIT workflow to include a third dimension of separation has also been shown to work well (Ref. Reference Wei23), and a study of the proteome of the serum of patients with sepsis utilised immunodepletion of abundant serum proteins followed by a 3D peptide-level separation, allowing the identification of low-abundance serum proteins while identifying ten potential serum biomarkers for sepsis (Ref. Reference Shen24). Although this type of technique shifts the limitation of the method towards separation time and away from the duty cycle of the instrument, the deployment of fast, ultrahigh-pressure liquid chromatography (UPLC) (Ref. Reference Shen25; http://www.waters.com/waters/nav.htm?locale=en_US&cid=10136122) in many laboratories is now proving that these methods are more powerful than ever.
Biochemical fractionation methods
The protein- or peptide-separation techniques described above allow in-depth analysis of a complex sample. However, biochemical fractionation procedures, which add an additional dimension of separation, can lead to even deeper resolution as the separation methods described previously can be performed on a less complex sample. This can be especially important in highly complex samples, such as human plasma or serum, which have a high dynamic range spanning at least ten orders of magnitude. These samples contain a small number of highly abundant proteins, whose signals can dominate MS-based analysis. Depletion of these proteins can be highly advantageous in allowing access to lower abundance species, including potential disease biomarkers, and there are many tried and tested depletion strategies available (Refs Reference Pernemalm, Lewensohn and Lehtio26, Reference Dwivedi27). For cellular studies, spatial information (e.g. which proteins are found in which organelles or which proteins interact with each other) can be extremely important for understanding a complex system, and can be obtained by applying either subcellular fractionation or affinity enrichment techniques.
Subcellular fractionation
For subcellular analysis, every classical biochemical fractionation procedure, whether it be membrane enrichment, nucleus precipitation or mitochondria preparation, can be used as the first enrichment step, followed by protein/peptide separation and MS analysis. For example, plasma membrane lipid rafts were enriched to follow the effects of DMSO-induced differentiation of HL-60 cells into neutrophils by LC-MS/MS, and out of 147 identified proteins, 25 were found to be upregulated and 49 were downregulated (Ref. Reference Yanagida28). In a different study, membrane fractionation and the hydrazide method were used to isolate 25 glycoproteins from breast cancer cell lines, which are considered putative cancer biomarkers (Ref. Reference Whelan29).
Immunoprecipitation
Affinity enrichment of a protein and its interaction partners decreases the complexity of a sample dramatically and provides information about the composition of the interaction network. Classical coimmunoprecipitation, a long-established method to isolate proteins, is the first step performed for this approach, applying either antibodies against endogenous proteins or immunoaffinity tags. Precipitated proteins are isolated afterwards and analysed as described earlier. In contrast to an immunoblot analysis, which requires a hypothesis about interaction partners and focuses on the identification of one protein, MS is an unbiased detection method and allows the discovery of several binding partners at once, including unexpected ones. However, MS is a very sensitive method and therefore stringent wash conditions, several controls and careful interpretation of the results are required to obtain correct information from this type of experiment (Ref. Reference Markham, Bai and Schmitt-Ulms30). For example, the interaction network of MYC was studied using the tandem affinity purification (TAP) approach, which allows stringent wash steps and thereby reduces false-positive identifications; 221 putative interaction partners were identified, of which only 17 were known before (Ref. Reference Koch31). Another approach was applied for the study of integrin-linked kinase (ILK), where a quantitative MS approach (see below) was used to distinguish between proteins binding to the bait protein or to the tag itself and allowed the identification of several novel ILK-interacting proteins (e.g. α-tubulin) (Ref. Reference Dobreva32). Two complementary affinity purification methods were used to identify over 40 kinases binding to dasatinib, an inhibitor with putative antitumour properties. In a second step, phosphorylated proteins were purified from cancer cells; 23 candidates identified in both pull-downs were analysed in more detail regarding their susceptibility to the inhibitor and several of these kinases were found to be inhibited by dasatinib (Ref. Reference Li33).
Phosphorylation-enrichment strategies
Enriching for PTMs also simplifies a complex sample, and studying the corresponding proteins can provide detailed information about signalling processes. Furthermore, even though PTMs can be identified by MS, the low stoichiometry of these modifications can lead to them being missed during analysis, a problem that can be overcome by specific affinity enrichment. One of the major modifications taking place during signal transduction is phosphorylation, the study of which – termed phosphoproteomics – has also pioneered technology development. Prior to MS analysis, phosphoproteins can be isolated by immunoprecipitations (e.g. by applying antibodies against phosphotyrosines) or phosphopeptides (containing modified serines, tyrosines and threonines) can be enriched by metal-supported chromatographies such as IMAC (immobilised metal affinity chromatography) (Ref. Reference Thingholm and Jensen34) or MOC (metal oxide chromatography) (Ref. Reference Sugiyama35) mostly utilising titanium dioxide. These methods have been established and optimised in recent years, and phosphoproteomics in combination with quantitative approaches such as stable isotope labelling of amino acids in cell culture (SILAC) or isobaric tags for relative and absolute quantitation (iTRAQ) (see the next section) now has the power to study time-dependent activation cascades (Ref. Reference Rogers and Foster36).
The epidermal growth factor (EGF) signalling pathway has been studied in detail by several groups using slightly different MS approaches and can be seen as a model system for the optimisation of phosphoproteomics (Ref. Reference Dengjel, Kratchmarova and Blagoev37). Mann and colleagues have applied many methods, including the application of antiphosphotyrosine antibodies (Ref. Reference Blagoev38), the use of titanium dioxide to enrich phosphopeptides (Ref. Reference Olsen39) and the combination of both enrichment approaches, on the way to developing a method termed qPACE, which allows the study of very early signalling events (Ref. Reference Dengjel40). For quantitation, they utilised SILAC. By contrast, White and colleagues used iTRAQ to study EGF receptor signalling using a combinational enrichment approach applying antiphosphotyrosine antibodies and IMAC (Ref. Reference Zhang41), and extended their methodology with selected reaction monitoring (SRM) experiments (which are explained in detail later in this review), allowing a much higher reproducibility (Ref. Reference Wolf-Yadlin42). Phosphoproteomics is now used to study other and unknown signalling pathways, as for example the SYK signalling cascade, which was originally described only in haematopoietic cells but has been investigated now in human cancer cells to shed more light on the role of this kinase in cancer formation (Ref. Reference Larive43).
With the help of the enrichment techniques described here, MS-based proteomics can achieve high spatial and functional resolution. However, as mentioned throughout this section, a quantitative dimension is also frequently necessary to answer many of the questions currently asked by researchers.
Quantitative approaches
The topic of MS-based quantitation exploded in the mid-2000s (Ref. Reference Ong and Mann44), and the current state of the art is reviewed thoroughly and engagingly elsewhere (Ref. Reference Elliott45). Essentially, despite quantitative proteomics still being an active area of research on its own, it is now also available to human health researchers who are interested in studying drug effects, biomarkers of disease and the pathways involved in disease processes.
Isotopic labelling techniques
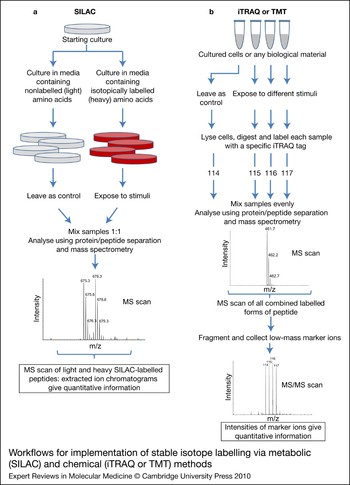
Mass spectrometers are not inherently quantitative. Differences in ionisation, transmission and detection efficiency dictate that the intensity of a signal from a particular molecule is a relative measure of its abundance, but not an absolute measure. For this reason, all quantitative proteomics, even ‘absolute’ quantitation is relative – relative to an internal standard’ (Ref. Reference Elliott45). MS-based proteomic quantitation was therefore not thrust into the mainstream until 1999, when isotope-coded affinity tags (ICATs) were introduced (Ref. Reference Gygi46). These tags were the first widely available method to quantify the relative concentrations of peptides or proteins in a sample, by way of an isotope-coded chemical modifier. Briefly, each of two samples is treated with either one of a ‘light’ or ‘heavy’ chemical reagent that binds specifically to cysteine residues. The light and heavy tags are chemically identical, except for isotopic differences. The two samples are then mixed and digested, and the tagged peptides are enriched using avidin or streptavidin chromatography against the biotin moiety embedded in the tag. On performing MS analysis on these enriched samples, the chemically identical species from the two samples will coelute from a column and ionise with identical efficiency; however, the peptide that is modified with the ‘light’ form of the reagent will appear at a known lower mass in the spectrum than the ‘heavy’ tagged equivalent peptide from the other sample. One can then directly compare the peak areas of the two chemically identical coeluting peptides and thereby obtain a relative measure of their abundance. Relative quantitation, performed through isotope-coding methods similar to this, is the best way to obtain information about quantitative differences in protein expression, especially from the complex samples usual in proteomics (Fig. 2).
Workflows for implementation of stable isotope labelling via metabolic (SILAC) and chemical (iTRAQ or TMT) methods. (a) SILAC incorporates isotopes early in the sample preparation procedure, maximising accuracy and reproducibility, and is generally used only for quantitation of samples from cells that can be cultured. Isotope incorporation into the amino acids themselves means peptides to be compared have different masses; therefore quantification occurs from the MS scan. (b) Chemical isotope-coded tags are applied later in the workflow, but can be applied to any biologically derived sample. Isobaric chemical tags (iTRAQ, TMT) add equivalent masses to the peptides in the sample, but produce specific marker ions upon fragmentation, allowing quantification from the MS/MS scan. Abbreviations: iTRAQ, isobaric tags for relative and absolute quantitation; MS, mass spectrometry; MS/MS, tandem mass spectrometry; SILAC, stable isotope labelling of amino acids in cell culture; TMT, tandem mass tag.

One issue with the ICAT method described above, however, is its dependence on the modification of cysteine residues, which account for only 1.42% of the amino acids in a sample (Ref. Reference Gevaert47). Many peptides, and even whole proteins, do not contain a cysteine, and are therefore unquantifiable by means of ICAT. This problem was resolved in 2004 with the introduction of the isobaric tags for relative and absolute quantitation (iTRAQ) label (Ref. Reference Ross48) (Applied Biosystems; http://www.appliedbiosystems.com). With this tag, initially four, and now up to eight, samples can be compared together, using labels with identical mass shifts. This is achieved through the differential placement of the stable isotopes onto ‘balance’ and ‘reporter’ pieces of the tag, which are separated by a labile bond. Each of the different tag ‘flavours’ adds the same overall mass to a peptide, bound through the balance group to the primary amines on lysine side chains and the N-termini of peptides. On mixing of the samples, unlike ICAT-labelled samples, tagged peptides will appear as one signal in a normal MS scan. Only upon fragmentation does the labile bond holding the iTRAQ modification together dissociate, forming an intense marker ion from the reporter group, each of which will be specific for one of the samples to be compared. This behaviour allows for high specificity (marker ion intensity can only be from the peptide currently being fragmented) and high sensitivity because the isobaric nature of the tag dictates that the intensities of the signals from all samples are additive for initial detection in the MS scan, and subsequent sequencing. This technique has also been successfully used in the tandem mass tag (TMT) strategy from Thermo Scientific (http://www.piercenet.com).
These types of chemical labelling strategies are a good choice when probing the proteome of human cells or tissues that cannot or should not be cultured. Unfortunately, as the combination of the samples to be compared occurs late in this workflow, there is a chance of systematic errors during sample handling (Fig. 2). Metabolic labelling techniques, in which cells are grown in isotopically labelled media and compared with those grown in normal media, have been shown to be the most accurate proteomic quantitation method mainly due to the ability to combine samples very early in the procedure (e.g. immediately after lysis), thus minimising errors involved with differential sample handling in the subsequent isolation and purification steps (Ref. Reference Blagoev38). Unfortunately, SILAC (Ref. Reference Ong49) can only be used on cells cultured in vitro, as controlling the isotopes available to a biological sample can be problematic. Although SILAC quantitation on a whole mouse has been successfully performed (Ref. Reference Kruger50), this type of experiment is prohibitively expensive and time consuming for most research projects and species types. Recently, however, a technique that uses a combination of five SILAC-labelled cell lines, pooled together, has been introduced as a ‘physical proteome database’, which was then compared with a nonlabelled carcinoma tissue sample, allowing the SILAC quantitation of uncultured human tissue cells (Ref. Reference Geiger51). This new technique allowed quantitative comparison of lobular and ductal tumours, revealing significant differences, with very low coefficients of variance, in the expression of focal adhesion and glycolytic proteins, in a clinically relevant human tissue sample.
Label-free quantitation
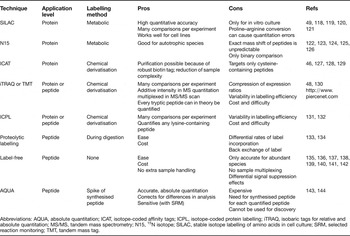
Given that the intensity of the signal in a mass spectrometer is innately a proxy of the abundance of the species in the sample, label-free quantitation approaches have recently entered the mainstream because of their apparent ease, simplicity and cost savings. One of the numerous label-free quantitation approaches is ‘spectral counting’, in which the MS/MS spectra collected for a given species are counted and compared with those collected for the same species in a different sample. This technique uses the assumption that unbiased, intensity-based precursor ion selection leads to intense ions being selected for sequencing more frequently. The number of MS/MS spectra collected for a given analyte would therefore be a proxy of its intensity, and therefore its abundance. Like all label-free quantitation methods, systematic errors in the analysis, such as signal suppression, detector saturation and differential sample loading, occur. These errors need to be minimised and accounted for by performing many replicates, normalising the data, and statistical validation (Refs Reference Elliott45, Reference Li and Roxas52). Although this approach has been shown to be adequate for quantitation of high-abundance components of a mixture (Ref. Reference Old53), isotopic labelling techniques, which correct for these systematic errors and also allow for sample multiplexing, are still the method of choice for quantitative proteomics. The commonly used quantitative proteomic methods, along with their strengths and weaknesses, are shown in Table 1.
MS quantitation techniques

Abbreviations: AQUA, absolute quantitation; ICAT, isotope-coded affinity tags; ICPL, isotope-coded protein labelling; iTRAQ, isobaric tags for relative and absolute quantitation; MS/MS, tandem mass spectrometry; N15, 15N isotope; SILAC, stable isotope labelling of amino acids in cell culture; SRM, selected reaction monitoring; TMT, tandem mass tag.
Targeted analysis: selected reaction monitoring
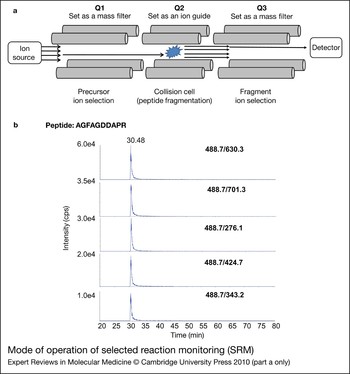
Unlike global proteomic techniques, which operate based on intensity-dependent fragmentation of precursor ions and are biased towards more abundant proteins, SRM (also known as multiple reaction monitoring, MRM) targets predetermined precursor ions for fragmentation (Fig. 3). This allows peptides from a particular protein of interest to be monitored, giving access to lower abundance species even in complex mixtures such as plasma and serum (Ref. Reference Lange54). For years, SRM has been used effectively to detect and quantify drugs and drug metabolites in pharmaceutical research (Ref. Reference Kim and Kim55). Today, it is rapidly becoming the method of choice in many fields owing to its consistency, accuracy and sensitivity. This includes basic proteome research, where advances in development and validation of these assays, as well as novel software and data repositories, are increasing the potential of the SRM approach in whole-proteome analysis. In clinical research, its potential as a biomarker verification tool is thought by some to rival the standard ELISA method and there is huge potential for the application of this approach in clinical diagnostics. The amount of sample required for SRM analysis is small, and its sensitivity is high (attomole level) (Ref. Reference Picotti56); therefore, it is suitable for the analysis of samples containing small amounts of material, such as neonatal screening and therapeutic drug monitoring, meeting the throughput requirements of clinicians (Refs Reference Kim and Kim55, Reference Nagy57).
Mode of operation of selected reaction monitoring (SRM). (a) After protein/peptide separation, peptides elute from a reversed-phase column, ionise, and enter a triple quadrupole mass spectrometer. The first quadrupole (Q1) is set as a mass filter for a specific peptide; Q2 is set as an ion guide/collision cell, where peptides selected in Q1 are fragmented; and Q3 is set as a mass filter that specifically transmits a particular fragment ion. When specific peptide–fragment transitions occur, a signal is recorded by the detector, which can be plotted as a chromatogram. (b) Example chromatograms from an SRM experiment are shown. The SRM tool at the Global Proteome Machine was used to design five transitions (Q1/Q3 ion pairs) for the peptide AGFAGDDAPR from the protein β-actin (ACTB). A complex mixture, digested human platelet lysate, was used as the test sample. The resulting transitions display sufficient intensity and specificity to allow for positive identification of this peptide in the sample. The Q1/Q3 m/z ratios for each transition are displayed on the graphs in bold and the elution time (30.48) is indicated. Quantitation of the transition can be conducted using the peak area. As SRM is a fast and sensitive method, many transitions can be acquired serially in a short time, allowing quantitation of multiple transitions in a single experiment. SRM transitions (b) are reprinted from Ref. Reference Walsh59 (©2009), with permission from Elsevier. Abbreviations: Q, quadrupole; m/z, mass to charge ratio; SRM, selected reaction monitoring.

Experimental design
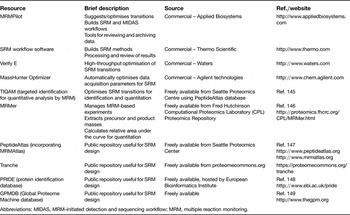
Targeting the most appropriate peptides and fragment ions for the protein of interest is key to a successful SRM experiment; therefore some prior experimental knowledge is required. This translates into knowing the mass to charge ratio (m/z) of an abundant, consistently produced (or ‘proteotypic’) peptide (Ref. Reference Mallick58) as well as the m/z of one of its fragment ions that is generated with high intensity. These ‘transitions’ (specific precursor–fragment ion pairs) allow targeted analysis of a particular peptide in a complex mixture. There are many guidelines that can aid in the selection of appropriate transitions, based on prior experimentation, physicochemical parameters and in silico predictions (Ref. Reference Walsh59). These take into account factors that are too numerous to describe in detail here, but are outlined in several recent reviews (Refs Reference Lange54, Reference Han and Higgs60). There are multiple software options available to aid the design and optimisation of these transitions (Ref. Reference Cham Mead, Bianco and Bessant61). Many are reviewed elsewhere (Ref. Reference Yocum and Chinnaiyan62), with a selection listed in Table 2. Although this design stage can take considerable time, once transitions are established, they can be used indefinitely for experiments studying the protein of interest.
Examples of selected reaction monitoring (SRM) resources
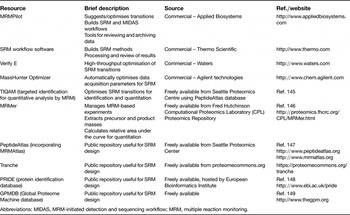
Abbreviations: MIDAS, MRM-initiated detection and sequencing workflow; MRM, multiple reaction monitoring.
SRM and quantitation
The SRM approach can be used to quantitate proteins. Relative quantitation can be conducted simply by comparing the absolute peak area of the individual samples (label-free quantitation), although it is difficult to obtain precise measurements because of differences in ionisation efficiency, analyte composition and chromatography. SRM experiments can also be combined with many of the standard isotope labels used in quantitative proteomic experiments, including ICAT, SILAC, ICPL and iTRAQ. Additionally, several methods that aid greatly in speeding up the assay development aspect of SRM have emerged, including databases such as MRMAtlas (Ref. Reference Picotti63) and a method of crude synthetic peptide library production, which allow the rapid generation of validated SRM assays for whole proteomes (Ref. Reference Picotti56). These approaches have been pioneered using the yeast proteome, but the development of databases and resources such as this for clinically relevant tissues could help thrust SRM-based quantitation firmly into the clinical arena.
Applications of SRM
The advantages of SRM experiments have led to an almost exponential increase in the number of studies using this approach in recent years (Ref. Reference Yocum and Chinnaiyan62), and SRM has now been applied to many diverse biological questions, from the quantitation of the biomarker C-reactive protein (CRP) in the serum of patients with rheumatoid arthritis (Ref. Reference Kuhn64) to the absolute quantitation of the human liver alcohol dehydrogenase ADH1C1 isoenzyme (Ref. Reference Janecki65) and pyruvate kinase M2 (PKM2), a potential endometrial cancer marker (Ref. Reference DeSouza66). The approach has been shown to be extremely powerful, both in confirmation of potential biomarkers and in discovery of novel biomarkers, as seen in a recent study that integrated high-throughput and SRM-based approaches to explore breast cancer in a mouse model (Ref. Reference Whiteaker67). SRM is also a promising tool to study splice variants that are putative biomarkers for cancer cells. For example, using the breast cancer mouse model mentioned above, 216 of 608 splice variants were found only in tumour cells and SRM is ideally suited to study these (Ref. Reference Menon and Omenn68). Using SRM coupled with stable isotope dilution MS (SIDMRM-MS), quantitative, multiplexed assays were developed for the analysis of six proteins clinically relevant to cardiac injury (Ref. Reference Keshishian69). These widely applicable assays were conducted using plasma samples, with proteins of interest spanning four orders of magnitude. These were quantitated using a few signature peptides from each target protein, with limits of quantitation ranging between 2 and 15 ng/ml. Similarly, low ng/ml sensitivity quantitation of the prostate-specific antigen biomarker was achieved using LC-MS/MS SRM, from 100 µl of serum, demonstrating good correlation with ELISA measures (Ref. Reference Fortin70). Even greater sensitivity was achieved in a recent study that captured and enriched peptides with antipeptide antibodies and then used SRM-based analysis to quantitate aberrant GlcNAcylated tissue inhibitor of metalloproteinase 1 (TIMP1), a protein implicated in colorectal cancer (Ref. Reference Ahn71). Following enrichment and digestion of glycoproteins from patients' serum, SISCAPA (stable isotope standards and capture by antipeptide antibodies) (Ref. Reference Anderson72) and SRM-MS permitted highly sensitive quantitation of TIMP1 at attomolar concentrations. Automation and multiplexing of this approach shows great potential for analysing large numbers of biomarkers with sufficient sensitivity, reproducibility and precision for clinical applications (Ref. Reference Whiteaker73).
Still, proven reproducibility is essential for SRM assays to move beyond basic research and become a force in clinical or diagnostic assay development and application. A recent, multisite review demonstrated high reproducibility across different laboratories using different instrument platforms (Ref. Reference Addona74). Another recent review questioned whether SRM-MS will replace antibody-based testing in the validation of biomarkers (Ref. Reference Issaq and Veenstra75). SRM-MS has several advantages over antibody assays for biomarker validation: SRM has exquisite sensitivity, with no crossreactivity and less specificity issues than are often associated with antibody assays; SRM is ‘reagent independent’; SRM can be used for any MS-observable ion, making it generally cheaper than antibody assays (Ref. Reference Latterich, Abramovitz and Leyland-Jones76); and these assays are quantitative and easily multiplexed. This is a key point, as reality dictates that having a single biomarker for a disease is unlikely; panels of biomarkers are the more likely future of disease diagnostics, and SRM technologies are very well placed to study these. Issues still remain however, particularly regarding assay throughput and precision, which have not been thoroughly tested and currently do not meet the US Food and Drug Administration (FDA) requirements for routine clinical tests (Ref. Reference Issaq and Veenstra75). Another issue is operator familiarity, as these assays are only beginning to enter the mainstream, and it will take time for users to become comfortable with applying these new techniques. However, the hurdles facing the use of SRM in biomarker validation are slowly being overcome, and although antibody assays will still be used for biomarker validation, increasingly we can expect to see the application of SRM assays.
Bioinformatic analysis
With the rapid development of MS-based proteomic technologies, automated analysis of the qualitative and quantitative data resulting from large-scale proteomic studies has become increasingly important and challenging (Ref. Reference Malik77). The large number of MS/MS spectra generated in a typical proteomic experiment requires several stages of analysis, including statistical validation of peptide and protein identifications, analysis of any quantitative information and interpretation of the resultant protein information.
Protein identification
Identification of peptides and their corresponding proteins is generally conducted using search algorithms that correlate experimental MS/MS spectra to theoretically derived spectra created from known peptide sequences. There are several different search engines available, which differ in their approaches to identifying peptide sequences. The most common search algorithms include Sequest (Ref. Reference Eng, Mccormack and Yates78), Mascot (Ref. Reference Perkins79) and X!Tandem (Ref. Reference Craig and Beavis80). It is worth noting that these search engines are complementary to some extent, so it is often useful to use at least two different algorithms to analyse MS/MS data to increase confidence and sensitivity, and there are tools available to aid this (Ref. Reference Price81). Validation of the peptide and protein identifications is necessary and is often conducted by determining false discovery rates using decoy databases and other statistical methods (Ref. Reference Li, Pizarro and Grosser82). For de novo sequencing of proteins, an approach that is useful in the analysis of PTMs or of organisms whose genome has not been sequenced, there are several software options available, including PEAKS (Ref. Reference Ma83).
Analysis of quantitative proteomic data
Tools for the analysis of quantitative data from proteomic experiments are continuously emerging and being refined. The Trans-Proteomic Pipeline (Ref. Reference Keller84) is a collection of integrated MS/MS analysis tools, including XRPESS and ASAPRatio that are used for the relative quantitation of isotopically labelled peptides and proteins. MaxQuant is a recently developed software suite for the analysis and quantitation of SILAC experiments (Ref. Reference Cox and Mann85). Similarly, Mascot Distiller, from Matrix Science, determines quantitation based on the relative intensities of extracted ion chromatograms for precursors (http://www.matrixscience.com). This approach can be used for ‘label-free’ approaches, or with any chemistry that creates a precursor mass shift, for example 18O, AQUA, ICAT, ICPL, metabolic labelling and SILAC. ProteinPilot, from Applied Biosystems (http://www.appliedbiosystems.com), provides protein identification and quantitation of SILAC- and iTRAQ-based labels. For label-free approaches, there are many open-source and commercial software packages available, which are discussed in a recent review (Ref. Reference Wang86). It is worth noting that for the analysis of quantitative proteomic data, no standard procedure has been developed that is broadly applicable to all experiment types. As is evident, many software tools exist, and the user still needs to understand what the software is doing in order to be able to critically analyse the results.
Data-mining approaches
With the rapid growth in large-scale proteomic experiments comes the generation of longer and longer lists of proteins. However, the sound biological interpretation of these data lags behind (Ref. Reference Malik77). There are now several analytical strategies and tools available to extract biologically relevant information (e.g. regarding protein–protein interactions, signalling pathways and biological networks) from these large proteomic datasets. These ‘data-mining’ approaches have the potential to contribute to a deeper understanding of biological systems, but need to be applied and interpreted correctly. One of the most powerful tools available, and often the first tool used to conduct analysis on a large dataset, is Gene Ontology (GO) (Ref. Reference Ashburner87). This is a controlled vocabulary that is used to standardise the way in which proteins are described across different species and databases. The consistency in terminology that this ontology provides makes it an invaluable resource for both experimentalists and bioinformaticians. GO annotation of a large MS dataset can be used to determine whether there is any enrichment or depletion for a particular GO category, or can be used to compare two different datasets.
Pathway and network analysis
Another useful approach is pathway analysis, which explores proteomic data in terms of biological pathways, based on known physical and functional interactions between proteins that are present. It is estimated that there are around 300 biochemical pathway analysis tools currently available (Ref. Reference Malik77), with the Kyoto Encyclopedia of Genes and Genomes (KEGG) and Reactome representing the largest databases. Many of the pathway analysis tools are freely available, but there are also some commercially available tools – for example, Ingenuity Pathways Analysis from Ingenuity Systems, and GeneGo from GeneGo Inc. With so many pathway analysis options to choose from, Pathguide (http://www.pathguide.org), which contains information on about 317 biological pathway tools, is an invaluable resource to help guide users in selecting the most appropriate resource to use (Ref. Reference Bader, Cary and Sander88). Pathguide also covers tools that model network and functional interaction information, which takes the data beyond pathway analysis and groups proteins based on participation in larger, multiprotein assemblies. For visualisation of molecular networks, Cytoscape is a useful open-source platform, which also allows integration of genetic and other information (Refs Reference Shannon89, Reference Cline90). There are now several meta-databases for interaction information, including STRING (Refs Reference Snel91, Reference Jensen92), which generates interaction networks by incorporating data from many curated databases, as well as predicted interactions and pathway information. Data can be input to STRING as protein lists, and it has a user-friendly interface. MiMI, from the National Institute for Integrative Biomedical Informatics, merges data from numerous interaction databases as well as other sources and also has a Cytoscape plug-in to allow easy visualisation of networks (Ref. Reference Tarcea93). For all interaction databases, which can have high error rates, care needs to be taken when interpreting information and the source of the interaction information should be checked manually if possible.
Meta-data analysis and data integration
One of the key challenges currently facing researchers is the integration of all these available data. There are several tools available for meta-data analysis of proteomic data, including the database for annotation, visualisation and integrated discovery (DAVID), from the National Institute of Allergy and Infectious Diseases (NIAID), which provides a comprehensive set of functional annotation tools for investigators to understand the biological meaning behind large lists of genes. Other meta-tools include PANTHER (protein analysis through evolutionary relationships, http://www.pantherdb.org), which was designed to classify proteins (and their genes) in order to facilitate high-throughput analysis, and Babelomics, which is a suite of interconnected tools used to functionally annotate genome-scale experiments. Conceptgen, from the National Institute for Integrative Biomedical Informatics, is a web-based tool designed to explore networks of relationships between biological concepts (Ref. Reference Sartor94). The Global Proteome Machine (http://www.thegpm.org), a search engine and database for MS/MS data, links the protein identifications directly to annotation resources such as GO and KEGG within the same platform, allowing efficient examination of the GOs and pathways under- or over-represented in a particular dataset.
Discussion: biological and clinical applications
One of the initial goals of proteomics was the collection of inventories of whole proteomes. By applying subcellular and protein/peptide fractionation approaches, MS-based proteomics has had marked success in this endeavour, especially with the more abundant components. Many of the proteomes relevant to human health research are now well characterised, including those of human blood cells (Refs Reference Qureshi95, Reference D'Alessandro, Righetti and Zolla96, Reference Pasini97, Reference Haudek98), plasma (Ref. Reference Omenn99), cerebrospinal fluid (Ref. Reference Pan100), bronchial epithelia (Ref. Reference Steiling101), heart muscle (Refs. Reference Kline102) and a variety of cancer tissues and cells (e.g. Refs Reference Buhrens103, Reference Roth104, Reference Roesli105). The Normal Clinical Tissue Alliance (NCTA, http://wiki.thegpm.org/wiki/Normal_Clinical_Tissue_Alliance) provides high-quality proteomic catalogues of clinically relevant normal human tissues, such as brain and bone, and also bodily fluids, including bronchoalveolar lavage, saliva and urine. Global proteomic analysis can also be a helpful tool to investigate cell subtypes, as shown recently by applying a proteomic approach to demonstrate that the so-called endothelial progenitor cells may actually be monocytes that had taken up platelet microparticles (Ref. Reference Prokopi106).
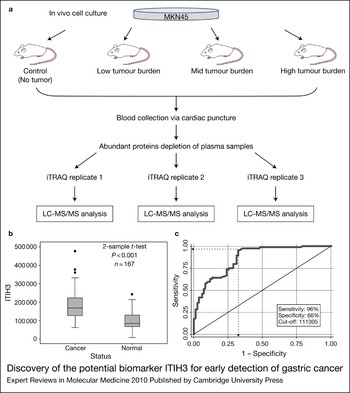
However, the real strength behind proteomic approaches lies in the ability to compare and quantitate samples. Formerly, 2D gel analysis was one of the only ways to gain quantitative information on a set of proteins, and although there are still many current publications successfully using this approach, alternative techniques such as isotopic labelling are currently supplanting 2D gels as a preferred quantitation method. Many studies applying these approaches have successfully identified biomarkers with clinical potential. For example, a recent study used a combination of murine cancer models and iTRAQ quantitation to discover a novel, putative biomarker for gastric cancer (Ref. Reference Chong107) (Fig. 4). The biomarker was then validated in serum from cancer patients. Quantitation is especially important in the study of time-dependent processes, such as the changes that take place during storage of blood before transfusion. The platelet storage lesion has been studied by applying several complementary quantitative proteomic approaches to platelets at days 1 and 7 of storage (Ref. Reference Thon108). 2D gel electrophoresis/differential gel electrophoresis (DIGE), iTRAQ and ICAT were used, resulting in 503 protein changes identified over the course of storage, the majority of which were identified using the iTRAQ method. Despite this, the benefit of using multiple quantitative proteomic approaches was evident, as less than 16% of the 503 proteins were identified by two or more proteomic approaches and only five proteins were identified by all approaches.
Discovery of the potential biomarker ITIH3 for early detection of gastric cancer. (a) A mouse xenograft model was used to identify putative biomarkers for gastric cancer. Tumours were induced in mice with the human gastric cancer cell line MKN45 and mice were categorised according to tumour burden [low (length, L = 1–2 mm, volume, V = 2–3 mm3); mid (L = 7.5 mm, V = 127–210 mm3); high (L = 15 mm, V = 726–1078 mm3)]. Plasma from these mice and a control group was labelled with four different iTRAQ labels and studied by LC-MS/MS. Triplicates were performed to obtain high-quality data. (b) Thirty-one proteins were identified as putative biomarkers, and the presence of one of these proteins, ITIH3, was analysed in serum derived from healthy humans (normal) and gastric cancer patients (cancer) by immunoblotting. ITIH3 levels were found to be elevated significantly (P-value <0.001) in cancer patients. (c) An ROC curve was generated using the data from (b) to estimate the accuracy of ITIH3 detection in gastric cancer detection. Sensitivity was determined to be very high, at 96%, whereas specificity was slightly lower, at 66%. The area under the ROC curve was found to be 0.86 (with 0.5 being a useless and 1.0 a perfect test), which implies that ITIH3 could be a valuable biomarker in early gastric cancer detection. Figure adapted with permission from Ref. Reference Chong107 (©2010 American Chemical Society). Abbreviations: iTRAQ, isobaric tags for relative and absolute quantitation; LC-MS/MS. liquid chromatography tandem mass spectrometry; ROC, receiver operating characteristics.

Combining the technologies discussed in this review is a good way of utilising the power of MS-based proteomics for targeted clinical studies. For example, tandem affinity purifications, GeLC-MS/MS and iTRAQ quantitation have been used to map the interactome of the drug target BCR–ABL, a tyrosine kinase causing chronic myeloid leukaemia (Ref. Reference Brehme109). A tightly bound cohort of interconnected proteins around BCR–ABL, which remodels on inhibitor treatment, was found, suggesting that the effect of the drugs is caused by a remodelling of the BCR–ABL complex instead of a simple inhibition of the protein itself. In a complementary approach, novel kinase and nonkinase targets of three BCR–ABL inhibitors were discovered utilising GeLC-MS/MS, iTRAQ quantitation and IMAC phosphopeptide enrichment, showing that these MS-based experiments are a valuable tool to discover and study additional drug targets (Ref. Reference Bantscheff110).
However, the clinical application of MS-based proteomics still faces several challenges (Ref. Reference Apweiler111). Certain experiments and many putative clinical applications require the analysis of very small amounts of cells (Reference Pan100–1000). MS is a very sensitive method and in principle allows the analysis of single cells (Ref. Reference Whittal, Keller and Li112). However, one major problem in the analysis of few cells lies in the standard sample preparation and digestion protocols used for MS-based proteomics, during which a high percentage of the sample can be lost (Ref. Reference Apweiler111). An optimised lysis and digestion method was developed to address this problem, which is performed in one tube. Furthermore, by optimising the parameters of the LC-MS/MS system for the analysis of small amounts of cells it was possible to analyse as few as 500 cells, from which 167 proteins were identified (Ref. Reference Wang113). Another problem still faced by the proteomic community is accessibility to low-abundance proteins, particularly in the presence of high-abundance proteins, such as in the analysis of serum. Depletion methods can be used to remove these proteins in order to investigate lower abundance proteins; however, some peptides and proteins bind to these carrier proteins and are discarded through this procedure. As an alternative approach, a differential solubilisation method was developed to enrich for low-abundance proteins in plasma. By analysing these enriched fractions with high-quality MALDI-TOF (time of flight), more than 1500 peptides from a 1 µl serum sample were identified and four new potential colon cancer biomarkers were discovered (Ref. Reference Kawashima114). This approach has the potential to greatly contribute to the discovery of novel low-abundance biomarkers. One aspect that is especially important for the analysis of biomarkers in serum is reproducibility: it has been shown that serum proteins are degraded by endogenous proteases shortly after a blood draw, leading to varying results. However, the addition of protease inhibitors to the blood drawing tubes can counteract this effect and stabilise serum proteins (Ref. Reference Yi, Kim and Gelfand115).
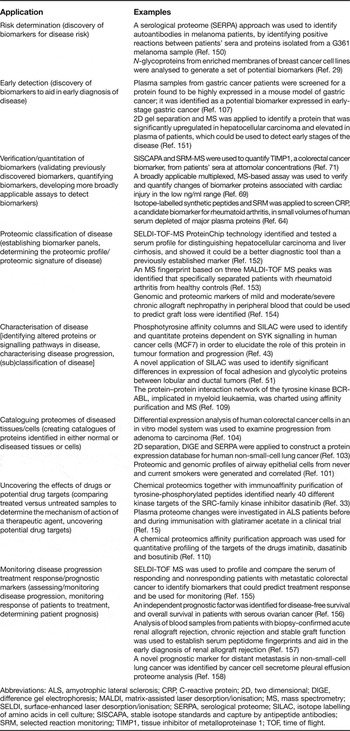
As outlined in this article, MS-based proteomic approaches are now applied to many diverse aspects of clinical research, some of which are highlighted in Table 3, and the ultimate hope is for the development of diagnostic and prognostic tools that will benefit human health. As more potential biomarkers move from the discovery phase towards clinical trials, there is the need for accurate statistical and mathematical analysis of the data, in order to better determine key outcomes, for example precision and accuracy, using standardised tests such as positive predictive value (Ref. Reference Ransohoff116).
Recent examples of clinical applications of proteomics

Abbreviations: ALS, amyotrophic lateral sclerosis; CRP, C-reactive protein; 2D, two dimensional; DIGE, difference gel electrophoresis; MALDI, matrix-assisted laser desorption/ionisation; MS, mass spectrometry; SELDI, surface-enhanced laser desorption/ionisation; SERPA, serological proteome; SILAC, isotope labelling of amino acids in cell culture; SISCAPA, stable isotope standards and capture by antipeptide antibodies; SRM, selected reaction monitoring; TIMP1, tissue inhibitor of metalloproteinase 1; TOF, time of flight.
Conclusion
The developments discussed above point to the future potential of the proteomic approach for the exploration of key questions in basic and clinical research as well as in establishing tools for clinical diagnostics, while emphasising the continued importance of technology and method development in pushing the boundaries of MS-based proteomics. The development of high-throughput technologies such as the recently established SRM assays for mapping the kinases and phosphatases of Saccharomyces cerevisiae makes the quantitative analysis of whole proteomes more realistic (Ref. Reference Picotti56). A major movement already under way is the Human Proteome Project, which will be formally launched at the HUPO 2010 congress and plans to map the human proteome in a manner analogous to the mapping of the human genome. Three different experimental approaches are proposed to achieve this: MS-based proteomics to identify and quantify proteins in tissues and cells, generation of antibodies against each protein to show cellular location, and systematic identification of interactors for every protein. This ambitious project requires established standards for proteomics-based profiling, antibody-based profiling and network-based profiling, as well as a massive bioinformatics effort to analyse, archive and make available the ensuing data (Ref. 117). With a projected ten-year time line, the Human Proteome Project includes a clear clinical focus, with its stated aim being the creation of a resource immediately available to the clinical and basic science communities in a format that assures fundamental discoveries and insight into diagnostic and treatment regimens for the patient (Ref. 117). The aspirations of the Human Proteome Project emphasise the hoped-for impact of proteomics on human health research and highlight once again the steady march of proteomics into the clinical realm.
Acknowledgements and funding
The authors acknowledge the Canadian Institutes for Health Research, the Natural Sciences and Engineering Research Council of Canada, and the Michael Smith Foundation for Health Research for funding. G.M.W. is supported by a postdoctoral fellowship from the Canadian Institutes of Health Research/Heart and Stroke Foundation of Canada Strategic Training Program in Transfusion Science through the Centre for Blood Research at the University of British Columbia. The authors thank the referees for their instructive comments.