1 Introduction
Recent innovations in communication infrastructure with easy access to mobile social networks and e-commerce applications, such as Twitter, Facebook, Amazon, Instagram, Path, and Foursquare have shifted the focus of the research community from information extraction, to the filtering of relevant information (Bobadilla et al., Reference Bobadilla, Ortega, Hernando and Gutiierrez2013). In such advancements, users can effortlessly share a variety of life experiences in the physical world via smart phones and other mobile devices. Moreover, recent advancements in position localization techniques have primarily improved the social networking services that result in sharing users location-related information (Bao et al., Reference Bao, Zheng, Wilkie and Mokbel2015). The exponential increase in the quantity and diversity of already massive volumes of data with interacting Web services and networked devices results in an increased complexity for service providers and end users to search, discover, and access significant personalized information (Bobadilla et al., Reference Bobadilla, Ortega, Hernando and Gutiierrez2013).
Recommendation systems (RSs) were introduced in the early 1990s to deal with the challenges of personalized and automatic data retrieval from diverse sources of information (Bobadilla et al., Reference Bobadilla, Ortega, Hernando and Gutiierrez2013). Various knowledge discovery-based techniques are applied to users contextual and historical data to extract information, services, and products that place paramount importance on a users preference. RS use a variety of data sources to provide prediction and recommendation of items that match users preferences. Such systems attempt to balance various factors such as stability, accuracy, disparity, and novelty in the recommendations (Bobadilla et al., Reference Bobadilla, Ortega, Hernando and Gutiierrez2013).
Innovative mobile social networks, such as Foursquare, Facebook, and Instagram have initiated a new wave of research in the area of location-based recommendation system (LBRS). Such services collect huge volumes of data such as comments, check-ins, and locations on a daily basis. The existence of the huge volumes of data has shifted the focus of researchers from the problem of information retrieval to data refinement such that the information extracted must be more specific and related to the users query. The existing approaches used in various LBRS mostly rely on collaborative filtering (CF) (Lü et al., Reference Lü, Medo, Yeung, Zhang, Zhang and Zhou2012; Bao et al., Reference Bao, Zheng, Wilkie and Mokbel2015; Bobadilla et al., Reference Bobadilla, Ortega, Hernando and Gutiierrez2013). However, most of the existing approaches commonly face the issues such as (a) data sparseness: when limited number of users visits to places results in sparse user-to-location matrix (Lü et al., Reference Lü, Medo, Yeung, Zhang, Zhang and Zhou2012); (b) cold start: occurs when the system generates recommendation for a user who is new to the system, and not sufficient data are already present for the users past activities (Doytsher et al., Reference Doytsher, Galon and Kanza2011; Lü et al., Reference Lü, Medo, Yeung, Zhang, Zhang and Zhou2012); and (c) scalability: refers to the ability of a RS to maintain the performance under an increased load, especially when performing real-time parsing of massive volumes of data (Chang et al., Reference Chang, Wei, Yeh and Peng2011; Doytsher et al., Reference Doytsher, Galon and Kanza2011; Noulas et al., Reference Noulas, Scellato, Mascolo and Pontil2012). For the past few years, there has been significant research in the area of RS (Jannach et al., Reference Jannach, Zanker, Felfernig and Friedrich2010; Bobadilla et al., Reference Bobadilla, Ortega, Hernando and Alcalá2011; Burke et al., Reference Burke, OMahony and Hurley2011; Cacheda et al., Reference Cacheda, Carneiro, Fernandez and Formoso2011; Cantador et al., Reference Cantador, Castells and Bellogín2011; Bostandjiev et al., Reference Bostandjiev, O’Donovan and Höllerer2012; Konstan & Riedl, Reference Konstan and Riedl2012; Lü et al., Reference Lü, Medo, Yeung, Zhang, Zhang and Zhou2012; Park et al., Reference Park, Kim, Choi and Kim2012; Felfernig et al., Reference Felfernig, Jeran, Ninaus, Reinfrank and Reiterer2013; Guy, Reference Guy2015; Pirasteh et al., Reference Pirasteh, Hwang and Jung2015). In the literature, the authors used different approaches to deal with the challenges of personalized data retrieval from diverse sources of information. The majority of existing work utilized various approaches, such as content-based filtering and CF with an intention to balance various factors such as accuracy, diversity, novelty, familiarity, and so on. Moreover, the existing work also attempted to deal with challenges, such as scalability, cold start, and data sparseness that are frequently encountered in RS.
In recent years, various literature surveys have been presented summarizing commonly used techniques and challenges in the field of RS (Desrosiers & Karypis, Reference Desrosiers and Karypis2011; Chen & Pu, Reference Chen and Pu2012; Pu et al., Reference Pu, Chen and Hu2012; Verbert et al., Reference Verbert, Manouselis, Ochoa, Wolpers, Drachsler, Bosnic and Duval2012; Zuva et al., Reference Zuva, Ojo, Ngwira and Zuva2012; Bobadilla et al., Reference Bobadilla, Ortega, Hernando and Gutiierrez2013; Sharma & Gera, Reference Sharma and Gera2013; Shi et al., Reference Shi, Larson and Hanjalic2014). Bobadilla et al. (Reference Bobadilla, Ortega, Hernando and Gutiierrez2013) provided a general overview of recommender systems and discussed various CF algorithms. The authors also provided classification in terms of similarity, neighborhood, predictions, and recommendations. Moreover, the aforementioned survey provided a discussion on various K-nearest neighbors (KNN) schemes for RS and the cold start issues, along with evaluations. However, the authors did not specifically discuss location-based recommendations. In the article presented in Sharma and Gera (Reference Sharma and Gera2013) and Shi et al. (Reference Shi, Larson and Hanjalic2014), the focus is on the research challenges of RS. The authors provided an overview of the major techniques like CF, content-based filtering, and hybrid recommendations along with the various challenges faced by such techniques. The authors in Pu et al. (Reference Pu, Chen and Hu2012) and Zuva et al. (Reference Zuva, Ojo, Ngwira and Zuva2012) attempted to summarize the evaluation metrics and techniques used in RS. In the latest survey on RS, the main focus is on neighborhood-based recommendation methods used for item recommendation (Desrosiers & Karypis, Reference Desrosiers and Karypis2011).
Most of the above-mentioned surveys provided a general overview and research challenges of commonly deployed techniques in RS. To the best of our knowledge, there has not been any extensive survey conducted on LBRSs as we have presented here. A related survey was presented in Bao et al. (Reference Bao, Zheng, Wilkie and Mokbel2015). However, the aforementioned survey was conducted on the topic of location-based social networks, whereas we have focused specifically on LBRS. In Bao et al. (Reference Bao, Zheng, Wilkie and Mokbel2015), the authors restricted their analysis to the data sources used (e.g. user profiles, history of user visited location, and history of online user activities on LBSNs), methodology employed for recommendation (e.g. content based, collaborative based, and link analysis based), and the objectives of the recommendations (e.g. users, locations, social media, and activities). In contrast, our survey presents a qualitative comparison of various techniques proposed in LBRS not only for individuals but also for group-based location recommendations. Moreover, we have additionally discussed numerous significant services offered by LBRS. Such services are categorized as (a) geo-tagged media based which are the services that allow users to add location with users media contents, such as text, videos, and photos that were created in the physical world; (b) point location-based services that allow users to add and share users locations, such as restaurants, shopping malls, or cinemas; and (c) trajectory-based services that allow users to add both destination point locations and the routes to that destination. Furthermore, we have also presented the distinguishing features of the locations which are utilized by LBRS for recommendations. The location features are categorized as (a) location hierarchy, (b) distance of locations and users, and (c) sequential ordering. We have also discussed criteria to build a users trust and confidence on a RS. The criteria includes (a) accuracy, (b) familiarity, (c) novelty, (d) diversity, (e) context compatibility, (f) justification of recommendations, and (g) sufficiency of information. The survey also presents basic similarity calculations and evaluation metrics, such as (a) cosine-based similarity (Zheng et al., Reference Zheng, Zhang, Ma, Xie and Ma2011), (b) correlation-based similarity (Cechinel et al., Reference Cechinel, Sicilia, SáNchez-Alonso and GarcíA-Barriocanal2013), and (c) adjusted cosine similarity (Ye et al., Reference Ye, Yin and Lee2010; Arora et al., Reference Arora, Kumar, Devre and Ghumare2014). In the end, a comparative study and a tabular summary of the existing schemes is presented.
The rest of the survey is organized as follows. In Section 2, an overview of the recommendation methods is given. A brief overview of services offered by LBRS and distinguishing features of LBRS is provided in Section 3. In Section 4, we have illustrated the criteria for recommendations. Basic similarity measures followed by evaluation of recommendation are discussed in Sections 5 and 6, respectively. In Section 7, a detailed study of models and techniques proposed in the literature for LBRS are discussed. Section 8 presents various challenges in developing scalable LBRS. Section 9 presents brief discussion on the opportunities in LBRS. Finally, future directions and conclusions are discussed in Sections 10 and 11, respectively.
2 Overview of the recommendation methods
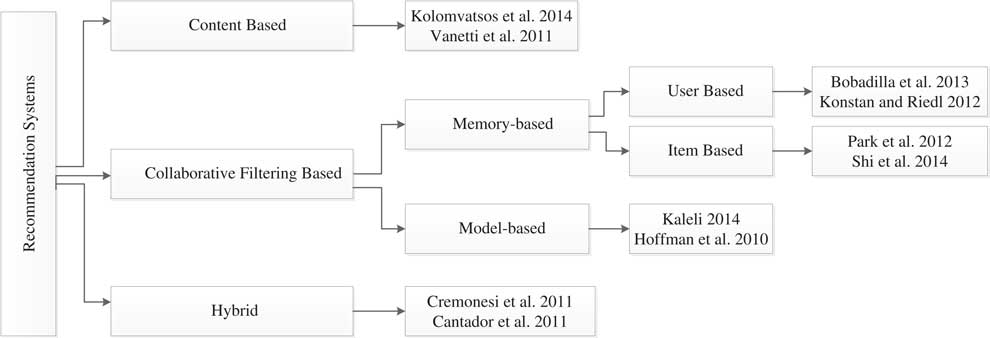
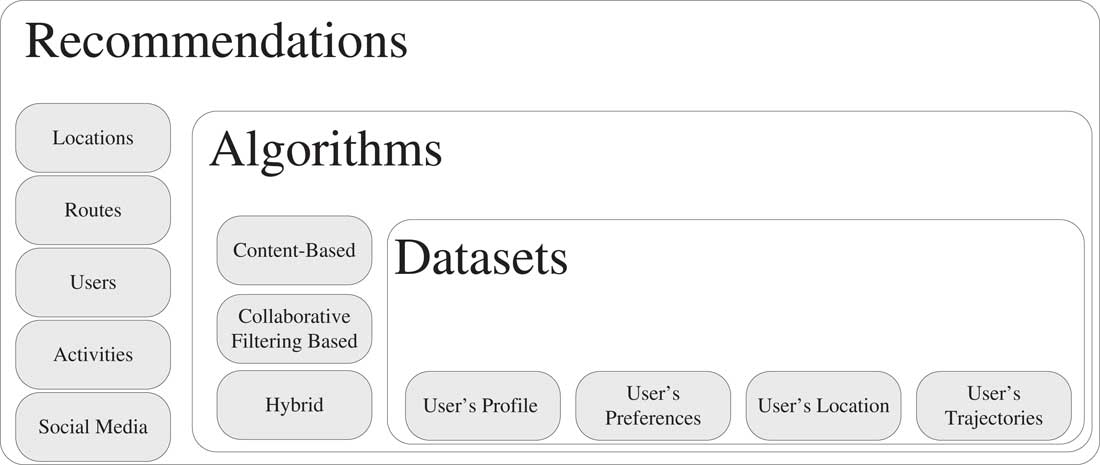
The emphasis of the research community on the problems of recommendation, such as cold start, data sparseness, and scalability emerged in the mid of 1990s and RSs began to emerge as an independent research area. RSs have a profound association with cognitive science (Bobrow, Reference Bobrow2014) and information retrieval (Lewis, Reference Lewis2014). Different methods have been used for the recommendation problem and the methods are normally categorized as content-based and CF methods. Figure 1 shows the hierarchy of the recommendation techniques, whereas Figure 2 depicts the types of recommendations, recommendation algorithms, and data sets used by RS.
Hierarchy of the recommendation techniques

Component of recommendation systems

2.1 Content-based methods
The main idea of content-based (or cognitive) methods (such as Jannach et al., Reference Jannach, Zanker, Felfernig and Friedrich2010; Vanetti et al., Reference Vanetti, Binaghi, Carminati, Carullo and Ferrari2010; Lops et al., Reference Lops, De Gemmis and Semeraro2011; Kolomvatsos et al., Reference Kolomvatsos, Anagnostopoulos and Hadjiefthymiades2014) is to recognize the common characteristics of a particular item that has already been evaluated and rated by a user. The system then finds and recommends a new item that shares the identical characteristics to the users preferences. In content-based RSs, complete information of the item is implicitly available in the form of a feature vector. For other items such as text documents (Vanetti et al., Reference Vanetti, Binaghi, Carminati, Carullo and Ferrari2010; Lops et al., Reference Lops, De Gemmis and Semeraro2011),and Web documents (Jannach et al., Reference Jannach, Zanker, Felfernig and Friedrich2010; Kolomvatsos et al., Reference Kolomvatsos, Anagnostopoulos and Hadjiefthymiades2014), the feature vector usually comprises the term frequency–inverse document frequency (TF–IDF) weights of the most revealing keywords (Lewis, Reference Lewis2014). The TF–IDF approach was also used for prediction of the ratings of a user for any new item (Vanetti et al., Reference Vanetti, Binaghi, Carminati, Carullo and Ferrari2010). Similarly for rating predictions, Bayesian approaches were also used (Jannach et al., Reference Jannach, Zanker, Felfernig and Friedrich2010; Vanetti et al., Reference Vanetti, Binaghi, Carminati, Carullo and Ferrari2010; Guo et al., Reference Guo, Zhang and Yorke-Smith2013).
Content-based RSs suffer from two main problems: (a) inadequate analysis of contents and (b) over specialization (Shi et al., Reference Shi, Larson and Hanjalic2014). Inadequate analysis of contents stems from the circumstance where the RS have limited or incomplete information about the contents of the item or about the users. There are numerous reasons behind such lack of information. For example, privacy is a major concern for many users that might restrict a user from providing sufficient personal information. Similarly, information about items such as music or images is costly or difficult to acquire. And finally, in some cases the information about the item is inadequate to evaluate the quality of the item. For instance, it is quite difficult to differentiate between a well-written article and a badly written article when both of the articles use the same terms. Alternatively, over specialization is the problem that is a side effect of the methodology in which RSs recommend new items. The rating predictions of a user is high for an item if the characteristics of the item are similar to the ones already rated high by the same user. For example, a recommendation application for a movie may recommend a movie of the same category to the user, if the user has rated movies of the same category previously. Similarly, a system may recommend a movie to the user which has the same actors to that of the previously rated movie. Because of the nature of the content-based recommendation technique, the system does not consider any other movie that is different yet might be fascinating to the user. For the aforementioned issue, solutions were proposed that introduce diversity in recommendations by adding some randomness in the recommendations (Shi et al., Reference Shi, Larson and Hanjalic2014) or filtration of too similar items (Vanetti et al., Reference Vanetti, Binaghi, Carminati, Carullo and Ferrari2010; Hurley & Zhang, Reference Hurley and Zhang2011).
2.2 Collaborative filtering method
Unlike content-based methods, in which the main idea is to recognize the common characteristics of a particular item that has already been evaluated and rated by a user, CF-based methods depend on the ratings of a user along with other users ratings in the system (Wei et al., Reference Wei, Ye, Zhang, Huang and Zhu2012; Shi et al., Reference Shi, Larson and Hanjalic2014). CF is the most commonly used technique for the recommendation problem (Ye et al., Reference Ye, Yin and Lee2010; Lü et al., Reference Lü, Medo, Yeung, Zhang, Zhang and Zhou2012; Bao et al., Reference Bao, Zheng, Wilkie and Mokbel2015; Bobadilla et al., Reference Bobadilla, Ortega, Hernando and Gutiierrez2013). Although CF-based methods are frequently used with other filtering techniques such as knowledge-based or content-based, the main objective of using CF-based RS is to locate the subset of similar users who have similar profiles and preferences. Rating by a user u 1 for an item i is expected to be the same as rated by another user u 2, if and only if u 1 and u 2 had followed a similar pattern in rating other items. Similarly, u 1 is likely to rate two items i and j in a same manner, if similar rating has been given to both items by other users. The CF-based RS function by matching a particular users items record in matrix with other stored users record. The matrix must contain users visited locations and the number of visits for each location. The CF-based methods present valuable recommendations to a given user by extracting the ratings shared by similar users on the items.
CF-based methods eliminate certain existing problems of content-based RSs. For instance, when the rating information about an item is needed, and it is not available or difficult to acquire, CF-based models can still generate recommendations to the users through the feedback and ratings of other users. Moreover, in CF-based methods, users mostly rate an item keeping in consideration the quality of the item. This is not the case in content-based methods that mostly rely on content matching, which may lead to poor quality of recommendation. The two generic classes of CF approaches are memory based and model based. In memory-based CF-based method, often referred to as neighborhood based (Shi et al., Reference Shi, Larson and Hanjalic2014) or heuristic based (Felfernig et al., Reference Felfernig, Jeran, Ninaus, Reinfrank and Reiterer2013), user-item rating matrix stored in the system is directly accessed and used for the prediction of ratings for new items. Memory-based models are further categorized as item based and user based, as reflected in Figure 2. In item-based methods (Park et al., Reference Park, Kim, Choi and Kim2012; Shi et al., Reference Shi, Larson and Hanjalic2014), the prediction of rating for a user is based on already stored ratings for the similar items of that user. The system considers two items similar if and only if most of the users rated that item in the same way. Alternatively, user-based approaches (Konstan & Riedl, Reference Konstan and Riedl2012) consider a users interest toward an item using the previously stored ratings of other users for the same item. The similarities are calculated among all the pairs of users based on the users ratings. The similarity computations, such as cosine similarity or Pearson’s correlation are used for calculating the similarity among the users (Ye et al., Reference Ye, Yin, Lee and Lee2011). The resultant correlated users are known as neighbors that are used for the rating prediction of the other users. In model-based approaches, data mining and machine learning algorithms are applied to train the probabilistic models for various patterns. Compared with memory-based approaches, model-based approaches are better in a sense that these approaches help in reducing the size of the user-item rating matrix that decreases the online processing time (Bao et al., Reference Bao, Zheng, Wilkie and Mokbel2015; Bobadilla et al., Reference Bobadilla, Ortega, Hernando and Gutiierrez2013). Also model-based methods surpass at characterization of users preferences that may include some hidden factors. For instance, without actually defining any notion such as suspense or horror, a movie RS recommends a movie that is both suspense and horror (Desrosiers & Karypis, Reference Desrosiers and Karypis2011). In such a situation, model-based approaches determine a users preferences about a movie, without the user explicitly stating the preferences (Desrosiers & Karypis, Reference Desrosiers and Karypis2011). Alternatively, memory-based methods extract associations in the users-items rating matrix. As a result, the RS may recommend a movie to a user that is totally against their taste or a movie that is not very popular, just because one of the users nearest neighbors highly rated that movie. Techniques commonly used in model-based RSs include Bayesian Clustering (Shi et al., Reference Shi, Larson and Hanjalic2014), latent semantic analysis (Evangelopoulos et al., Reference Evangelopoulos, Zhang and Prybutok2012), latent Dirichlet location (Hoffman et al., Reference Hoffman, Bach and Blei2010), maximum entropy (Kaleli, Reference Kaleli2014), and support vector machines (Desrosiers & Karypis, Reference Desrosiers and Karypis2011).
2.3 Hybrid
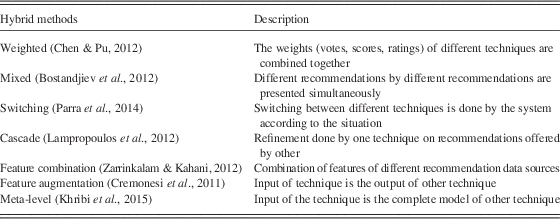
Combination of two or more techniques forms a hybrid RS. Usually, for achieving the best performance, techniques are combined in a way that the techniques with few drawbacks are chosen (Cremonesi et al., Reference Cremonesi, Garzotto, Negro, Papadopoulos and Turrin2011). CF is the most commonly used technique for combination with any other technique. Some of the combination methods used for the creation of hybrid RS is shown in Table 1.
Description of combinations used in Hybrid Technique

3 Location-based recommender systems
A social network is a network in which people of same or different cultures, age groups, locations, professions, and societies connect with each other to form different types of relations such as friendships, collaborative knowledge, and mutual interest (Marin & Wellman, Reference Marin and Wellman2011). The individuals in a social network use various social networking services that are the digital depiction of real-world social networks. The use of social networking services not only enrich such networks but also empower the growth of the network by providing the users to share events, ideas, interests, locations, and activities to strengthen the relationship with each other. The advent of sharing locations with each other in social networking services helps strengthening the association between real-world social networks and online social networking services (Zheng, Reference Zheng2012). LBRS is the system in which people share the location embedded information with each other (Symeonidis et al., Reference Symeonidis, Ntempos and Manolopoulos2014). Moreover, users in LBRS share location-tagged media contents such as text, videos, and photos (Zheng et al., Reference Zheng, Zheng, Xie and Yang2012). Furthermore, the physical location comprises the immediate location of the user with a timestamp as well as the location history of the given user for a certain period. When same location is shared by two or more users, the information also includes the complete knowledge of the users common behavior, interests, and activities extracted from the users location history and location-tagged information (Bao et al., Reference Bao, Zheng, Wilkie and Mokbel2015).
3.1 Services offered by location-based recommendation system
Existing LBRS services can be categorized as geo-tagged media based, point location based, and trajectory based.
3.1.1 Geo-tagged media based
Geo-tagged media-based services allow users to add location with users media contents such as text, videos, and photos that were created in the physical world (Majid et al., Reference Majid, Chen, Chen, Mirza, Hussain and Woodward2013). Passive tagging occurs when a user explicitly creates and adds the contents along with the location (Majid et al., Reference Majid, Chen, Chen, Mirza, Hussain and Woodward2013). Geo-tagged media-based services allow a user to view other users content in a geographical context by using digital maps on smart phones (Chon & Cha, Reference Chon and Cha2011). Popular applications that provide LBRS services include Geo TwitterFootnote 1 , FlickrFootnote 2 , and PanoramioFootnote 3 . It has been shown in Ye et al. (Reference Ye, Yin and Lee2010) that addition of only location dimensions (such as longitude, latitude) does not necessarily attract users, as users are more interested by actual media content. Therefore, the addition of location information only acts as an add-on to enrich and unify the media contents. The authors in Ye et al. (Reference Ye, Yin and Lee2010) further indicated that addition of the location feature does not have much impact on the connections and relationships among the users; rather it is the media content that is responsible for such connections and relationships between users.
3.1.2 Point location based
Point location-based services allow users to add and share users locations such as restaurants, shopping malls, or cinemas (Gao et al., Reference Gao, Tang, Hu and Liu2015). The most common applications to offer such services are Foursquare, Instagram, and Facebook that encourage users to share their existing location. Users of such applications are provided with options to perform a check-in at different locations that are visited by the users in their daily routine to share experiences and knowledge by giving a tip or feedback (Ye et al., Reference Ye, Yin and Lee2010; Sarwat et al., Reference Sarwat, Levandoski, Eldawy and Mokbel2013). For example, a user can share their views about a dinner to their community on an online social site while using their smart phone. Moreover, such services also keep track of the users geospatial check-in data (such as time and longitude/latitude) (Ye et al., Reference Ye, Yin and Lee2010). In Foursquare, after checking in at different locations, the application awarded badges and points to the user. The user that has the most number of visits at a particular location has been capped as Mayor. One of the main advantages of such services that allow real-time location tracking of users is that users can discover friends around their physical locations that help in boosting a users social activities in the physical world. For instance, after discovering a friends physical location from his/her social network, one can offer the friend to have a lunch or shopping activity. The use of tip or feedback in location-based services allows users to share comments and suggestions that can be either positive or negative. Such tips or feedbacks are pivotal in aggregating recommendations. Unlike geo-tagged media, a point location (venue) is the main component for the users that determine the connection between the users and the media content such as feedbacks, badges, and tips are associated with the point location (Zheng, Reference Zheng2012).
3.1.3 Trajectory based
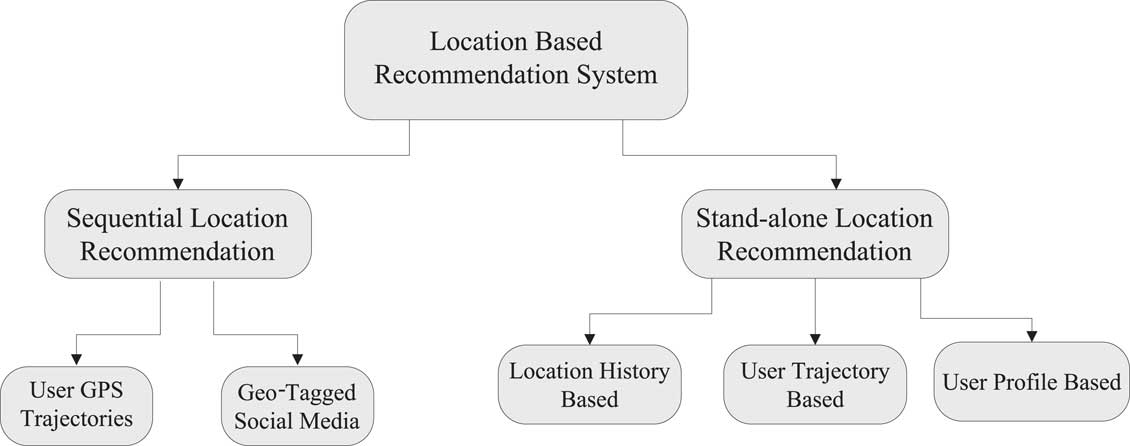
Trajectory-based services allow users to add both point locations and the routes to that point location. The most common applications that offer such services are BikelyFootnote 4 , Microsoft GeoLifeFootnote 5 , and SportsDoFootnote 6 . Trajectory-based approaches compute information by extracting data about a users visit patterns at different locations, duration of stays, and the paths selected. Such services allow users to add information such as speed, distance, duration, and route about a specific trajectory, as well as the users media contents such as tips, tags, and photos along with the given trajectory (Ye et al., Reference Ye, Yin and Lee2010; Ying et al., Reference Ying, Lu, Lee, Weng and Tseng2010). Other users of the same community can take guidance from the experiences of their friends by following the trajectory using digital maps or smart phones. In summary, such services offer both how and what along with where and when. Figure 3 shows the categorization of LBRSs.
Categories of location-based recommendation system

3.2 Distinguishing features of locations
In LBRS, the focus of the recommendations remains on the locations beside the media contents. Therefore, it is important for the RS to recognize and consider the unique features of the locations to make recommend actions to a user that meets the criteria of both accuracy and quality of recommendation. Following are the distinguishing features of the location.
3.2.1 Location hierarchy
There are multiple scales at which location can be considered. A location can be a small shop or restaurant or it can be a big town or city. Such locations, smaller or bigger form a hierarchy where locations at the bottom are refer to smaller geographical areas (Xiao et al., Reference Xiao, Zheng, Luo and Xie2014). For instance, a location (restaurant, cinema, shopping mall) may belong to a community, a community belongs to a town, and a town belongs to a country, and so on. The different levels of hierarchical formulation of locations lead to diverse user-location and location-location graphs. Bao et al. (Reference Bao, Zheng, Wilkie and Mokbel2015) suggested that even if a user has identical location histories, different user-location and location-location graphs will be formulated. The importance of the hierarchical relationships and their consideration is essential for the RS because these relationships have a very significant role in establishing the connections between the users (Wang et al., Reference Wang, Terrovitis and Mamoulis2013). For example, users who share locations such as restaurant or shopping malls that are considered as lower level items in the hierarchy possibly have strong connections than users who share locations such as towns or countries that are considered as higher level hierarchy. As a consequence, the hierarchical property in LBRS is unique and needs to be considered.
3.2.2 Distance of locations and users
The second distinguishing property of locations in LBRS is distance. To find the strength of relationship and connections between the users, distance must be considered. The shorter the distance the stronger will be the relationship. There are three geospatial distance relations defined to compute the relationship and connections among the users using distance (Wang et al., Reference Wang, Terrovitis and Mamoulis2013). The three geospatial distance relations are the distance between the users, the distance between a location and a user, and the distance between two locations. Distance in all three aforementioned cases can affect the RSs in three possible ways. In the first case, the distance between two users shows the similarity between users. For instance, users who have similar history of visiting same location have high priority to have similar preferences and interest (Xiao et al., Reference Xiao, Zheng, Luo and Xie2010; Arora et al., Reference Arora, Kumar, Devre and Ghumare2014) and the users who have similar residential area are possibly friends (DeScioli et al., Reference DeScioli, Kurzban, Koch and Liben-Nowell2011). In the second case, the distance between users and locations shows the probability of a users attraction to the specific location. For example, users frequently visit nearby places than other places that are far away from users homes (Levandoski et al., Reference Levandoski, Sarwat, Eldawy and Mokbel2012). In the last case, the distance between two locations shows the association between different locations. For instance, restaurants and shopping malls are mostly situated near to each other (Ye et al., Reference Ye, Yin, Lee and Lee2011).
3.2.3 Sequential ordering
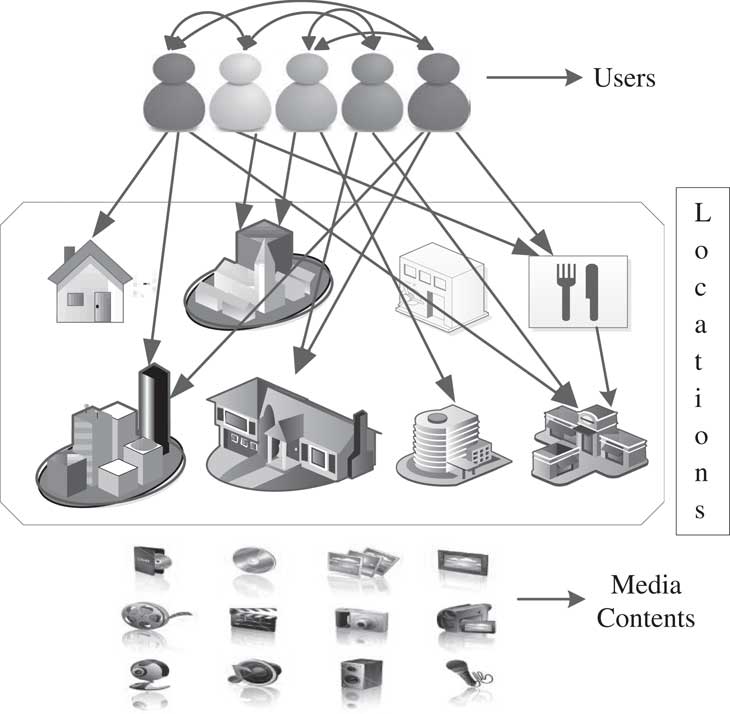
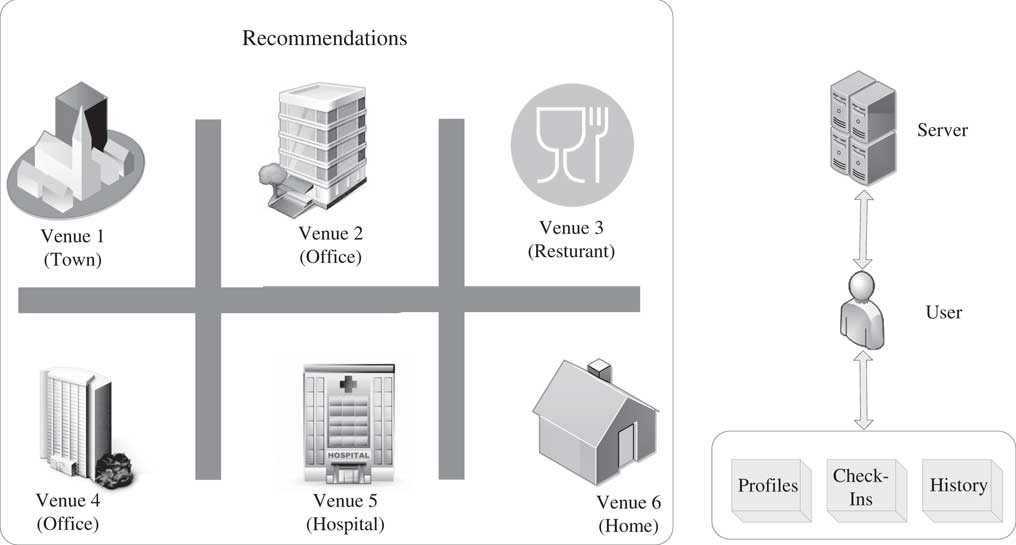
Most users visit favorite places at regular intervals. Such regular intervals create a relationship between users in a sequential order. For example, two users of the same company regularly dine at two different restaurants and meet again in the cinema, an ordering of visits can be created that may show some common preferences among them (Bao et al., Reference Bao, Zheng, Wilkie and Mokbel2015) or that may possibly show traffic conditions (Tang et al., Reference Tang, Lin, Hong, Siewiorek and Sadeh2010). Figure 4 shows the visit patterns users can have in a LBRS. A user can visit different locations and add such locations with media contents like tips, tags, and feedbacks.
Visit patterns of user in location-based recommendation system

4 Criteria for recommendations
In a RS, a users main concern is the quality of the recommendations generated for an item. Users review the resultant recommendations offered by the system and justify them as appropriate or inappropriate depending on their personalized preferences. In addition, it is important for the RS to present such recommendations in a manner that is acceptable for the users. Therefore, presentation of the recommendations must be handled carefully to influence the users to accept the recommendations (Pu et al., Reference Pu, Chen and Hu2012). For example, would the recommendations include only top ranked items or locations, and similar ones? Or would the recommendations include the popular locations or items, and also well-proportioned highly ranked one? Similarly, another key aspect of RS is trust (Shani & Gunawardana, Reference Shani and Gunawardana2011). The user has more trust on the system if the recommendations generated by the system best match the users preferences. Therefore, a users expectation is directly dependent on trust in the system (Bedi & Sharma, Reference Bedi and Sharma2012; Liu, Reference Liu2014). The RSs also affect a users confidence in the system that whether the generated recommendations are satisfying a user or not. The users are more likely to accept the recommendations if their confidence in the system is high (Avazpour et al., Reference Avazpour, Pitakrat, Grunske and Grundy2014). In the following subsections, we will discuss some of the criteria for the RS that must be considered to build trust and confidence of the users.
4.1 Accuracy
To evaluate a RS, one of the most dominant and important criteria is accuracy (Rana & Jain, Reference Rana and Jain2015). Numerous works have been carried out in the past decade to achieve the goal of enhancing the accuracy of recommendations (Pu et al., Reference Pu, Chen and Hu2011). The most common measure used by most of the researchers in the rating-based RSs is Mean Absolute Error (MAE) (Bobadilla et al., Reference Bobadilla, Ortega, Hernando and Alcalá2011). MAE measures the difference between the ratings predicted by the algorithm and the actual ratings of the users (Pu et al., Reference Pu, Chen and Hu2012). Similarly, for content-based RSs, switching task is used to measure the accuracy (Bostandjiev et al., Reference Bostandjiev, O’Donovan and Höllerer2012). Switching task measures the change (switching) of user preferences before and after the recommendation (Bostandjiev et al., Reference Bostandjiev, O’Donovan and Höllerer2012). If some user changes his/her preferences after the recommended list, the accuracy of the system will be decreased (Pu et al., Reference Pu, Chen and Hu2011). In recent years, the focus of the research is shifted toward users perceived accuracy. Users perceived accuracy measure is the degree of users satisfaction level (Cremonesi et al., Reference Cremonesi, Garzotto, Negro, Papadopoulos and Turrin2011). If the recommendations generated by the system best matches a users interest and preferences, the degree of the users perceived accuracy will be high. Perceived accuracy has more direct impact on users trust level as compared with objective algorithm accuracy (Chen & Pu, Reference Chen and Pu2012). However, it was also shown by some researchers that both perceived accuracy and objective accuracy do not have a direct correlation with each other (Pu et al., Reference Pu, Chen and Hu2011). Moreover, it was shown that users like to have other factors incorporated, such as diversity and novelty in the recommendations (Vargas & Castells, Reference Vargas and Castells2011). Studies such as Shani and Gunawardana (Reference Shani and Gunawardana2011) showed that accuracy alone is not sufficient for the selection of related algorithm. For example, user may have intent to incorporate novelty in the recommendations. Therefore, considering accuracy alone as the criteria for recommendation is not sufficient (Pu et al., Reference Pu, Chen and Hu2012). We concluded from different studies that for LBRS the user-based CF (based on KNN) has been verified to achieve high accuracy (Ye et al., Reference Ye, Yin, Lee and Lee2011).
4.2 Familiarity
Another criterion for the RSs is familiarity. The most familiar stuff is most likely to be recommended (Pu et al., Reference Pu, Chen and Hu2012). As compared with unfamiliar recommendations, users liking for familiar recommendation is high. The study conducted in Pu et al. (Reference Pu, Chen and Hu2012) showed that when the items that are highly liked by a user are included in the recommendations, the items increase the users trust in the system. The study also showed that the users are more likely to be interested in the familiar items rather than unfamiliar ones. In the study conducted in Chang et al. (Reference Chang, Wei, Yeh and Peng2011), familiar road segments were recognized and then familiar road networks were constructed using historic trajectories to generate personalized routes. While the preference of a user is always toward the familiar recommendations but the user also needs new recommendations to which the user was previously unfamiliar. For example, if LBRS recommends a similar restaurant to a user, the user might feel that the system is not capable of recommending new restaurants that might change their taste (Liu, Reference Liu2014).
4.3 Novelty
The limitation shown in the previous criteria of the RS can be handled by introducing novelty in the recommendations. Novelty is another important criterion that needs to be considered by the RSs. The main idea of introducing novelty is to provide users with unexpected recommendations. Novelty is also sometimes referred to as serendipity (Rana & Jain, Reference Rana and Jain2015). However, the difference between novelty and serendipity was elaborated in Pu et al. (Reference Pu, Chen and Hu2011), where novelty means new and serendipity means new and surprising. Therefore, it can be concluded that novelty is the extent to which recommendations are newer for a user (Liu, Reference Liu2014). In a study conducted in Adomavicius and Kwon (Reference Adomavicius and Kwon2012), the researchers discovered that users give high ratings to the music recommended by Pandora. Pandora is considered as a novel music RS because it frequently provides listeners with latest music tracks. The study also showed that the music RSs that offer new choices are most well known as users prefer to use such systems rather than the RSs that focus only on users preferences.
4.4 Diversity
Another key criterion for RSs is diversity (Pu et al., Reference Pu, Chen and Hu2012). Diversity and novelty are different notions though both are closely related. Novelty of the recommendation can be referred to as how the recommendation is different with respect to previously seen recommendations. Whereas, diversity indicates how distinctly dissimilar the recommendations are when compared with each other (Vargas & Castells, Reference Vargas and Castells2011). In item-to-item CF algorithm, a user is trapped in a similarity junction that provides the user with similar recommendations according to his/her or friends preferences (Rana & Jain, Reference Rana and Jain2015). Therefore, the focus of the researchers is shifted toward diversity in recent years. At the same time, the focus should also be on maintaining the balance between diversity and similarity (Adomavicius & Kwon, Reference Adomavicius and Kwon2012; Liu, Reference Liu2014; Javari & Jalili, Reference Javari and Jalili2015). Moreover, highly diverse recommendations also affect the similarity and accuracy criteria for the user. Therefore, the diversity of the recommendations should be provided with a balance in aforementioned tradeoffs (Adomavicius & Kwon, Reference Adomavicius and Kwon2012). The study showed that users like diverse recommendations as compared with more accurate recommendations (Vargas & Castells, Reference Vargas and Castells2011). Decision confidence of a user may be affected when the user receives low diversity recommendations (Pu et al., Reference Pu, Chen and Hu2012). It was also showed in another study that the satisfaction level of users drive beyond accuracy and that the users are more likely to accept more diverse recommendations (Javari & Jalili, Reference Javari and Jalili2015).
4.5 Context compatibility
Context compatibility is a criteria for RSs in which the current context should be considered before the final recommendation. Contextual occasions are the key to the users satisfaction. A good RS is the one that provides recommendations taking into account the users current contextual information (Pu et al., Reference Pu, Chen and Hu2012). For example, if a user wants to dine in a restaurant, the current context includes current location, food choice, who is accompanying the user, and weather conditions. Similarly, if a user wants to watch a movie, the current context should be considered because the users preferences of watching a movie with their friends may differ compared with watching a movie with their family (Verbert et al., Reference Verbert, Manouselis, Ochoa, Wolpers, Drachsler, Bosnic and Duval2012). One of the advantages of adding contextual considerations in the RSs is that it helps new users to get recommendations instantly without adding robust profiles (Pu et al., Reference Pu, Chen and Hu2012).
4.6 Justification of recommendations
For user satisfaction, it is not enough to give recommendations according to the users preferences and ratings. In addition, the user must understand the criteria of selection of items for recommendations. Studies showed that a users satisfaction and trust level is enhanced in those RSs that also provide good justifications with the recommendation list (Desrosiers & Karypis, Reference Desrosiers and Karypis2011). Some of the primary goals of including the justifications to recommendations are transparency, effectiveness, and smoothness (Desrosiers & Karypis, Reference Desrosiers and Karypis2011). After realizing the importance of justifications of recommendations, commercial websites like Netflix, Pandora, and Amazon have also added features, such as why this was recommended on the Web pages (Pu et al., Reference Pu, Chen and Hu2012).
4.7 Sufficiency of information
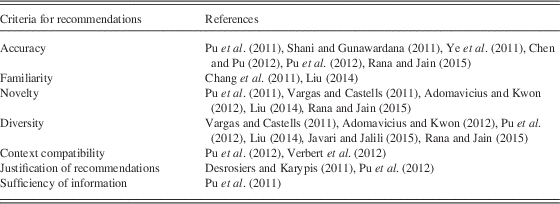
The last criteria for RSs is to provide sufficient information with the recommendation list to facilitate the user and help enhancing the decision-making process of the user. For example, when Amazon recommends a book to a user, the information needed by the user is sufficient. The title of the book, author name, edition, binding (hardcover or paperback), current ratings, and price of the book, all the necessary information, is displayed with recommended book. Studies showed that the availability of the descriptive information about the individual item positively correlated with perceived effectiveness and ease of access of the RS (Pu et al., Reference Pu, Chen and Hu2011). For example, if LBRS recommend a shopping mall to a user, then the user would like to have more detailed information about the shopping mall, such as its distance from the user, the shortest path to the shopping mall, driving routes, and the description of different shops in the shopping mall. Therefore, the RS must consider the criteria of adding sufficient information with the recommendations. Table 2 is the summary of criteria for recommendations applied in various research works.
Criteria for recommendations in different research

5 Similarity calculations in location-based recommendation system
One of the most critical steps in recommendations in LBRS is to compute the
similarity between users and locations. The process of computing similarity starts
by computing the similarity between users and locations, and then the RS selects the
most similar locations for recommendations. The basic idea in computing the
similarity between two locations l
1 and l
2 is to identify the users who have rated both the locations and then
apply similarity computation methods to find the similarity
 $S_{{l_{1} \,l_{2} }} $
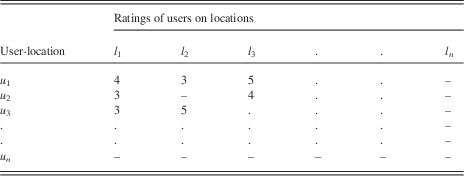
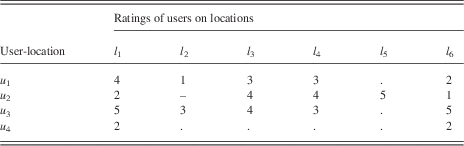
. For example, in Table 3,
user u
1 and u
2 have both rated locations l
1 and l
3. Similarly, the similarity between two users u
1 and u
2 can be calculated using the existing similarity computation techniques.
A variety of different techniques exists to compute the similarity between users and
locations (Ye et al., Reference Ye, Yin and Lee2010; Zheng et al., Reference Zheng, Zhang, Ma, Xie and Ma2011; Cechinel et al., Reference Cechinel, Sicilia, SáNchez-Alonso and GarcíA-Barriocanal2013; Arora et al., Reference Arora, Kumar, Devre and Ghumare2014). The most common among such techniques include
cosine-based similarity, correlation-based similarity, and adjusted cosine
similarity.
User-location matrix

5.1 Cosine-based similarity
In cosine-based similarity, two different locations are the two vectors in the user-location matrix. The cosine similarity between two locations is calculated by computing the cosine of the angles between the locations (Zheng et al., Reference Zheng, Zhang, Ma, Xie and Ma2011). Suppose we have m×n user-to-location matrix as shown in Table 3, then similarity between two locations l 1 and l 2 can be calculated using the following formula (Wei et al., Reference Wei, Ye, Zhang, Huang and Zhu2012):
 $${\rm sim}\left( {l_{1} ,\,l_{2} } \right)\, {\equals}\, {\rm cos}\left( {\vec {l}_{1} ,\,\vec {l}_{2} } \right)\, {\equals}\, {{\vec {l}_{1} .\vec {l}_{2} } \over {\left| {\left| {\vec {l}_{1} } \right|} \right|{\times}\left| {\left| {\vec {l}_{2} } \right|} \right|}}$$
where . represents the dot product of two vectors. Cosine-based
similarity is considered to be computationally tractable (Lyakhov et
al., Reference Lyakhov, Oganov and Valle2010). Cosine
similarity ranges between 0 and 1. One of the basic drawback of cosine
similarity is that it does not show the negative values of similarity that
happens in cases when users have rated the different set of locations. This
deficiency of cosine similarity is taken into account in the Pearson’s
correlation coefficient. If the attribute vectors
 $\vec {l}_{1} $
and
 $\vec {l}_{2} $
are normalized by subtracting the vector means, the measure is
called centered cosine similarity and is equivalent to the Pearson’s
correlation coefficient. Pearson’s correlation is discussed in the next
subsection.
5.2 Correlation-based similarity
In correlation-based approach, the similarity between two locations
l
1 and l
2 is calculated using Pearson’s r correlation
 $corr_{{l_{1} l_{2} }} $
(Cechinel et al., Reference Cechinel, Sicilia, SáNchez-Alonso and GarcíA-Barriocanal2013). The calculation of Pearson’s
r correlation starts with the isolation of different
locations that are already rated by the user u. For example, in
Table 3, the locations
l
1 and l
2, both are rated by user u
1. If we have a set of users (u
1, u
2, u
3, … , u
n
) denoted by U, then the Pearson’s
r correlation similarity is given by (Pirasteh et
al., Reference Pirasteh, Hwang and Jung2015):
 $${\rm sim}\left( {l_{1} ,\,l_{2} } \right)\, {\equals}\, {{\mathop{\sum}\limits_{u_{1} \in U} {\left( {R_{{u_{1} ,l_{1} }} \, {\minus}\, \bar{R}_{{l_{1} }} } \right)\left( {R_{{u_{1} ,l_{2} }} \, {\minus}\, \bar{R}_{{l_{2} }} } \right)} } \over {\sqrt {\mathop{\sum}\limits_{u_{1} \in U} {\left( {R_{{u_{1} ,l_{1} }} \, {\minus}\, \bar{R}_{l_{1}} _{{ }} } \right)^{2} } } \, {\minus}\, \sqrt {\mathop{\sum}\limits_{u_{1} \in U} {\left( {R_{{u_{1} ,l_{2} }} \, {\minus}\, \bar{R}_{{l_{2} }} } \right)^{2} } } }}$$
In the above equation,
 $R_{{\left( {u_{1} ,\,l_{1} } \right)}} $
represents the rating of user u
1 for location l
1 and
 $R_{{l_{1} }} $
the average rating of the lth location.
Compared with cosine similarity, Pearson’s correlation evaluates to more
accurate similarity computations as it incorporates the negative similarity
values as well. The negative similarity depicts how far the two users are in
their preferences. However, it is important to note that Pearson’s
correlation has two issues which must be taken into account while computing
similarity between users, items, or locations. The first issue occurs when one
user has rated an item or location but the other user has not rated the same
item or location. In such a case, Pearson’s correlation will only look
for common set of items rated by both users for similarity computation. As a
result, a large set of items could be ignored that are not commonly rated by
both users, though, still those items could have some impact on similarity
computations. The other issue with Pearson’s correlation is that users
with only a few commonly rated items or locations could have high similarities,
despite the smaller item count. This could induce bias in the similarity values,
and the issue can be resolved by using significance weighting (Chen et
al., Reference Chen, Zheng, Liu, Huang and Sun2013).
5.3 Adjusted cosine similarity
One of the main differences between the similarity computations of users and locations is that the similarity of users is computed along the rows of the matrix and similarity of locations are computed along the columns of the user-to-location matrix (Ye et al., Reference Ye, Yin and Lee2010; Arora et al., Reference Arora, Kumar, Devre and Ghumare2014). Basic cosine similarity has one limitation that it does not calculate the difference in rating scales of the users. In adjusted cosine similarity, the drawback of basic cosine similarity is eliminated by subtracting the corresponding users rating average from each co-rated pair of locations. The similarity between locations using adjusted cosine similarity is calculated as (Xia et al., Reference Xia, Zhang and Li2015)
 $${\rm sim}\left( {l_{1} ,\,l_{2} } \right)\, {\equals}\, {{\mathop{\sum}\limits_{u_{1} \in U} {\left( {R_{{u_{1} ,l_{1} }} \, {\minus}\, \bar{R}_{{u_{1} }} } \right)\left( {R_{{u_{1} ,l_{2} }} \, {\minus}\, \bar{R}_{{u_{1} }} } \right)} } \over {\sqrt {\mathop{\sum}\limits_{u_{1} \in U} {\left( {R_{{u_{1} ,l_{1} }} \, {\minus}\, \bar{R}_{{u_{1} }} } \right)^{2} } } \, {\minus}\, \sqrt {\mathop{\sum}\limits_{u_{1} \in U} {\left( {R_{{u_{1} ,l_{2} }} \, {\minus}\, \bar{R}_{{u_{1} }} } \right)^{2} } } }}$$
where,
 $\bar{R}_{{u_{1} }} $
is the average rating of the uth users
rating. The above-mentioned similarity calculations are a primary step to find
out similar users or locations. After computing the similarity, the RS selects
the most similar locations and generates the recommendation lists accordingly. A
variety of performance metrics are used to evaluate the resulting recommendation
lists. In the next section, we will discuss in detail the most commonly used
evaluation metrics in the field of LBRS.
6 Evaluation of recommendations using evaluation metrics
To analyze quality of recommendations, it is important to evaluate the recommendations using evaluation metrics. The use of evaluation metrics helps in the comparison of various solutions proposed by the researchers and as a result, recommendations have been improved gradually (Cacheda et al., Reference Cacheda, Carneiro, Fernandez and Formoso2011). The existing evaluation metrics have a standard formulization that is used for the testing and evaluations of the recommendations (Bobadilla et al., Reference Bobadilla, Ortega, Hernando and Gutiierrez2013). A variety of evaluation metrics (Bobadilla et al., Reference Bobadilla, Ortega, Hernando and Gutiierrez2013) are used, but the most common ones are classified as prediction metrics, set recommendation metrics, rank recommendation metrics, and diversity metrics. Prediction metrics are used to find the accuracy of recommendations using MAE (Bobadilla et al., Reference Bobadilla, Ortega, Hernando and Alcalá2011), normalized mean average error (NMAE) (Dakhel & Mahdavi, Reference Dakhel and Mahdavi2011), and root of mean square error (RMSE) (Golbandi et al., Reference Golbandi, Koren and Lempel2011). Predictions methods are also used to find the coverage. Set recommendation metrics include recall (Esparza et al., Reference Esparza, OMahony and Smyth2012), precision (Esparza et al., Reference Esparza, OMahony and Smyth2012), and receiver operating characteristics (Hsu et al., Reference Hsu, Lin and Ho2012). Rank recommendation metrics include half-life (Cacheda et al., Reference Cacheda, Carneiro, Fernandez and Formoso2011) and discounted cumulative gain (Balakrishnan & Chopra, Reference Balakrishnan and Chopra2012). Diversity metrics include novelty and diversity of the recommendations (Vargas & Castells, Reference Vargas and Castells2011). Moreover, the validation process is completed using the most commonly used cross-validation technique known as k-fold cross-validation (Bobadilla et al., Reference Bobadilla, Ortega, Hernando and Gutiierrez2013) and random sub-sampling validations (Gan & Jiang, Reference Gan and Jiang2013). The next subsection provides the elaboration of each of the evaluation metrics in detail.
6.1 Prediction metrics
To find accuracy of recommendations, researchers usually employ the calculations of the most commonly used prediction error metrics like MAE and its associated metrics, such as NMAE, mean squared error (MSE), and RMSE (Shani & Gunawardana, Reference Shani and Gunawardana2011). Suppose a set of users (u 1, u 2, u 3, … , u n ) denoted by U, a set of items (i 1, i 2, i 3, … , i n ) denoted by I, r u,i is the rating of user u on item i, α the lack of ratings (i.e. r u,i =α means user u has not rated item i), and p u,i the prediction of item I on user U. Let X u be the set of items rated by user u having prediction values, where X u,i =i ∈ I|ρ u,i ≠α∧r u,i ≠α. The systems MAE and RMSE are the average of the users MAE. The prediction error is the absolute difference between real values and the prediction, denoted as p u,i −r u,i . RME (Zuva et al., Reference Zuva, Ojo, Ngwira and Zuva2012) and RMSE (Golbandi et al., Reference Golbandi, Koren and Lempel2011) are given by the following two formulas, respectively:
 $${\rm RME}\, {\equals}\, {1 \over {\left| U \right|}}\mathop{\sum}\limits_{u\, \in\, U} {\left( {{1 \over {\left| {X_{u} } \right|}}\mathop{\sum}\limits_{i\, \in\, O_{u} } \left| {\rho _{{u,\,i}} \, {\minus}\, r_{{u,\,i}} } \right|} \right)} $$
 $${\rm RMSE}\, {\equals}\, {1 \over {\left| U \right|}}\mathop{\sum}\limits_{u\, \in\, U} {\sqrt {{1 \over {\left| {X_{u} } \right|}}\mathop{\sum}\limits_{i\, \in\, O_{u} } {\left( {\rho _{{u,\,i}} \, {\minus}\, r_{{u,\,i}} } \right)^{2} } } } $$
The metric coverage measures the percentage of situations in which there are chances of at least 1 k-neighbor of each active user that can rate the unrated item of that active user (Shani & Gunawardana, Reference Shani and Gunawardana2011). Let K u,i be the set of neighbors of a user u that has rated an item i. The coverage of the system is the average of the users total coverage. Let
 $$\eqalignno{ & C_{u} \, {\equals}\, \left\{ {i\, \in\, I\!\mid\!r_{{u,\,i}} \, {\equals}\, \alpha \wedge K_{{u,\,i}} \,\ne\,\phi } \right\} \cr & \quad {\rm and}\,D_{u} \, {\equals}\, \left\{ {i\, \in\, I\!\mid\!r_{{u,\,i}} \, {\equals}\, \alpha } \right\} $$
then the coverage can be calculated using the following equation (Shani & Gunawardana, Reference Shani and Gunawardana2011):
 $${\rm coverage}\, {\equals}\, {1 \over {\left| U \right|}}\mathop{\sum}\limits_{u\, \in\, U} {\left( {100{\times}{{\left| {C_{u} } \right|} \over {\left| {D_{u} } \right|}}} \right)} $$
6.2 Quality of the set of recommendations
A users satisfaction not only depends on accuracy, but it also depends on being provided with a concise as well as diverse set of recommendations. The combination of accuracy, diversity, and concise items list compose the quality of recommendations (Kim et al., Reference Kim, Ji, Ha and Jo2010). The most common recommendation metrics used for quality measurement are precision, recall, and F1 (Jäschke et al., Reference Jäschke, Hotho, Mitzlaff and Stumme2012). Precision is the number of relevant recommendations out of the total recommendations. Recall is the number of relevant recommendations from the number of relevant locations. F1 is the combination of recall and precision. F1 is generally used because of the advantage that it considers both the values of precision and recall and returns the value of only positive results (Jäschke et al., Reference Jäschke, Hotho, Mitzlaff and Stumme2012). Suppose r u is the set of recommendations to user u, N u the set of n recommendations to u. The relevancy threshold is θ, the evaluation recall, precision, and F1 measures for obtained recommendations by taking n test recommendations to user u, assuming all the users take n test recommendations, then precision, recall, and F1 can be calculated by (7), (8), and (9), respectively (Jäschke et al., Reference Jäschke, Hotho, Mitzlaff and Stumme2012).
 $${\rm precision}\, {\equals}\, {1 \over {\left| U \right|}}\mathop{\sum}\limits_{u\, \in\, U} {{{\left| {\left\{ {i\, \in\, N_{u} \!\mid\!r_{{u,\,i}}\, \ges \,\theta } \right\}} \right|} \over n}} $$
 $${\rm recall}\, {\equals}\, {1 \over {\left| U \right|}}\mathop{\sum}\limits_{u\, \in\, U} {{{\left| {\left\{ {i\, \in\, N_{u} \!\mid\!r_{{u,\,i}} \,\ges\, \theta } \right\}} \right|} \over {\left| {\left\{ {i\, \in\, N_{u} \!\mid\!r_{{u,\,i}} \,\ges\, \theta } \right\}} \right|{\plus}\left| {\left\{ {i\, \in\, N_{u}^{c} \!\mid\!r_{{u,\,i}} \,\ges \,\theta } \right\}} \right|}}} $$
 $$F1\, {\equals}\, {{2{\times}{\rm precision}{\times}{\rm recall}} \over {{\rm precision}{\plus}{\rm recall}}}$$
6.3 Quality of the list of recommendations
A common issue faced by users of RS is when users select only the first item from a large list of recommendations. Ignoring the rest of the list of recommendations may affect the selection of recommendations as there may be some quality recommendations down the list. To address the aforementioned issue, ranking metrics are often used by researchers. Such ranking metrics include half-life and discounted cumulative gain. In half-life (Bobadilla et al., Reference Bobadilla, Ortega, Hernando and Gutiierrez2013), when users move away from the recommendations at the top, it assumes an exponential decrease in the interest of users. Half-life assumes that the selection probability of relevant recommendation decreases exponentially down the list. Half-life is calculated using (10). In discounted cumulative gain (Baltrunas et al., Reference Baltrunas, Makcinskas and Ricci2010), it is assumed that the selection probability of relevant recommendation decreases logarithmically down the list and can be calculated using (11).
 $${\rm Half {\hbox -} life}\, {\equals}\, {1 \over {\left| U \right|}}\mathop{\sum}\limits_{u\, \in\, U} {\mathop{\sum}\limits_{i\, {\equals}\, 1}^N {{{{\rm max}\,\left( {r_{{u,\,q_{i} }} \, {\minus}\, d,\,0} \right)} \over {2^^{{i\, {\minus}\, 1} \over {\alpha \, {\minus}\, 1}}{{{}}} }}} } $$
 $${\rm Discounted\,cumulative\,gain (DCG)}^{f} \, {\equals}\, {1 \over {\left| U \right|}}\mathop{\sum}\limits_{u\, \in\, U} {\left( {r_{{u,\,q_{i} }} {\plus}\mathop{\sum}\limits_{i\, {\equals}\, 2}^f {{{r_{{u,\,q_{i} }} } \over {{{\rm log}}_{\rm 2} \left( i \right)}}} } \right)} $$
In (10) and (11), the set of recommendation list is represented by
 $q_{1} ,\,q_{2} ,\,q_{3} ,\,\ldots\,,\,q_{n} ,\,r_{{(u,\,q_{i} }} _{)} $
is the true rating of the user u for the item
q
i
, f is the rank of the evaluated item,
α is the position of the item in the list such that
there is 50% chance that the user will rate that item, and
d is the default rating.
6.4 Novelty and diversity
Novelty can be measured to an extent where recommendations are new and interesting for the users. Novelty metrics calculate the difference between the actual recommendations recommended to the user with those already known by a user that are significant. Alternatively, diversity metric calculates the internal difference of the recommendations. At present, no standard metric was defined for novelty and diversity. Therefore, different metrics are proposed by researchers (Vargas & Castells, Reference Vargas and Castells2011). Most of the authors used the following mathematical calculations to find the novelty and diversity in recommendations (Hurley & Zhang, Reference Hurley and Zhang2011).
 $${\rm diversity}_{{R_{u} }} \, {\equals}\, {1 \over {\left| {R_{u} } \right|\left( {\left| {R_{u} } \right|\, {\minus}\, 1} \right)}}\mathop{\sum}\limits_{1\, \in\, R_{u} } \ {\mathop{\sum}\limits_{j\, \in\, R_{{uj\,\ne\,1}} } {\left[ {1\, {\minus}\, {\rm sim}\,\left( {i,\,j} \right)} \right]} } $$
 $${\rm novelty}_{i} \, {\equals}\, {1 \over {\left| {R_{u} } \right|\, {\minus}\, 1}}\mathop{\sum}\limits_{j\, \in\, R_{u} } {\left[ {1\, {\minus}\, {\rm sim}\,\left( {i,\,j} \right)} \right]} ,\,i\, \in\, R_{u} $$
In (13), set of n recommendations is represented by R u , and item-item memory-based similarity measure is represented by sim(i, j).
6.5 Stability
A user has a more trust in a RS when the recommendations generated by the system best match the users preferences. A RS is known as stable when the recommendations generated do not deviate over a short period (Adomavicius & Zhang, Reference Adomavicius and Zhang2012). The metric defined for the evaluation of the stability of RS is mean absolute shift (MAS) (Verbert et al., Reference Verbert, Manouselis, Ochoa, Wolpers, Drachsler, Bosnic and Duval2012). The MAS metric consists of a set of known ratings R 1 known by the user and a set of unknown ratings Q 1. After a period of time, the user rated some of the unknown ratings and the new recommendations Q 2 are generated by the system. Now, MAS can be calculated in the following equation (Verbert et al., Reference Verbert, Manouselis, Ochoa, Wolpers, Drachsler, Bosnic and Duval2012)
 $${\rm stability}\, {\equals}\, {\rm MAS}\, {\equals}\, {1 \over {\left| {Q_{2} } \right|}}\mathop{\sum}\limits_{\left( {u,\,i} \right)\, \in\, Q_{2} } {\left| {Q_{2} \left( {u,\,1} \right)\, {\minus}\, Q_{1} (u,\,1)} \right|} $$
6.6 Reliability
When a user gets a recommendation, it is important to know whether the recommendation is valuable for the user or not. A valuable recommendation is considered reliable for the user. The most commonly used metrics to find reliability of the recommendations are Pearson’s correlation, the mean squared difference (MSD), Pearson’s correlation constrained, Spearman’s rank-order correlation, and the Jaccard plus MSD (Hernando et al., Reference Hernando, Bobadilla, Ortega and Tejedor2013). The reliability measures are proposed according to the notion that more reliable a prediction, the less liable to be wrong (Bobadilla et al., Reference Bobadilla, Ortega, Hernando and Gutiierrez2013). However, the reliability metric is just used to evaluate the RSs based on the KNN algorithm. It is based on the numeric factors S u, i as shown in (15) and V u, i as shown in (16), where S u,i the similarity of the neighbors used for giving recommendations p u, i and V u, i is the dissimilarity among the ratings of the neighbors. Now, the reliability will be calculated using (17) (Shani & Gunawardana, Reference Shani and Gunawardana2011):
 $$f_{s} \left( {S_{{u,\,i}} } \right)\, {\equals}\, 1\, {\minus}\, {{\bar{S}} \over {\bar{S}\, {\minus}\, S_{{u,\,i}} }},\,{\rm where} \ S_{{u,\,i}} \, {\equals}\, \mathop{\sum}\limits_{v\, \in\, K_{{u,\,i}} } {{\rm sim}\left( {u,\,v} \right)} $$
 $$f_{v} \left( {V_{{u,\,i}} } \right)\, {\equals}\, \left( {{{{\rm max}\, {\minus}\, {\rm min}\, {\minus}\, V_{{u,\,i}} } \over {{\rm max}\, {\minus}\, {\rm min}}}} \right){\vskip -16pt {{{{\rm ln}\,0.5} \over {{\rm ln}{{\left( {{\rm max}\, {\minus}\, {\rm min}\, {\minus}\, \bar{v}} \right)} \over {{\rm max}\, {\minus}\, {\rm min}}}}}}} }$$
 $${\rm reliability}\, {\equals}\, {{\mathop{\sum}\limits_{v\, \in\, K_{{u,\,i}} } {{\rm sim}\,\left( {u,\,v} \right)\left( {r_{{v,\,i}} \, {\minus}\, \bar{r}_{v} \, {\minus}\, \rho _{{u,\,i}} {\plus}\bar{r}_{u} } \right)} ^{2} } \over {\mathop{\sum}\limits_{v\, \in\, K_{{u,\,i}} } {{\rm sim}\,(u,\,v)} }}$$
In (15), (16), and (17),
 $\bar{s}$
and
 $\bar{v}$
are the medians of S
(u, i) and V
(u, i), respectively.
K
(u, i) is the set of neighbors of
user u that have rated the item I, and (min,
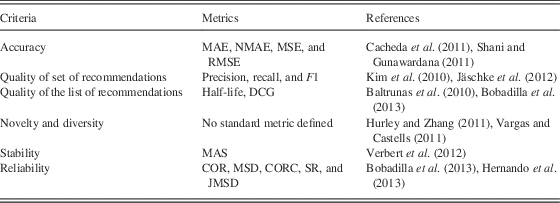
… , max) is the discrete rating values. Table 4 summarizes the evaluation metrics used in various research
works.
Summary of evaluation metrics

MAE=Mean Absolute Error; NMAE=normalized mean average error; MSE=mean squared error; RMSE=root of mean square error; DCG=discounted cumulative gain; MAS=mean absolute shift; COR=Pearson’s correlation; MSD=mean squared difference; CORC=COR constrained; SR=Spearman’s rank-order correlation; JMSD=Jaccard plus MSD.
7 Techniques used in location-based recommender systems
In recent years, numerous social networking applications for location-acquisition and wireless communications were developed for smart phones and mobile devices. The most popular among them is Facebook, Foursquare, and Instagram. In a users context, location can be considered as one of the most important entities. By using the location history of a user, one can easily extract extensive knowledge about the preferences and behavior of that particular user (Ying et al., Reference Ying, Lu, Lee, Weng and Tseng2010). Use of location contents of the users help in bridging the gap between the online social networking services and the physical world (Bao et al., Reference Bao, Zheng, Wilkie and Mokbel2015). Another advantage of using location content is the generation of new relations among users, among locations, and among users and locations. More recently, the availability of huge volumes of users geospatial data has motivated the research community to focus efforts on the design of various location-based RSs that are based on extracted information and data by mobile social networking applications (Ye et al., Reference Ye, Yin and Lee2010; Lü et al., Reference Lü, Medo, Yeung, Zhang, Zhang and Zhou2012; Bobadilla et al., Reference Bobadilla, Ortega, Hernando and Gutiierrez2013; Sarwat et al., Reference Sarwat, Levandoski, Eldawy and Mokbel2013). Such systems perform recommendations of different locations to users that are directly related to the users preferences. LBRS can be divided into two main categories: (a) generic location recommendation and b) personalized location recommendation. In generic location recommendations, public opinions are extracted and the system recommends the most popular locations according to the extracted public opinions (Cao et al., Reference Cao, Cong and Jensen2010). The limitation of such type of systems is the identical recommendations from the system due to the lack of users preferences. Alternatively, personalized location recommendations have been proposed to overcome the limitation of generic location recommendations. Such systems provide users with the most relevant locations according to the preferences given by the user (Rikitianskii et al., Reference Rikitianskii, Harvey and Crestani2014). Varieties of location recommendation approaches are available such as matrix factorization, explicit rating, implicit rating, route recommendations, location recommendations, and location-based group recommendations. In the following subsections, we will discuss in details some of the techniques used in LBRS. We have categorized this section based on the different techniques used in LBRS.
7.1 Matrix factorization techniques
In matrix factorization, we try to find out two more small matrices by
factorizing a larger matrix, such that when we multiply the smaller matrices, we
will approximately get the large matrixFootnote
7
. Matrix factorization discovers the latent features underlying the
interactions between two different kinds of entities that help in predicting
ratings in CF. Formally, let U represent a set of users and a
set L of locations. Let Z be the matrix of
size
 $\left| U \right|\left| L \right|$
that contains all the ratings of the users assigned to
locations. Also, assume that we would like to find N latent
features. Therefore, we have to find two matrices X (with
dimensions
 $\left| U \right|N$
) and Y (with dimensions
 $\left| L \right|N)$
, such that, when we multiply matrices X and
Y, the result approximates to matrix Z (as
indicated in Figure 5 and the following
equation). The equation for matrix factorization can be given as
 $$Z\,\approx\,X{\times}Y^{T} \, {\equals}\, \hat{Z}$$
Concept of matrix factorization

In this way, each row of matrix X and Y would represent the strength of the association between user and features, as well as, location and features, respectively. For a user u i , prediction of rating for a location l j can be calculated by the dot product of the two vectors corresponding to u i and l j as
 $$\hat{r}_{{ij}} \, {\equals}\, x_{i}^{T} y_{j} \, {\equals}\, \mathop{\sum}\limits_{n\, {\equals}\, 1}^n {x_{{in}} y_{{jn}} } $$
The most common recommendation approach used in various literatures is matrix factorization (Yang et al., Reference Yang, Zhang, Yu and Wang2013). Matrix factorization was first used in LBRS in Zheng et al. (Reference Zheng, Zheng, Xie and Yang2010). Using an experimental Global Positioning System (GPS) data set, interesting activities and locations are revealed for recommendations. Among different matrix factorization models, the most popular model used for recommendations in LBRS is the 0/1 scheme model (Ye et al., Reference Ye, Yin and Lee2010; Ye et al., Reference Ye, Yin, Lee and Lee2011). The value 0 is used for non-visited locations and 1 is used for visited locations. By using the 0/1 model, authors (Ye et al., Reference Ye, Yin and Lee2010; Ye et al., Reference Ye, Yin, Lee and Lee2011) studied the social and geographical influence in point-of-interest (POI) recommendation based on CF techniques. Moreover, another model was proposed by Berjani & Strufe (Reference Berjani and Strufe2011) based on the frequencies of check-ins in order to compute the preferences of users for venues. With the help of this scheme, the author developed a LBRS using matrix factorization method. Furthermore, in Cheng et al. (Reference Cheng, Yang, King and Lyu2012), the authors proposed a multi-center Gaussian model in combination with matrix factorization. The multi-center Gaussian model was used to capture the geographical influence and matrix factorization was combined with social regularization to develop a LBRS.
7.2 Explicit rating techniques
Recently, many online social services have evolved that permit users to explicitly rate the locations visited by the users. In rating-based RSs, existing ratings data are utilized to generate user preferred recommendations. Ying et al. (Reference Ying, Lu, Lee, Weng and Tseng2010) and Wei et al. (Reference Wei, Zheng and Peng2012) have presented similar models based on users existing ratings to compute personalized CF-based location recommendations. A similar approach was proposed in Lü et al. (Reference Lü, Medo, Yeung, Zhang, Zhang and Zhou2012) that applies an item-based CF-based method with all the ratings of locations in users surroundings. The aforementioned techniques may strictly capture users preferences, but are less effective in terms of scalability. Similarly, very few entries in a user rating matrix results in the data sparseness problem in the above-mentioned approaches. In addition to model/memory-based categorization, LBRS (such as Bao et al., Reference Bao, Zheng, Wilkie and Mokbel2015; Bobadilla et al., Reference Bobadilla, Ortega, Hernando and Gutiierrez2013; Oh et al., Reference Oh, Jeong and Lee2013; Sarwat et al., Reference Sarwat, Levandoski, Eldawy and Mokbel2013; Chiang & Huang, Reference Chiang and Huang2015), are also classified as being trajectory based, check-in based, and explicit rating based. The trajectory-based graphical model was proposed in Doytsher et al. (Reference Doytsher, Galon and Kanza2011) in which tracks are recorded for most frequent routes travelled by users and in return, the system recommends the best available route to a new user. Similarly, an approach to compute personalized route recommendations is proposed in Chang et al. (Reference Chang, Wei, Yeh and Peng2011). Extracting the most popular location by mining of GPS trajectories is presented in Bao et al. (Reference Bao, Zheng, Wilkie and Mokbel2015). The process of extraction is based on users travel history. All the above-mentioned techniques recommend locations based on users visited routes/trajectories, but such systems cannot properly perform the differentiation between the locations in terms of the categories that will be the main task in our proposed framework. Moreover, most of the aforementioned techniques relied on memory-based CF-based models that allow such techniques to represent a users expectations based on the users previous activities. However, such techniques are not capable of providing sufficient scalability by simultaneously processing massive amount of real-time data. Table 5 shows an example of explicit rating in which each user has rated some locations.
Example of explicit rating

7.3 Implicit rating techniques
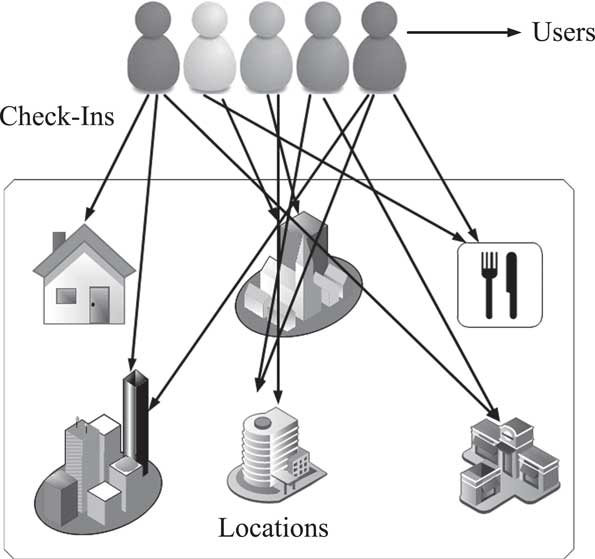
There are some techniques proposed in which the models are based on implicit ratings (Ye et al., Reference Ye, Yin and Lee2010; Ying et al., Reference Ying, Lu, Lee, Weng and Tseng2010). In implicit ratings, the numbers of check-ins performed by a user at multiple locations are recorded. In Noulas et al. (Reference Noulas, Scellato, Mascolo and Pontil2012), the authors applied a random-walk-with-restart approach on a user-location check-in matrix to compute personalized recommendations for a specific user. A similar kind of recommendation approach is proposed in Sarwat et al. (Reference Sarwat, Levandoski, Eldawy and Mokbel2013) that compute region-wise popular locations and users from check-in data. Figure 6 shows the basic concept of implicit ratings based on number of check-ins performed by the users.
Basic concept of implicit rating using check-ins

7.4 Route recommendation techniques
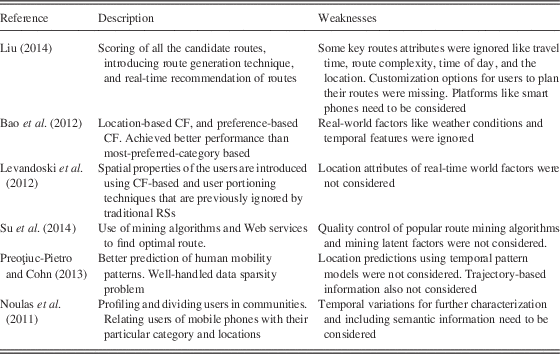
Liu (Reference Liu2014) focused on the problem of traffic jams and long queues while traveling to tourist hotspots. Tourists suffer from congestion on the road, time wastage due to the long queues or they often miss their favorite spot because of the traffic conditions. The aforementioned problem of self-driving tourists may affect their interest and satisfaction level toward their favorite locations and hot spots (Denstadli & Jacobsen, Reference Denstadli and Jacobsen2011). The main idea is to eliminate the traffic jam problem by utilizing personalization techniques and real-time traffic information. The techniques used to overcome such problem include, vehicle-to-vehicle communication system (V2VCS), fuzzy set theory, and genetic algorithms (GA). V2VCS (Cheng et al., Reference Cheng, Yao, Wen, Wang, Song and Jiao2013) is used to share the real-time traffic information among self-drive tourists. Fuzzy set theory (Ren et al., Reference Ren, Long and Juebo2011) along with Technique for Order Preference by Similarity to Ideal Solution (Lemke, Reference Lemke2014) is used to automatically score all the candidate routes instead of asking the user to rate huge number of candidate routes. Such candidate routes are scored according to the given preferences of the user and real-time value of five routes attributes (such as POI, road condition, distance, fee, and traffic). A GA (Whitley, Reference Whitley2014) is used to find the most appropriate and relevant route from the entire candidate routes according to the preferences given by the tourist. A GA is also used to explore the route scores and real-time traffic information. The assumptions made in the research are that information about personalization and real-time context can be collected by the system instantaneously. For the evaluation of the system, a Web prototype was designed for the simulation of self-drive tourists. The main contributions of the research are to introduce a novel technique to score all the candidate routes, propose a route generation technique, and designing of the personalized RS to offer the service of real-time recommendations of routes. However, the authors did not consider attributes like travel time, route complexity, time of day, and the location type. Also, flexibility in the route recommendations was not considered that allow the tourists to customize their own route preferences. And finally, V2VCS is not applicable to some countries because of the lack of infrastructure. Moreover, in many developing and under developed countries, the vehicles embedded with V2VCS sensors are of latest models and are not affordable by majority of population. Therefore, other platforms like smart phones need to be considered for the route recommendation services. Similarly, a route recommendation technique is proposed in Su et al. (Reference Su, Zheng, Huang, Jeung, Chen and Zhou2014). The authors addressed the problem that a users preferences on the selection of routes are influenced by many dynamic and latent factors that are difficult to model by using existing techniques. For solving the aforementioned problem, the CrowdPlanner (Su et al., Reference Su, Zheng, Huang, Jeung, Chen and Zhou2014) technique is used. This is a crowd-based route recommendation technique that uses a crowds knowledge. A large-scale real trajectory data set and hundreds of volunteers were involved for the experiments and evaluation of the technique. The main achievement of the work is the selection of the best route that was verified by comparing the results of the technique with the previous techniques, mining algorithms, and Web services. The authors of CrowdPlanner did not consider the quality controls of popular route mining algorithms and mining latent factors that may affect the driving route.
7.5 Locations recommendation techniques
Location recommendations on the basis of the preferences of users are also proposed in Bao et al. (Reference Bao, Zheng and Mokbel2012). In addition to users preferences, social opinions from the local experts are also considered for the final recommendations to the users. The main focus of the work is to overcome the problem of data sparsity. The user-location matrix is sparse due to the limited visits to locations. Therefore data sparsity occurs and it will become more challenging when users travel outside their native city. A weighted category hierarchy is used to model each users preference and a preference-aware candidate selection algorithm is used to select candidate local experts for taking the social opinions. A real data set collected from Foursquare was used for evaluation. The authors claim that their system is more efficient than the major LBRSs like most-preferred-category based (Bao et al., Reference Bao, Zheng, Wilkie and Mokbel2015), location-based collaborative filtering (Ye et al., Reference Ye, Yin and Lee2010), and preference-based collaborative filtering (Bellogín et al., Reference Bellogín, Castells and Cantador2013). However, the authors have not considered real-world factors such as weather conditions and temporal features to achieve the quality of recommendations. In Levandoski et al. (Reference Levandoski, Sarwat, Eldawy and Mokbel2012), the authors proposed location-aware RS. The authors have proposed a technique that used spatial properties for location recommendation that were not considered in the previous techniques. The primary recommendation technique used in the work is CF. The secondary technique used is user partitioning. It is a technique that is used to retain an adaptive pyramid structure. The data set used for the evaluation of the techniques is taken from MovieLensFootnote 8 and FoursquareFootnote 9 . For improving the proposed technique, location attributes of real-time world factors should be considered. Preoţiuc-Pietro and Cohn (Reference Preoţiuc-Pietro and Cohn2013) considered patterns of human mobility that is one of the important aspects of recommendation, especially in LBRS. More than 10 000 frequent users of LBRS were investigated for monitoring their frequent mobility patterns. The system investigates the metadata related with the location of the users, considering the type of location and their evolution over time. The clustering of users is then performed based on users movement behavior and then the system predicts the users next movements. The users of the system perform a check-in for sharing their current location with the system. GPS-enabled devices are used for performing the check-ins. Foursquare data are used for the evaluation of the system. The authors claimed that the proposed system efficiently predicts the human mobility when compared with traditional systems. The system also predicts better mobility patterns, even when provided with the limited history of the user. Besides the achievements, the authors did not consider the location predictions using temporal pattern models. Noulas et al. (Reference Noulas, Scellato, Lathia and Mascolo2011) proposed an approach for modeling human activities and geographical areas by categorizing the locations. A spectral clustering algorithm is used on users similarities and locations of two cities using a data set from Foursquare. The approach used in the work allows urban neighborhood comparison within and across cities and identification of communities based on identical visits to the same category of locations. The key achievement of the work includes profiling and dividing users into communities and relating users of mobile phones with their particular category and locations. The authors of the work did not consider temporal variations for further characterization in order to characterize users and areas at certain periods of a day. User tips and comments are also not considered for including semantic information. Figure 7 shows the overview of location recommendations.
Overview of location recommendations

7.6 Location-based group recommendations
With the continuous evolution of social networking services, the significance of recommendation models considering group preference has also increased. However, most of the existing traditional recommendation schemes do not take into account group of friends scenarios (Noulas et al., Reference Noulas, Scellato, Lathia and Mascolo2011; Preoţiuc-Pietro & Cohn, Reference Preoţiuc-Pietro and Cohn2013; Su et al., Reference Su, Zheng, Huang, Jeung, Chen and Zhou2014). In group scenarios, the RS not only models the preferences of a group member but the location of each member must also be taken into account to satisfy all the members in the group. The individuals preferences and their preferred locations are then aggregated as the recommendation for the whole group (Christensen & Schiaffino, Reference Christensen and Schiaffino2014). There has been some limited work carried out in the recent past on group recommendations, such as Masthoff (Reference Masthoff2011), Christensen and Schiaffino (Reference Christensen and Schiaffino2014), Hao et al. (Reference Hao, Li, Min, Kim, Yau and Yang2015). Most of the existing techniques proposed in the literature do not specifically focus on the effects of real-time physical factors, such as distance from location, traffic, and weather conditions on group recommendations. To achieve the objective of group recommendation, the following factors must be taken into account: (a) users preferences, (b) current context (such as time and location), (c) past check-ins, (d) geospatial characteristics, and (e) collaborative social opinion. However, the complexity and cost of processing the large-scale data sets negatively affect the performance and efficiency of RS. In the context of LBRS, there has been limited work performed on group-based location recommendations. In Hao et al. (Reference Hao, Li, Min, Kim, Yau and Yang2015), the authors proposed a location-sensitive recommendations. The recommendations are used in ad hoc social network environments. The paper proposed an approach known as spatial social union which computes recommendations not only for a single user but also for group of users. The approach computes the similarity between two users and generates multiple matrices derived from user-user, user-item, and user-location graphs. The online data set of MovieLens is used for evaluation. In Zhang et al. (Reference Zhang, Wang and Feng2013), the authors proposed personalized event-based group recommendations. The main contribution of the work is group recommendations to the users living in the same city. The localization property of users and groups was extracted and further integration of latent factor model with explicit features of location was done in order to provide group recommendations. The data set used is Meetup, which is an online social media site. Table 6 summarizes the description and weaknesses of the selected techniques and Table 7 provides a summary of some of the selected techniques.
Strength and weaknesses of the selected techniques

CF=collaborative filtering; RS=recommendation system.
Summary of some of the selected techniques in location-based recommendation system

V2VCS=vehicle-to-vehicle communication system; GPS=Global Positioning System.
8 Challenges in location-based recommendation system
Some of the unsolved problems of the previous research works discussed above are still affecting the performance of current LBRS. These problems include.
8.1 Data sparseness
Users visiting limited numbers of locations results in sparse user-to-location check-in matrix. The negative effect of data sparseness is the non-optimal computations of the nearest neighbor set of similar users with the particular user that also affect the accuracy of recommendations. Moreover, performances of the existing LBRS are also affected by the sparseness of user-to-user relationship matrix when directly manipulated with CF-based models (Lü et al., Reference Lü, Medo, Yeung, Zhang, Zhang and Zhou2012).
8.2 Cold start
Cold start is the problem when the system generates recommendation for a user who is new to the system. Such problem occurs in many existing CF-based RSs (Doytsher et al., Reference Doytsher, Galon and Kanza2011; Lü et al., Reference Lü, Medo, Yeung, Zhang, Zhang and Zhou2012). When the system does not have enough records available from the new user, it is almost impossible to compute similarity measures. Inadequate entries causes 0 values of similarity calculations that poorly affect the performance and quality of recommendations.
8.3 Scalability
In memory-based CF RSs, user rating data are utilized to apply simple methods to perform similarity computations between items or users (Chang et al., Reference Chang, Wei, Yeh and Peng2011; Doytsher et al., Reference Doytsher, Galon and Kanza2011; Noulas et al., Reference Noulas, Scellato, Mascolo and Pontil2012). Neighborhood-based CF (e.g. KNN) is one of such kinds of memory-based CF approaches. However, scalability is the main issue in such systems as a major requirement is the real-time parsing of massive volumes of data that result in poor efficiency and performance. As a result, such systems are not able to handle big data. To overcome the scalability problems, model-based CF is applied in some of the existing techniques (Ye et al., Reference Ye, Yin and Lee2010; Ying et al., Reference Ying, Lu, Lee, Weng and Tseng2010; Khalid et al., Reference Khalid, Khan, Khan and Zomaya2014). Compared with memory-based approaches, model-based approaches are better in the sense that such approaches help in reducing the size of the user-item rating matrix that decreases the online processing time (Bao et al. Reference Bao, Zheng, Wilkie and Mokbel2015; Bobadilla et al., Reference Bobadilla, Ortega, Hernando and Gutiierrez2013). However, a tradeoff between recommendation quality and reduced data set is still a hurdle. Quality of recommendations may be affected if the data set is significantly reduced to improve efficiency of online real-time processing.
8.4 Over specialization problem
Over specialization problem occurs when RS restrict users to get only those recommendations that match a users preferences or that are already rated by the user (Sharma & Gera, Reference Sharma and Gera2013). The problem prevents users to discover new items or locations. However, many RSs also focus on diversity as an important feature of the recommendations. Diversity indicates how distinct the recommendations are when compared with each other (Vargas & Castells, Reference Vargas and Castells2011). At the same time, the focus should also be on maintaining the balance between diversity and similarity (Adomavicius & Kwon, Reference Adomavicius and Kwon2012; Liu, Reference Liu2014; Javari & Jalili, Reference Javari and Jalili2015). Therefore, a tradeoff between diversity and matching user preferences is still a challenging problem for the RS.
8.5 Recommendation of popular objects
In some cases the focus of the RS is to recommend only those items that are popular among others and are likely to be highly rated by the users. In this case, the items or locations that are less popular may be overlooked (Yin et al., Reference Yin, Cui, Li, Yao and Chen2012). Popular items or locations are easy to discover by users, as compared with unpopular items. Therefore, a recommendation list must also include the less popular items or locations that are unlikely to be discovered by the users.
8.6 Attacks on recommendations
One of main challenges faced by RS is security issues. RS are widely used in e-commerce applications and are likely to be targeted by malicious attacks. The attackers may try to hinder or promote some locations or items unjustly (Gong, Reference Gong2013). Therefore, keeping in view the threat of attacks, a good RS should be equipped with wide scale of tools in order to prevent different kind of attacks. In Burke et al. (Reference Burke, OMahony and Hurley2011), the authors exposed eight different strategies of attackers which must be considered by the RS in their prevention tools.
8.7 Selection of evaluation metrics
There are many distinct evaluations metric as discussed in Section 6. It is very important to carefully select an evaluation metric (see Section 6) as each of the evaluation metric has some tradeoffs. Therefore, RS must select the appropriate evaluation metric so that the performance should remain consistent on real deployment of RS.
9 Opportunities in location-based recommendation system
The LBRS have vast applications in the areas, such as healthcare, transportation, tourism, and education. In the following subsections, we briefly discuss some of the opportunities in adopting the services of LBRS.
9.1 Healthcare
Healthcare is one of the main areas where LBRS can significantly enhance the efficiency, reliability, and effectiveness of the system (Hoens et al., Reference Hoens, Blanton, Steele and Chawla2013; Middleton et al., Reference Middleton, Bloomrosen, Dente, Hashmat, Koppel, Overhage, Payne, Rosenbloom, Weaver and Zhang2013; Wiesner & Pfeifer, Reference Wiesner and Pfeifer2014). People from various domains often require multiple healthcare services, such as disease specific specialist, hospitals, and health insurance plans (Abbas et al., Reference Abbas, Bilal, Zhang and Khan2015) that closely match a users preferences. LBRS can play an important role in the healthcare industry in order to connect and provide localized recommendations for patients, healthcare providers, and insurance companies.
9.2 Transportation
Another interesting area for the adoption of LBRS is transportation. LBRS can be helpful in route recommendations, for example, for individuals driving their personal vehicles, cab drivers, and public transporters (Liu et al., Reference Liu, Xu, Liao and Chen2014; Su et al., Reference Su, Zheng, Huang, Jeung, Chen and Zhou2014). Heavy traffic in peak hours is one of the significant problems all over the world. In such situations, people can use the services of LBRS for different routes to their destinations. Similarly, carpooling is also among one of the services provided by LBRSFootnote 10 (Zhang et al., Reference Zhang, He, Liu, Lin and Stankovic2014). Effective LBRS adoption in transportation can significantly reduce the cost of fuel and enhance the reliability of users in the services provided by LBRS.
9.3 Tourism
An important area where LBRS are actively deployed is the tourism industry where people want to plan in advance their preferred locations to visit. Sometimes it is difficult to choose the appropriate place when you have to make a decision from multiple available choices. LBRS has been used to provide the effectiveness in tourism by recommending the appropriate trip plans, as well as the other well known nearby POIs like hotels, restaurants, shopping malls (Chen et al., Reference Chen, Zheng, Liu, Huang and Sun2013; Le & Pishva, Reference Le and Pishva2016). The adoption of LBRS in tourism can significantly save the time of tourists to reach their destination in a suitable time.
9.4 Education
Another key area where the services of LBRS can significantly play an important role is education. Students need better institutions such as colleges and universities for their higher education. LBRS can be used to discover the best institutes according to the preferences of the studentFootnote 11 , Footnote 12 .
10 Future directions
To improve the efficiency of recommendations offered by LBRS, some important factors need to be considered. Such factors include:
-
a. When the system is offering routes along with locations, then the key location and routes attributes like location type, distance of the location, travel time, route complexity, time of day, and real-time world factors with temporal features need to be considered.
-
b. For better results and customization point of view, users customization to plan their visits using platforms like smart phones need to be considered.
-
c. Most of the existing LBRS use only a single type of data source for recommendations. Using diverse data sources will enable the LBRS to provide effective recommendations. Diverse data sources may include distance from location, traffic conditions, weather conditions, multiple routes to location, and time of the day (morning, evening, or night).
-
d. For achieving the best efficiency of recommendations, hybrid techniques need to be considered that will overcome the limitations of the existing techniques.
-
e. Real-time factors and group features are also ignored in most of the existing literature. The main motivation behind consideration of real-world parameters is to include the current context of each of the group member in the location recommendation process. By doing so, the selected location will be based on mutual consensus of group members, and will be the one that satisfies all the members in a group. It is noteworthy to mention that providing real-time recommendations is highly compute-intensive task as the workload consists of huge volumes of users data accumulated in the system over time.
11 Conclusions
In this article, we presented a systematic review of the scientific literature and summarized the efforts and contributions of researchers in the area of LBRS. First, we discussed the basic filtration techniques like content based and CF based and also the hierarchy of the said techniques used in RSs. Second, the basic overview of LBRS is presented followed by the services offered by LBRS and the distinguishing features of locations that are of major importance in offering the recommendations in LBRS. Third, the classification of criteria for recommendations that include accuracy, familiarity, novelty, diversity, content compatibility, justification of recommendations, and sufficiency of information is discussed in detail. The evaluation metrics used in LBRS are also presented in detail. Finally, we have critically investigated the techniques proposed for LBRS. We summarize the following observations: (1) the quality of recommendations in LBRS can be improved by using all kind of additional information such as check-in data, geographical information, social relationships, and temporal information. (2) Model-based approaches are more effective and efficient than memory-based approaches, and the performance of model-based approaches are also consistent. (3) Quality recommendations in LBRS can only be achieved by using user-based location recommendation approaches rather than item-based approaches. (4) Among criteria for recommendations, we have noticed the following observations: a) accuracy alone is not sufficient for the selection of related algorithm; b) the users are more likely interested in the familiar items rather than unfamiliar ones; c) users like diverse recommendations as compared with more accurate recommendations. For improving the performance of LBRS, rich additional information should be used, like check-ins, social relationships, temporal, and geographical information. An integrated framework is needed to enhance the performance of LBRS by integrating all this additional information. Finally, the number of users, locations, routes, POIs, real-world factors, media contents with locations, and all this rapidly growing amount of data make the worst scalability problem for LBRS. Therefore, parallel computing methods like MapReduce need to be considered.
Acknowledgment
The authors would like to acknowledge Dr. Osman Khalid and Dr. Sajjad Ahmad Madani for providing their valuable suggestions, feedback, and precious time.