

INTRODUCTION
In the Supreme Court Case Abrams v. United States, Justice Oliver Wendell Holmes wrote in dissent, “[T]hat the best test of truth is the power of the thought to get itself accepted in the competition of the market, and that truth is the only ground upon which their wishes safely can be carried out. That at any rate is the theory of our Constitution” (Holmes Reference Holmes1919). This belief in the power of the market to dictate which ideas should enter into mainstream American discourse is fundamental to the functioning of democracy. Without the ability to tolerate those ideas, which are initially disagreeable, the concept of democracy that Americans subscribe to would be lost. Indeed, some scholars have maintained that a central component of liberal democracy is the ability of any group to have a legitimate opportunity to compete for political power no matter how controversial their position or behavior (Gibson Reference Gibson2008). In fact, political tolerance provides the glue that holds democracy together when it compels citizens to live peacefully with one another despite the vastly different opinions they may possess on scores of key issues.
One of the most studied causes of political intolerance in the social sciences is religiosity, measured in a number of distinct ways. When attempting to measure such a complex phenomenon such as religion, it is necessary to think critically about conceptualization and measurement. Kellstedt et al. (Reference Kellstedt, Green, Guth and Smidt1996) offer up the best typology of measuring religious commitment — the three B's: behavior, belief, and belonging. The literature in the field of political tolerance provides a case study into the three B classification. Some of the literature proposes that religious activity leads to higher levels of intolerance, some scholars posit that religious belief causes the observed effect, while even other social scientists believe that specific types of religious denominations (specifically evangelical Protestants) generate less tolerant groups. Unfortunately, the current state of the literature has not been clear about which of these theories is the primary cause of the observed effect. Luckily, the advent of new statistical techniques allow for reassessment of previous claims, which will be the aim of this study. The recent emergence of matching in order to create pseudo-experiments is well suited to the task of understanding the causes of political intolerance.
LITERATURE REVIEW/THEORY
Samuel Stouffer offered up the first systematic, quantitative analysis of the impact of religion on the area of political tolerance. He found that different religious groups expressed varying levels of tolerance. His sample was subdivided into four categories: northern Protestant, southern Protestant, Catholic, and Jewish. He concluded that southern Protestants (somewhat of a proxy for evangelical) displayed the lowest level of political tolerance followed by northern Protestants and Catholics with Jewish respondents evidencing the highest level of tolerance. A lesser known finding of Stouffer's however was that the frequency of religious attendance also showed a discernible difference. Stouffer notes that those who attend church services regularly are less tolerant than those who do not attend at all (Stouffer Reference Stouffer1955, 142). Some follow-up research concluded that the claims made by Stouffer were valid using a different sample as well as a different time period (Nunn, Crockett, and Williams Reference Nunn, Crockett and Williams1978).
What has followed from Stouffer has been a range of different theoretical and methodological approaches to the question. Some have expressed support for the behavior theory by using church attendance as a predictor of political intolerance. Beatty and Walker (Reference Beatty and Walter1984) provide a thorough analysis of the attendance question by not only breaking attenders down into several groups but also by subdividing these attenders based on their religious tradition. A consistent finding in this research is that no matter which denomination, increased church attendance leads to increased levels of intolerance (Beatty and Walter Reference Beatty and Walter1984, 325). In addition, Sullivan, Piereson, and Marcus (Reference Sullivan, Piereson and Marcus1982) concluded that what religious tradition a person belonged to was of little importance in comparison to how often they attended religious services. One possible justification for a linkage between church attendance is the exposure to political messages from the pulpit. Beatty and Walker write, “Intolerance also might be transmitted from the pulpit by ministers who lash out against groups in violation of a denomination's belief” (Beatty and Walter Reference Beatty and Walter1984, 328). This claim is supported by additional survey research that indicates nearly two-thirds of a sample of mainline clergy indicate they have discussed abortion or sex outside of marriage from the pulpit (Djupe and Gilbert Reference Djupe and Gilbert2002). These findings justify testing the hypothesis that increased church attendance will lead to an increase in political intolerance.
For the second of the three B's several different articles have contended that belief, specifically in a literal Bible, may be the cause of many of the intolerant findings in the literature. A significant early piece of scholarship pointed out the theoretical reasons for this causality when Wilcox and Jelen write, “If ultimate truth is known, it is difficult to see why those who hold erroneous views should have those views respected” (Wilcox and Jelen Reference Wilcox and Jelen1990, 28). This theoretical argument has also been made in trying to understand why those who live in the South show higher levels of intolerance than those in rest of the country, contending that it is more a function of their fundamentalist beliefs (i.e., literalism) than any geographic reason (Ellison and Sherkat Reference Ellison and Sherkat1993). The finding that biblical literalism leads to more intolerance is echoed in subsequent research as well: “Biblical literalism encourages the rejection of, and tolerance for, un-Biblical ideas or lifestyle” (Reimer and Park Reference Reimer and Park2001, 736). This strong association between literalism and intolerance has also been confirmed by Tuntiya (Reference Tuntiya2005). Interestingly, Tuntiya finds that the relationship between evangelical Christians and literalism is not as strong as assumed. Tuntiya finds that only a slim majority of individuals who believe in a literal Bible would be classified as fundamentalist Protestants, leaving open the possibility that literalism is instead a cross-cutting cleavage and not merely a proxy for evangelical or fundamentalist Christians (Tuntiya Reference Tuntiya2005, 167). Even more recent research by James Gibson finds that measurement of belief has a strong effect on political intolerance. The author concludes that while a general measure of religious traditionalism seems to be connected to more intolerant attitudes, one specific belief seems to be the primary cause: those who believe that most of the problems of this world are the result of people moving away from God (Gibson Reference Gibson2010). These findings necessitate a need for a second hypothesis test: biblical literalism will lead to an increase in political intolerance.
Another potential linkage between religion and intolerance is focused on the religious tradition of the respondent. Social identity theorists argue that individuals define themselves by their connection with various groups in society. This connection allows individuals to create a clear barrier in their minds between groups they associate with and those groups which they oppose (Hinkle and Brown Reference Hinkle and Brown1990). Those with a stronger sense of “in-group vs. out-group” have been found to have higher levels of intolerance in quantitative analysis (Gibson and Gouws Reference Gibson and Gouws2000). The use of religious belonging as a measurement of social identity has been widely used in the literature. As mentioned previously, Stouffer's work contained a measure based on belonging, which was carried over in work done by some of those who followed in his footsteps (Nunn, Crockett, and Williams Reference Nunn, Crockett and Williams1978; Smidt and Penning Reference Smidt and Penning1982; Beatty and Walter Reference Beatty and Walter1984). While there has been several distinct evolutions in the way that religious belonging is classified, its usage has carried through even in very recent scholarship. Both work by Eisenstein (Reference Eisenstein2006; Reference Eisenstein2008) as well as Froese, Bader, and Smith (Reference Froese, Bader and Smith2008) include measures in multivariate analysis that control for type of religious belonging. Their conclusions hold to the previous understanding put forth by Stouffer, evangelical Protestants express the least amount of tolerance while Jewish respondents are typically the most tolerant. These findings help to justify the third theory being tested in this work: evangelical affiliation will lead to increased levels of political intolerance.
Eisenstein's work provides a good example of recent efforts by scholars to try and reconcile the various theoretical strains that exist in the literature. Using data collected specifically for her task Eisenstein uses structural equation modeling to attempt to break apart some of the causal chains that exist in this subfield. Eisenstein's conclusions cast serious doubt on the previously held understanding in this literature. Instead of finding a clear causality, the author concludes that the typical variables that have been employed previously (attendance, literalism) only impact political tolerance indirectly. Essentially, she concludes that the relationship is not as clear as researchers would like it to be. This work continues on in a very similar manner as Eisenstein's. While structural equation modeling is a methodologically rigorous approach to answering this question, another statistical technique-matching is also well suited to understand these questions. Matching provides an opportunity for researchers to isolate variables from one another in a way that is not afforded through any other technique.
To briefly summarize the findings concerning religion and tolerance while returning to the three B classification it would appear that the literature is consistent in its findings on belonging — those who belong to evangelical churches express higher levels of intolerance. Religious behavior also exhibits a strong predictive power on intolerance with those who attend services frequently expressing less tolerant attitudes. Finally, the belief measure (as exhibited through a respondent's view of the Bible) also exhibits greater levels of intolerance. Succinctly, all three principle components of religion negatively impact tolerance, but does this tell the entire story? What follows is a critical reassessment of the statistical findings using a new and valuable analytical technique that will shed some much needed light on the findings in this field.
METHOD/DATA
Matching has been discussed by statisticians for over three decades but has only recently found its way into the mainstream of political science. The origins of this technique are in the field of biometrics and psychology when researchers wanted to understand the magnitude of some effect without having to construct an experimental treatment group (Rubin Reference Rubin1973; Reference Rubin1974). The real advantage of matching for those in the social sciences is the ability to create a pseudo-experiment when that would be impossible in real world conditions. In the case of this research, the question being considered is not completely testable in an experimental design as this would require creating a series of different experiments and then instructing the treatment group (for example) to believe in a literal Bible, a task that is both logistically and theoretically untenable. Instead matching allows for researchers to use already collected data to setup comparison groups and control for one variable of interest.
The process of matching begins with the identification of a causal variable of interest. For example, this research tests the effect of evangelical affiliation on political tolerance. After a data set has been secured a matching exercise is conducted in which the researcher chooses a number of covariates that will allow for the matching program to create a propensity score. The matching program then uses the independent variable (in this case evangelicalism) and the covariates chosen by the researcher to generate two subsets of data, with all those who have an evangelical affiliation in one set (the treatment group), with all remaining respondents in a control group. The covariates allow for the matching program to assign a propensity score, ranging fromzero to one for each respondent in both groups, the score is estimated using logistic regression (Rosenbaum and Rubin Reference Rosenbaum and Rubin1983; Reference Rosenbaum and Rubin1985). This propensity score is an approximation of how likely each respondent is to be an evangelical based on the covariates selected.
With these two subsets created, along with a propensity score for all respondents, a match can be conducted between those in the treatment group and those in the control group. The most direct way of conducting a match is direct matching, whereby an individual in the treatment group and a respondent in the control group who have the exact propensity score are paired together (Ho et al. Reference Ho, Imai, King and Stuart2007). One variation of this technique is nearest neighbor matching, whereby a respondent in the treatment group is then matched with a respondent in the control group whose propensity score is closest without having to be exactly the same (Dehejia and Wahba Reference Dehejia and Wahba2002). A researcher can specify a caliper however to limit the range of this type of match (Ho et al. Reference Ho, Imai, King and Stuart2007).
Matching has several key advantages over standard regression techniques. First, regression is unable to fully adjust for large differences between treatment and control groups (Dehejia and Wahba Reference Dehejia and Wahba2002; Gelman and Hill Reference Gelman and Hill2007). Additionally, matching offers a level of separation between model selection and results that is not available in regression. In a regression analysis, it is not possible to verify whether a model is correct before results are displayed. In matching, however, there is an assurance that a model is correctly specified before any sort of results analysis is actually conducted, providing a higher level of scientific rigor. This is accomplished by the two stage analysis that is necessary to conduct a matching exercise — first the matching procedure must take place followed by another form of statistical analysis (in this case regression). This two stage approach allows a research to have assurance that a model has been properly specified without seeing the results of a regression analysis (Rosenbaum Reference Rosenbaum2009). Finally, and most importantly for this analysis, matching and regression vary in outcomes when researchers begin to include many covariates. Typically, in a regression analysis after several control variables are employed, the magnitude of coefficients becomes dramatically diminished, this however is not the case in matching analysis. With a large enough sample size a researcher is able to include many more covariates in a matching procedure and the outcome is a treatment and control group that is even more rigorously compared (Kam and Palmer Reference Kam and Palmer2008).
There are some important caveats to matching however that need to be considered before an analysis is to be conducted. First, a large enough data set must be available to undertake a matching routine. This is compounded by the use of a matched variable that represents a smaller subset of the population, which eliminates a large number of respondents. Second, while there have been attempts to use continuous variables in a matching routine (Diamond and Sekhon Reference Diamond and Sekhon2006), matching is traditionally conducted using a dichotomous variable (Kam and Palmer Reference Kam and Palmer2008; Rosenbaum Reference Rosenbaum2009). The use of this dichotomous variable, while sometimes is clear (evangelical vs. non evangelical), can be more difficult when creating an artificial cut point in a continuous variable (using weekly church attendance). Efforts can be made to mitigate this by running matching routines using different cut points (i.e., combining those who attend several times a month with weekly attenders), to identify different results. Finally, matching is not a panacea for the problem of the unobservables. While matching can use a larger number of covariates to create a propensity score, one cannot match on a question that was not asked.
The data chosen for this analysis will be two waves of the General Social Survey (GSS) that were conducted in 2004 and 2006.Footnote 1 The reasons for using the GSS are many. For the topic of tolerance, there is no better long established survey than the GSS as it has employed the Stouffer battery of tolerance questions (with a few exceptions) since its inception in 1972. This battery has been used by a wide variety of researcher in the area of tolerance and that tradition will continue for this project (Wilcox and Jelen Reference Wilcox and Jelen1990; Gibson Reference Gibson1992; Reimer and Park Reference Reimer and Park2001; Mondak and Sanders Reference Mondak and Sanders2003; Froese, Bader, and Smith Reference Froese, Bader and Smith2008).Footnote 2
MEASURES
The dependent variable to measure the concept of tolerance is a scale generated from responses to the Stouffer battery utilized as part of the GSS.Footnote 3 The Stouffer measure offers a respondent three different scenarios whereby they could express intolerant opinions about potential fringe political or religious groups. The scenarios concern allowing an individual to make a speech, teach at a local school, or have a book placed in the local library. While the potentially controversial groups have changed over time, the 2004 and 2006 surveys use the same subjects — atheists, racists, communists, militarists, and homosexuals. The responses from these 15 questions were summed and then transformed into a scale that ranged from 0 (completely intolerant) to 1 (completely tolerant). The Cronbach's Alpha of this scale was 0.90 with a total sample size of 2559. The mean for the scale was 0.695 with a standard deviation of 0.295 indicating that sample was more tolerant than intolerant but all 15 points along the scale have at least 55 respondents.Footnote 4 This scale is consistent with other researchers who have used the GSS (Bobo and Licari Reference Bobo and Licari1989; Ellison and Sherkat Reference Ellison and Sherkat1993; Froese, Bader, and Smith Reference Froese, Bader and Smith2008).
Church attendance was used as a means to test the religious behavior hypothesis. The GSS asks respondents how often they attend religious services and are given nine possible responses ranging from never to more than once a week. The use of religious attendance as a proxy for activity is nothing new in the literature (Beatty and Walter Reference Beatty and Walter1984; Froese, Bader, and Smith Reference Froese, Bader and Smith2008). Because of the nature of matching a dichotomous variable was constructed where those who indicated that they attended religious services once a week or more than once a week were coded as 1 (a total of 1918 respondents), while all other respondents were coded as 0 (5404 respondents).
Religious belief is measured by the use of a single question, indicating how a respondent feels about the Bible. The GSS offers four possible responses to the question that summarized are: the Bible should be taken literally, the Bible is inspired but should not be taken literally, the Bible is a book of fables, and an “other” response (for full question wording see the online Appendix). For this analysis, those who indicated that the Bible should be taken literally were coded as 1 (1460 subjects) while all other respondents were coded as 0 (5862 subjects). The concept of literalists being unique from other responses has been well established in the literature with other research indicating that literalism signals a different theological outlook than those who hold a less strict view (Wilcox and Jelen Reference Wilcox and Jelen1990; Reimer and Park Reference Reimer and Park2001; Eisenstein Reference Eisenstein2006; Reference Eisenstein2008; Froese, Bader, and Smith Reference Froese, Bader and Smith2008).
The final independent variable that was created was focused on identifying evangelicals in the larger sample. Any time a researcher attempts to classify religious individuals, the task is fraught with peril and entire books could be written just on the way to separate protestant Christians (for a succinct overview of the various means of classification see (Hackett and Lindsay Reference Hackett and Lindsay2008). Classification schemes will be overlooked including Tom Smith's FUND classification (Smith Reference Smith1990), as well as George Barna's typology (Barna Reference Barna1994) in favor of the most recent contribution to the field dubbed the RELTRAD scheme (Steensland et al. Reference Steensland, Park, Regnerus and Robinson2000). RELTRAD has improved significantly upon previous attempts to delineate religious individuals by not only focusing on the religious beliefs of each group but also the historical tradition associated with each denomination. Extensive scholarship has used the RELTRAD classification to great effect and this research will provide another test of the validity of the typology (Eisenstein Reference Eisenstein2006; Reference Eisenstein2008; Mockabee Reference Mockabee2007; Froese, Bader, and Smith Reference Froese, Bader and Smith2008). The use of RELTRAD resulted in 1829 respondents classified as evangelical with the remainder of the sample (5493) being coded 0.
For purposes of the initial regression analysis, several control variables were employed specifically related to demographic factors. A dummy variable for gender has been included as previous research has indicated that females show higher levels of tolerance (Gibson Reference Gibson1992; Froese, Bader, and Smith Reference Froese, Bader and Smith2008). Also a dichotomous variable has been included for race, with “White” being coded 1 and nonwhite coded as 0. Additionally, a control for region of the country has been included that separates those from the American south from the rest of the sample, this has shown to be an important control in previous work (Ellison and Sherkat Reference Ellison and Sherkat1993). Additional controls include age (Hunter Reference Hunter1992; Wilson Reference Wilson1994), education (McClosky and Brill Reference McClosky and Brill1983; Nunn, Crockett, and Williams Reference Nunn, Crockett and Williams1978; Bobo and Licari, Reference Bobo and Licari1989), Republican ideology (Wilcox and Jelen Reference Wilcox and Jelen1990; Reimer and Park Reference Reimer and Park2001) as well as using an occupational prestige score as a proxy for income as nearly half of the respondents refused to disclose their income (Eisenstein Reference Eisenstein2006; Froese, Bader, and Smith Reference Froese, Bader and Smith2008). Additionally, there were dummies included for each of the two years of the survey to control for the variance between the samples.
RESULTS
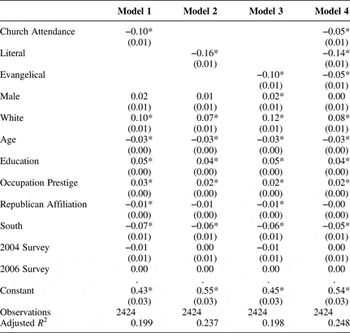
Four different models were run to test each of the three independent variables as well as a model with all three independent variables combined, the results of which can be found in Table 1. When each independent variable is included by itself in regression analysis all show significant effects and indicate greater levels of intolerance. Individuals who attend church weekly or more and also those classified as evangelical show a 10% increase in intolerance than the rest of the sample. Literalism also has a negative effect on intolerance but at a larger magnitude than church attendance and evangelicalism. These results give further support to all three of the competing theories of religion and tolerance. The control variables respond in consistent ways to previous research with those living in the south, older respondents, and those with Republican ideology indicating greater levels of intolerance. Conversely, education, occupational prestige, and white respondents all generating higher levels of tolerance — again all these results bear great resemblance to previous scholarship (Bobo and Licari Reference Bobo and Licari1989; Wilcox and Jelen Reference Wilcox and Jelen1990; Froese, Bader, and Smith Reference Froese, Bader and Smith2008; Eisenstein Reference Eisenstein2008).
Linear regression predicting political tolerance

Standard errors in parentheses. *p < 0.05
Model 4 is a combination of the three independent variables as well as the same controls. The results of this analysis indicate that all three variables remain statistically significant and are signed in the negative direction. While the effect of literalism is only slightly diminished, the coefficients for attendance and evangelicalism are reduced by half. The results of Model 4 indicate however a worthwhile opportunity to use matching analysis to further test these results. It would appear that this analysis indicates that all three hypotheses: behavior (measured through church attendance), belief (measured through biblical literalism), and belonging (measured through evangelicalism) generate greater levels of intolerance. Matching will allow for a further isolation of each variable, potentially offering new insights into the relationship between religion and tolerance.
As indicated above, matching has the distinct advantage of being able to employ much larger numbers of covariates than regression that in effect generates a more precisely specified model. For this analysis, a number of covariate are included that were not initially part of the regression models. These new covariates fall in several broad categories: demographic controls, religious experience, and public opinion on social issues.Footnote 5 The result of having such a significant increase in the number of variables is a model that can more closely match those in the treatment group and those in the control group.
The ways to match those in the treatment and control groups are varied, but the goal of each matching routine is the same — to reduce the bias between the two groups. In an effort, to accomplish this, five different matching routines were attempted, each varying several key parameters in an attempt to balance the two samples. This analysis was accomplished by using the psmatch2 routine written for STATA (Leuven and Sianesi Reference Leuven and Sianesi2003). The method that was able to reduce the bias the most was normal kernel matching with acaliper included.Footnote 6 Observations outside common support for both the treatment and control variables were discarded from the analysis, a process which improves estimation (Ho et al. Reference Ho, Imai, King and Stuart2007).
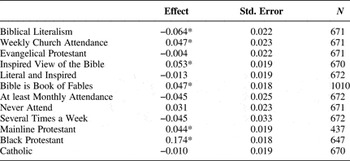
The matching process was conducted in three different scenarios initially. The three key variables of interest — evangelical, literalism, and church attendance — were included in their own models with the remaining two independent variables included as covariates. Following the processing of the data through the use of matching a regression analysis was conducted of the matched sample, the results of which can be found in Table 2. The first three comparisons provide conflicting results to those found in the previous regression analysis. While the previous model that included all three independent variables indicated that evangelicalism, church attendance, and literalism caused increasing levels of intolerance, the processing of the data through matching has created a profoundly different outcome. While belief in a literal bible causes 6.5% more intolerance, church attendance has the opposite effect — causing a 4.7% increase in tolerance.Footnote 7
Matching analysis predicting tolerance

*p < 0.05.
To further test the important finding concerning literalism and intolerance, additional matching procedures were undertaken using different scenarios focused on respondent's perception of the Bible.Footnote 8 It would seem possible that individuals could be just as dogmatic about theirinspired view of the Bible as those who hold a literal view and this could lead to more intolerance. To test this possibility an additional matching routine was employed that used an inspired view of the Bible as the treatment. This also yields a statistically significant result, however in the opposite direction, an indication of more tolerance, not less. The same matching procedure was used for those who believed that Bible is merely a book of fables with the result being very similar to those with aninspired view of the Bible. Additional matching procedures were conducted that explore the relationship between differing levels of attendance. Matched sets were generated for those who attend church at least monthly, those who attend several times a week, as well as those who never attend, however none of this analysis yields statistical significance. Different religious groups were also used as means of matching, including mainline Protestants, Black Protestants, and Catholics. Interestingly, both mainline Protestants as well as Black Protestants show greater levels of tolerance, especially in the case of Black Protestants that increases tolerance by a tremendous 17.4%.
The results of this analysis provide clear conclusions for the three hypotheses being tested. While biblical literalism generates more intolerant attitudes, the effect of attending church at least weekly demonstrates an increase in political tolerance. Furthermore, the finding concerning biblical literalism is unique to this understanding of scripture, as those who belief that the Bible is inspired but not literal as well as those who responded that the Bible is a book of ancient fables both show higher levels of tolerance, not lower. It would appear that the matching procedure has been able to isolate causation in a way that has not been seen before. However, another interesting pattern emerges when looking at each individual scenario for intolerance offered up the GSS.
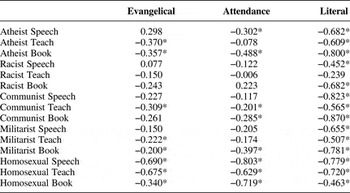
Table 3 displays the results of logistic regression without using the matching procedure with all control variables that were included in the model found in Table 1. The model is very robust in that it predicts intolerance in a large number of scenarios (30 of 45). The model is especially conclusive in the area of biblical literalism, with the results of all 15 scenarios being statistically significant and signed in the direction of intolerance. This provides a solid confirmation of the matching results found previously. Similiarly, to the results found in Table 1, each of the three B's is a strong predictor of political intolerance with evangelicalism generating intolerance in a majority of scenarios (eight of 15), while a similar result found in the relationship between weekly church attendance and intolerance.
Logistic regression without matching across all tolerance questions

*p < 0.05
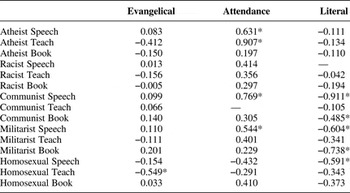
Table 4 however indicates that the results of a logistic regression do not tell the entire story. Table 4 was constructed using the same matching procedure described above using the same covariates, followed by a logistic regression in each of the 45 scenarios. Here the pattern of the results is strikingly different. While statistical significance was found in 30 of 45 cases in the regression without matching, here just eight cases reach statistical significance. The effect of evangelicalism only displays intolerance in one of 15 scenarios (a homosexual teaching in a local school), instead of eight cases in Table 3. Literalism still generates intolerance, but in just four cases instead of 14. However, the most surprising result is found in the relationship between weekly church attendance and political tolerance. In three of the scenarios (an atheist giving a speech in the community, an atheist teaching in the local school, and a militarist giving a speech), weekly church attendance is linked to more tolerant attitudes.
Logistic regression following matching across all tolerance questions

*p < 0.05.
DISCUSSION
While proving causation is almost impossible in the social sciences, it is my belief that the results reported here through the use of matching help to take a significant step forward in explaining the important relationship between religion and tolerance. While many researchers have previously indicated that evangelical Protestants show higher levels of intolerance (Stouffer Reference Stouffer1955; Nunn, Crockett, and Williams Reference Nunn, Crockett and Williams1978; Beatty and Walter Reference Beatty and Walter1984) it would appear that it is not evangelicalism per se that leads to this observed phenomenon. Instead it is likely that the religious belief held by many evangelicals in a literal Bible was generating the effect. Additionally, these matching results strike a blow to those who argue that religious attendance is the cause of intolerance, as the findings clearly indicate that those who attend church frequently show some signs of higher levels of tolerance.
While it would seem apparent that biblical literalism is indeed a cause of intolerance in religious people in the sample, there is still the small possibility that literalism itself could be merely an intervening variable. For example, work done by Froese, Bader, and Smith (Reference Froese, Bader and Smith2008) explore other potentially causal relationships — sacralization ideology (“the belief that religious and secular institutions should be more closely in collaboration”) (Froese, Bader, and Smith Reference Froese, Bader and Smith2008, 103) as well as an individual's view of God (Mother or Father, Lover or Judge). Additionally, the finding concerning biblical literalism demands further scrutiny. While the GSS gives respondents just three possible responses to how they view the Bible it is possible that there are different intensities of literalist theology. Additional survey research should be conducted to more fully understand the concept of literalism.
However, the findings in Table 4 are worth further reflection. While traditionally throughout this literature the relationship between church attendance and tolerance has been a negative one (Sullivan, Piereson, and Marcus Reference Sullivan, Piereson and Marcus1982; Beatty and Walter Reference Beatty and Walter1984), here the finding on weekly church attendance is the opposite direction. What could potentially explain this relationship? Recent work by Putnam and Campbell on the issue of tolerance have found that when an individual personally knows someone who is a member of outsider group (such as a homosexual or an atheist) they become much more tolerant of that divergent view, they call this scenario ‘bridging’ (Putnam and Campbell Reference Putnam and Campbell2010). It seems plausible that through the process of attending a church on a regular basis individuals come into contact with those whom they disagree or would otherwise be insulated from and the result of this is an increased level of political tolerance. This is a finding that is in need of further scrutiny as it could possibly be a new direction for future research in the field of tolerance.
Supplementary materials and methods
The Supplementary material refered to in this paper can be found online at journals.cambridge.org/rap.