Implications
This study estimates failure costs of mastitis in small holder dairy farms, quantifies the between-farm variation and identifies the most important drivers of this variation. Herd health advisors can use these data to better interpret the economic consequences of farm-specific mastitis situations and motivate dairy farmers to implement mastitis control measures. Altogether, this will contribute to improved dairy cattle production efficiency resulting in improved farmer’s income and their family’s subsistence.
Introduction
Mastitis is a common production disease affecting dairy cows worldwide. In many countries and for many circumstances, it has been calculated how costly mastitis is to a farmer (Huijps et al., Reference Huijps, Lam and Hogeveen2008; Geary et al., Reference Geary, Lopez-Villalobos, Begley, McCoy, O’Brien, O’Grady and Shalloo2012; Guimarães et al., Reference Guimarães, Brito, Lange, Silva, Ribeiro, Mendonça, Mendonça and Souza2017). Often, such studies estimate failure costs (costs resulting from having mastitis), rather than preventive costs (costs associated with prevention of mastitis) (van Soest et al., Reference van Soest, Santman-Berends, Lam and Hogeveen2016; Hogeveen and van der Voort, Reference Hogeveen and van der Voort2017). Estimating farm-specific failure costs is instrumental in motivating farmers to control mastitis and to support on-farm decision making as it helps evaluating the profitability of preventive measures (Heikkilä et al., Reference Heikkilä, Nousiainen and Pyörälä2012).
Although many articles have been published on the costs of mastitis, specific information on mastitis costs in developing countries is limited. Of the 37 studies recently reviewed by Hogeveen and van der Voort (Reference Hogeveen and van der Voort2017), only one was about a developing country (Getaneh et al., Reference Getaneh, Mekonnen and Hogeveen2017). As the management systems, income of farmers and other related features are different, generally, it is not possible to generalize the findings from studies conducted in industrialized countries to developing countries (Hogeveen and Østerås, Reference Hogeveen, Østerås and Hogeveen2005; Food and Agricultural Organization, 2014). So in order to get a better estimate of the costs of mastitis specifically for the situation in developing countries more estimates are needed. This can be done in a normative way, by adjusting the input of generic herd simulation models, such as SimHerd (Østergaard et al., Reference Østergaard, Chagunda, Friggens, Bennedsgaard and Klaas2005) or by building specific simulation models (Getaneh et al., Reference Getaneh, Mekonnen and Hogeveen2017). Another approach is to estimate farm-specific costs of mastitis, based on data collected on farms. Dairy production is of great importance for the Ethiopian economy (Tangka et al., Reference Tangka, Emerson and Jabbar2002). Urban and peri-urban dairy farmers serve as the major milk suppliers for the fast growing urban milk market (Gebre-Wold et al., Reference Gebre-Wold, Alemayehu, Demeke, Bediye and Tadesse1998; Ayenew et al., Reference Ayenew, Wurzinger, Tegegne and Zollitsch2009). In Ethiopia, mastitis is a common problem on dairy farms. Farmers often notice cases of clinical mastitis (CM), but generally are less aware of subclinical mastitis (SCM), despite its high prevalence (Almaw et al., Reference Almaw, Zerihun and Asfaw2008; Tolosa et al., Reference Tolosa, Verbeke, Ayana, Piepers, Supré and De Vliegher2015). Data in one of our previous studies show that unlike their knowledge on CM only seven of 151 dairy farmers in Ethiopia were familiar with SCM (Mekonnen et al., Reference Mekonnen, Koop, Melkie, Getahun, Hogeveen and Lam2017). Good estimates of mastitis costs, including costs of SCM may help motivate farmers to take preventive mastitis management measures. Particularly, the estimation of farm-specific costs can be helpful, as it provides farmers with a benchmark against which to assess their own situation.
The costs of mastitis are not well studied in Ethiopian dairy farms or for other subsaharan countries. Two Ethiopian studies have been published on the economic impact of SCM: Mungube et al. (Reference Mungube, Tenhagen, Regassa, Kyule, Shiferaw, Kassa and Baumann2005) reported a financial loss of US$38 and Tesfaye et al. (Reference Tesfaye, Regassa and Kelay2010) reported US$79 per cow per lactation. In these studies, the calculation was based on a relatively old estimation (1985) of milk yield at the early days of crossbreeding of Holstein Friesian × Zebu breed cows (Mekonnen et al., Reference Mekonnen, Demeke and Assefa1985). In the meantime, the average milk yield of crossbreed cows has increased because of increased Holstein Friesian blood level, resulting in higher milk yield, but likely also in increased prevalence of SCM, as the Holstein Friesian blood level was found to be positively associated with SCM prevalence in Ethiopia (Mekonnen et al., Reference Mekonnen, Koop, Melkie, Getahun, Hogeveen and Lam2017). In addition, costs related to CM such as costs related to treatment, culling and labour in managing sick cows have, in previous studies, not been included despite the fact that these costs are expected to be substantial. Recently, the total costs of CM and SCM were estimated for Ethiopian market-oriented dairy farms by using a normative bio-economic simulation model (Getaneh et al., Reference Getaneh, Mekonnen and Hogeveen2017), using available knowledge from the literature. Because hardly any data from Ethiopia were available, almost all parameters had to be based on knowledge from other countries and experts’ opinions (Getaneh et al., Reference Getaneh, Mekonnen and Hogeveen2017). Moreover, although a normative study with limited data can give insight in the average costs of mastitis, insight in the real farm-to-farm variation in costs is difficult to obtain with such models. Additionally, mastitis control programs are not yet developed in Ethiopia. Management measures to prevent mastitis are rarely implemented, and to obtain data on costs associated with these preventive measures is very difficult. By calculating the failure costs of mastitis, awareness of the financial consequences of mastitis can be created. Consequently, the possibility of financial returns from improving udder health can be illustrated, which is a first step for udder health control and an important part of farmers’ motivation to improve udder health.
In this study, we collected the farm-specific parameters needed to calculate per-farm failure costs of mastitis through questionnaires and by testing individual cows for SCM on 150 farms. Our aims were to estimate the average total failure costs of mastitis in North-Western Ethiopian urban and peri-urban dairy farms and to quantify the between-farm variation in these costs.
Material and methods
Studied herds and sampling design
The studied herds kept Holstein Friesian × Zebu breed cows. The herds were selected from a list of urban or peri-urban dairy farms in the area of Bahir Dar and Gondar in North-Western Ethiopia. By collecting lists of dairy farms from artificial insemination records, from dairy cooperatives, and from veterinary clinics, a long list of 1 209 dairy farms from Gondar and of 272 from Bahir Dar was made. Computer generated random numbers were assigned, stratified for Gondar and Bahir Dar, to all farms on the long list. Farms were enrolled in the order of the assigned random numbers.
If a farmer was not willing to participate in the study, had stopped dairy farming, if the farm could not be found or if a farm only had cows of indigenous breeds, that farm was skipped from the list and the farm with the next number was approached. For these reasons, 230 farms in Gondar and five farms in Bahir Dar were skipped. Finally, we could include a total of 150 farms, 89 from Gondar (27% of the listed farms) and 61 from Bahir Dar (26% of the listed farms). The studied herds and the sampling design have been described in more detail by Mekonnen et al. (Reference Mekonnen, Koop, Melkie, Getahun, Hogeveen and Lam2017).
Design of the questionnaire and on farm data collection
A questionnaire aiming to collect data required to estimate the farm-specific failure costs of mastitis was prepared based on literature and our own expertise. Questions were designed to collect data in such a way that farm-specific calculations of the failure costs of mastitis (after Huijps et al. Reference Huijps, Lam and Hogeveen2008) could be made. Data included the average milk yield and lactation length, the occurrence of CM during the last year (365 days), the impact of mastitis on milk yield, treatments and the duration of treatments, the withholding periods, costs of veterinary service, costs of labour and costs of culling.
The order of the questions was carefully chosen in order to avoid leading questions. The original English questionnaire was translated to the farmers’ local language (Amharic), and subsequently translated back into English by an external translator to validate the translation. Corrections were subsequently made to the translation based on the comparison of different versions. In addition, the questionnaire was tested by performing five pilot interviews in a convenience sample of farmers. Selection of participants and the data collection took place together with data collection for another study in which the data collection procedure was described in more detail (Mekonnen et al., Reference Mekonnen, Koop, Melkie, Getahun, Hogeveen and Lam2017). Two veterinary students interested to participate in the data collection were selected. These students were instructed about the purpose of the study and about the questions in the questionnaire by the first author. Specific attention was given to a consistent approach and questioning of the farmers. Pilot interviews were held with five farmers to test the consistency and clarity of the questions. The students attended the pilot interviews made by the first author. The actual interviewing and California mastitis test (CMT) was executed by the first author together with the two students. Data from 17 farms could not be used in the analysis, because the data from these farms were incomplete. Eventually, from 150 of the 167 farms enrolled in the study, the data were sufficient to calculate failure costs. Since there is no routine testing program for SCM in place, milk from each quarter of each cow was tested with the CMT. Quarter milk CMT scores were classified as negative (0), trace (T), weakly positive (1+), distinctively positive (2+), and strongly positive (3+), in accordance with National Mastitis Council (1999). A quarter was considered to have SCM if it scored trace (T), +1, +2 or +3.
Calculation of failure costs
Failure costs of mastitis were calculated based on the prevalence of SCM by the CMT score at quarter level and the incidence of CM obtained from the questionnaire, in combination with information obtained from the questionnaire and the literature. When a farmer did not have information on specific parameters, these were estimated. For instance, the quantity of discarded milk during treatment was estimated by assuming that all quarters of a cow contribute equally to the average milk yield of a cow and was furthermore based on the farmer’s response on the number of quarters from which milk was withheld or discarded; the time that was spent in managing a sick cow was estimated by our experience to be 10 min per day; sick cows need special management for 5 days and animal attendants working time was estimated to be 10 h per day. Calculations were carried out at the farm level. The calculations were done, based on the framework described by Halasa et al. (Reference Halasa, Huijps, Østerås and Hogeveen2007) and the methodology used by Huijps et al. (Reference Huijps, Lam and Hogeveen2008), with the costs of SCM based on CMT scores. Costs of milk production losses due to CM, treatment (antibiotics, labour and discarded milk), veterinary visits and culling were summed to estimate the total failure costs of CM. As farmers did not have information on the effect of SCM on milk yield, we used data from a study conducted on crossbred dairy cows in Ethiopia (Mungube et al., Reference Mungube, Tenhagen, Regassa, Kyule, Shiferaw, Kassa and Baumann2005), which showed that udder quarters with CMT scores of 1+, 2+ and 3+ had a reduced milk production of 1.2%, 6.3% and 33%, respectively, compared to CMT score 0. Data used to calculate the failure costs of mastitis and the calculation are available in Supplementary Material S1.
To estimate the total failure costs per farm, we made the following assumptions:
1. Because there is no routine testing of SCM in Ethiopia, we assumed a constant SCM prevalence at the herd level over the year, based on the single cross-sectional CMT measurement during the farm visit.
2. Milk production losses from quarters with a CMT score T and a CMT score 1+ were considered to be equivalent (Mungube et al., Reference Mungube, Tenhagen, Regassa, Kyule, Shiferaw, Kassa and Baumann2005).
3. The value of milk suckled by calves while CM cows were not milked because of treatment and drug withdrawal was considered to be insignificant.
4. Only one quarter was assumed to be affected in a cow with CM.
5. Because parity of cows was generally unknown to the farmers, all CM cases were considered to occur in the same average parity.
6. Because dairy farmers did not have any cow records, lactation length was uncertain. Therefore, the failure costs of mastitis per lactating cow were estimated at an average lactation length (314 days).
7. If farmers could not estimate the duration of milk production losses due to CM after the drug withdrawal period, milk production losses due to CM were considered to last for half a lactation.
8. Milk production level was considered constant throughout lactation.
9. Losses in milk production due to CM and SCM were calculated independent from each other.
10. When a farmer had veterinary service from a governmental veterinary clinic as well as from a private veterinary service, it was assumed that half of the cases were treated by the government veterinary clinic and half by the private veterinarian.
Costs of subclinical mastitis. The costs of SCM is estimated as:
 $$\eqalign{C_{i}^{\rm{SCM}}={\scale 150%[} ( N_{\rm{T}1\it i}^{\rm{SCM}}*0.012 \right)+( N_{2i}^{\rm{SCM}}*0.063 ) \cr +( N_{3i}^{\rm{SCM}}*0.33 ) {\scale 150%]}*\rm{Av}{{\rm{M}}_{\it i}}/4*{{\it l}_{\it i}}*{\it P}_{\it i}^{\it M}}$$
([1])
where:
 $C_{i}^{\rm{SCM}}$
= costs of SCM in farm i
-
$N_{\rm{T}{1\it i},{2\it i},{3\it i}}^{\rm{SCM}}$
= number of SCM quarters with CMT score T, 1+, 2+ or 3+ in farm i
-
$\rm{Av}{{\rm{M}}_{\it i}}$
= average daily milk yield of cows in kg in farm i
-
${{l}_{i}}$
= lactation length in days in farm i
-
$P_{i}^{M}$
= price per kg of milk in farm i.


Costs of withholding or discarding milk due to clinical mastitis. In this paper, we define withholding milk as milk not being delivered to the market for a certain period of time. If a cow has a quarter with CM, milk can be withheld from all quarters, or only of the affected quarter, while milk of the unaffected quarters is delivered. In some farms, a cow with a CM quarter was not milked at all, but was suckled by a calf during treatment, while the cow was milked again after the end of the treatment period. In other farms, only CM quarters were not milked during the period of treatment and drug withdrawal. The number of days that milk was withheld or discarded for drug withdrawal differed between farms. Therefore, the calculations were made specific to the individual farm situation as follows:
 $$C_{i}^{\rm{WD}}={{N}_{i}}*{\rm{Av}}{{\rm{M}}_{i}}/4*(T_{i}^{T}+T_{i}^{W})*P_{i}^{M}$$
([2])
where:
-
$C_{i}^{\rm{WD}}$
= costs of withholding or discarding milk due to CM in farm i
-
${{N}_{i}}$
= number of quarters not milked in farm i during treatment and for variable drug withdrawal period (days)
-
${\rm{Av}}{{\rm{M}}_{i}}/4$
= average daily milk yield per quarter in farm i
-
$T_{i}^{T}$
= number of days milk withheld because of treatment in farm i
-
$T_{i}^{W}$
= number of days milk withheld because of drug withdrawal in farm i
-
$P_{i}^{M}$
= price per kg of milk in farm i.


Costs of milk production losses due to clinical mastitis. Costs of milk production losses due to CM after the drug withdrawal period were estimated based on the number of CM cases, the milk production losses per day and duration of milk production losses:
 $$C_{i}^{\rm{ML}}=N_{i}^{\rm{CM}}*L_{di}^{M}*T_{i}^{\rm{ML}}*P_{i}^{M}$$
([3])
where:
-
$C_{i}^{\rm{ML}}$
= costs of milk production losses after drug withdrawal period in farm i
-
$N_{i}^{\rm{CM}}$
= number of CM cases in farm is
-
$L_{di}^{M}$
= milk production losses in kg per day due to CM after drug withdrawal period in farm i
-
$T_{i}^{\rm{ML}}$
= duration of milk production losses (days) due to CM after the drug withdrawal period in farm i
-
$P_{i}^{M}$
= price per kg of milk in farm i.


Costs of veterinary services and drugs. The costs of veterinary services and drugs were calculated using the number of CM cases and the price for veterinary services and drugs:
 $$C_{i}^{\rm{VSD}}=N_{i}^{\rm{CM}}\left \, ( P_{i}^{\rm{VS}}+P_{i}^{D} \right)$$
([4])
where:
-
${{C}_{i}}^{\rm{VSD}}$
= costs of veterinary services and drugs in farm i
-
$N_{i}^{\rm{CM}}$
= number of CM cases in farm i
-
$P_{i}^{\rm{VS}}$
= price of veterinary service per case in farm i
-
$P_{i}^{D}$
= price of drugs per case in farm i.


Costs of labour. The amount of labour that the farmer spent on CM differed, depending on the source of the veterinary service. In farms that obtain veterinary services from a private veterinarian or treat mastitis themselves, CM cases cost them extra labour for managing the sick cow. This was estimated to be 50 min per case. In farms that use government veterinary service, there were additional labour costs, because the cow had to be taken to and from the governmental veterinary clinic. In farms that use private veterinary service and in farms where the farmer treats CM himself, the costs were calculated as:
 $$C_{i}^{\rm{L}}=N_{i}^{\rm{CM}}*P_{i}^{\rm{Lh}}*{50\over60}$$
([5])
In farms that use government veterinary service as
 $$C_{i}^{\rm{L}}=\left( N_{i}^{\rm{CM}}*P_{i}^{\rm{Lh}}*{50\over60} \right)+(N_{i}^{\rm{CM}}*P_{i}^{\rm{Lh}}*T_{i}^{\rm{TR}})$$
([6])
In farms that use both, private and government veterinary services as
 $$C_{i}^{L}={1\over2}\Big(N_{i}^{\rm{CM}}*P_{i}^{\rm{Lh}}*{50\over60}\Big)+{1\over2}{\Big[\Big( N_{i}^{\rm{CM}}*P_{i}^{\rm{Lh}}*{50\over60} \Big) +(N_{i}^{\rm{CM}}*P_{i}^{\rm{Lh}}*T_{i}^{\rm{TR}})\Big]}$$
([7])
where:
-
$ {{{C}_{i}}^{\rm{L}}} $
= costs of labour because of CM in farm i
-
$N_{i}^{\rm{CM}}$
= number of CM cases in farm i
-
$P_{i}^{\rm{Lh}}$
= price of labour per hour in farm i
-
$T_{i}^{\rm{TR}}$
= time spent to take a cow to and from a governmental veterinary clinic in farm i.


Costs of culling. The costs of culling because of mastitis were calculated based on the price of a replacement cow and the slaughter value of the culled cow:
 $$C_{i}^{\rm{Cu}}=N_{i}^{\rm{Cu}}*(C_{i}^{R}-P_{i}^{\rm{Cu}})$$
([8])
where:
-
$ {{C}_{i}}^{\rm{Cu}} $
= costs of mastitis-related culling in farm i
-
$N_{i}^{\rm{Cu}}$
= number of cows culled because of mastitis in farm i
-
$C_{i}^{R}$
= costs of a replacement cow in farm i
-
$P_{i}^{\rm{Cu}}$
= slaughter value of a culled cow in farm i.


Total failure costs of mastitis. The total farm-specific failure costs of mastitis in farm i were calculated by summing the individual cost factors:
 $${\rm{FC}}{{\rm{M}}_{i}}=C_{i}^{\rm{SCM}}+C_{i}^{\rm{WD}}+C_{i}^{\rm{ML}}+C_{i}^{\rm{VSD}}+C_{i}^{\rm{L}}+C_{i}^{\rm{Cu}}$$
([9])
Where:
FCM i = total failure costs of mastitis in farm i
-
${{C}_{i}}^{\rm{SCM}}$
= costs of SCM in farm i
-
${{C}_{i}}^{\rm{WD}}$
= costs of withholding or discarding milk due to CM in farm i
-
${{C}_{i}}^{\rm{ML}}$
= costs of milk production losses after milk discarding in farm i
-
${{C}_{i}}^{\rm{VSD}}$
= costs of veterinary services and drugs
-
${{C}_{i}}^{\rm{L}}$
= costs of labour in farm i
-
${{C}_{i}}^{Cu}$
= costs of culling in farm i.


Farm-specific failure costs of mastitis. The farm-specific failure costs of mastitis per cow were estimated by dividing the FCM i by the number of lactating cows on the farm:
 $${\rm{FCM}}_{i}^{c}={{\rm{FCM}}_i \over N_{i}^{\rm{Co}}}$$
([10])
where:
-
${\rm{FCM}}_{i}^{c}$
= failure costs of mastitis per cow in farm i
FCM i = total failure costs of mastitis in farm i
-
${{N}_{i}}^{\rm{Co}}$
= number of lactating cows in farm i.


Because apart from production losses due to SCM, all other costs are related to CM, the failure costs per case of CM per farm could be calculated as
 $${\rm{FCM}}_{i}^{\rm{ca}}\,=\,{{\rm{FC}}{{\rm{M}}_{i}}-C_{i}^{\rm{SCM}}\over N_{i}^{\rm{CM}}}$$
([11])
where:
-
${\rm{FCM}}_{i}^{\rm{ca}}$
= failure costs per case of CM in farm i
FCM i = total failure costs in farm i
-
${{C}_{i}}^{\rm{SCM}}$
= costs of SCM in farm i
-
${{N}_{i}}^{\rm{CM}}$
= number of CM cases in farm i.


Average farm-specific failure costs of mastitis per year. The average farm-specific failure costs of mastitis per year were estimated by dividing the sum of failure costs of mastitis of all farms by the number of participated farms:
 $${\rm{AvFCM}}={\mathop{\sum }_{i=1}^{n}\left( {\rm{FC}}{{\rm{M}}_{i}} \right)\over N}$$
([12])
where:
-
$\rm{AvFCM}$
= average failure costs of mastitis
FCMi = failure costs of mastitis in farm i
N = number of participated farms.

Sensitivity analysis
The milk production losses due to SCM were based on the study by Mungube et al. (Reference Mungube, Tenhagen, Regassa, Kyule, Shiferaw, Kassa and Baumann2005), who estimated losses from SCM by comparing milk yield from mastitic quarters with mastitis-free quarters within a cow. It is known, however, that mastitis-free quarters partially compensate the reduced milk yield of mastitic quarters (McDougall, Reference McDougall2002; Green et al., Reference Green, Schukken and Green2006). Thus, the default calculation of milk production losses, based on the study by Mungube et al. (Reference Mungube, Tenhagen, Regassa, Kyule, Shiferaw, Kassa and Baumann2005) can be seen as maximum production losses. Therefore, we considered a scenario where 50% of the milk production losses reported by Mungube et al. (Reference Mungube, Tenhagen, Regassa, Kyule, Shiferaw, Kassa and Baumann2005) were used in the calculations. Because the price of milk was highly variable between farms, depending on their market circumstances, the calculations were also carried out with a fixed, average milk price instead of the individual farmer reported milk prices.
Results
All farms used a tied housing system and farmers hand milked their cows twice a day. The studied herds had, on average, 5.6 head of cattle, varying from 1 to 37, and 2.8 lactating cows, varying from 1 to 17. Dairy farmers sold the milk they produced directly to families (68%), restaurants and hotels (23%), or through a farmers’ cooperative (9%). Forty-one percent of farms used a government veterinary clinic, 41% of farms used a private veterinary service, 9% used both and 9% of the farmers used no veterinarian and treated their cows with antibiotics themselves.
The average incidence of CM across farms was 0.13 cases per quarter per year. Most farms (75 of 150 farms) did not experience CM at all in the last year. Of the farms that did experience CM, the incidence varied largely, mainly due to small herd sizes.
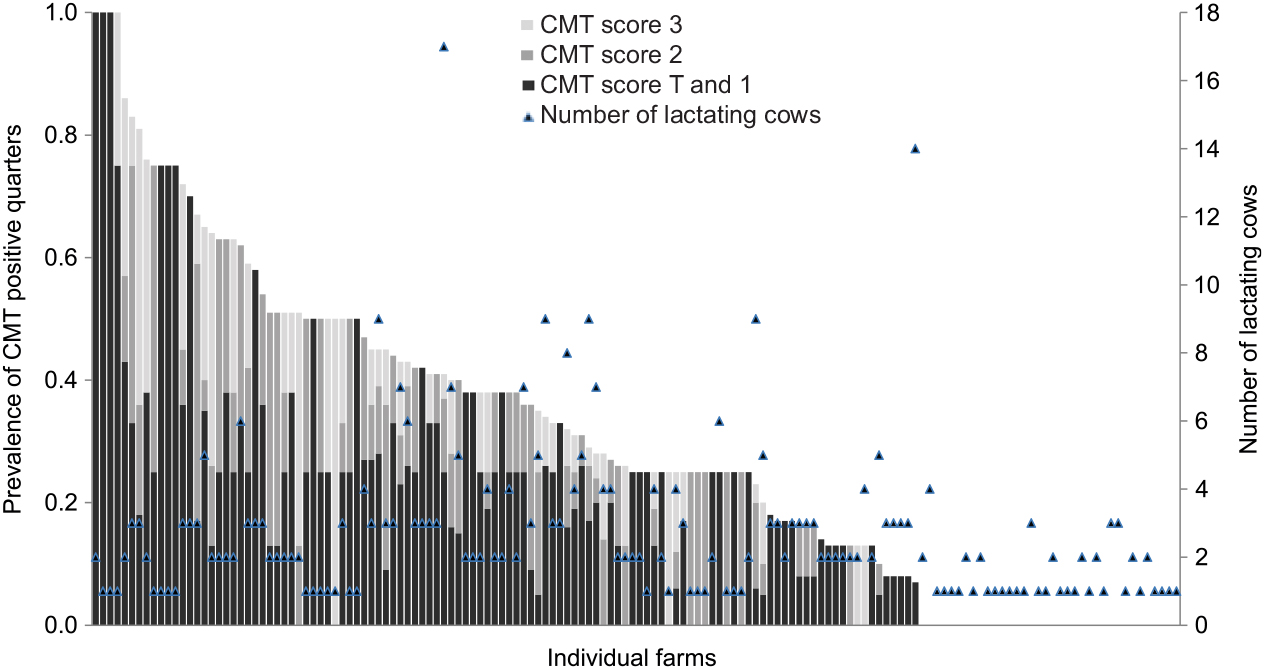
The average within farm prevalence of positive CMT (≥T) score was 30%, with a large variation between farms as shown in Figure 1. Since the existence of very small farms may influence the estimate of the mean prevalence, the farm size is also provided in Figure 1. Extreme prevalences (very low or very high) were found in farms with a small number of cows. On 30 farms, no positive CMT scores were found.
The prevalences of quarters of positive CMT score T (trace) and 1 (weakly positive), CMT score 2 (distinctively positive) and CMT score 3 (strongly positive) in 150 market-oriented dairy cow farms in North-Western Ethiopia. CMT = California mastitis test.

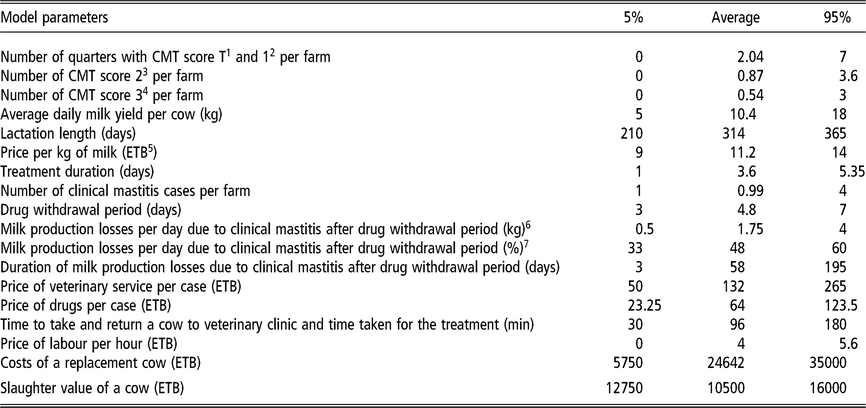
The minimum, average and maximum values of the most important input items are summarized in Table 1. Milk price, duration of milk production losses after clinical recovery and costs of culling varied largely between farms.
Descriptive statistics of model input parameters based on a questionnaire administered at 150 market-oriented dairy cow farms in North-Western Ethiopia

CMT = California mastitis test; ETB = Ethiopian Birr.
1 Trace based on CMT score.
2 Weakly positive CMT score.
3 Distinctively positive CMT score.
4 Strongly positive CMT score.
5 1 ETB = 0.0449 USD.
6 Response of 60 dairy farmers who experienced CM last year for the milk losses due to clinical mastitis after drug withdrawal period.
7 Response of 15 dairy farmers who experienced clinical mastitis last year for the milk losses due to clinical mastitis after drug withdrawal period.
Failure costs of mastitis
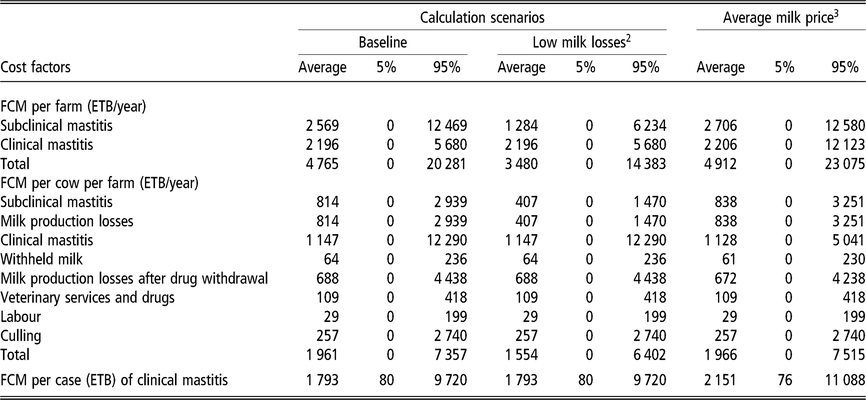
The average farm-specific failure costs of mastitis per year in North-Western Ethiopian dairy farms were 4 765 Ethiopian Birr (ETB) (1 ETB = 0.0449 USD) at the baseline scenario and 3 485 ETB at the low milk production losses scenario (Table 2). The average farm-specific failure costs per lactating cow per farm per year, respectively, were 1 961 ETB and 1 554 ETB at the baseline and at low milk production losses scenarios.
Average farm-specific failure costs of mastitis in ETB 1 (1 ETB = 0.0449 USD) per farm per year and per lactating cow per farm per year at a baseline scenario and at a low milk production losses scenario, based on farmers’ reported milk prices, and at an average milk price 11.20 ETB on 150 market-oriented dairy farms in North-Western Ethiopia

ETB = Ethiopian Birr; UDS = United States Dollar; FCM = Failure costs of mastitis.
1 1 ETB = 0.0449 USD.
2 An alternative scenario where 50% of the milk production losses as reported by Mungubeet al. (Reference Mungube, Tenhagen, Regassa, Kyule, Shiferaw, Kassa and Baumann2005) were used.
3 Average milk price across farms, instead of the individual farm milk prices were used to calculate failure costs for individual farms.
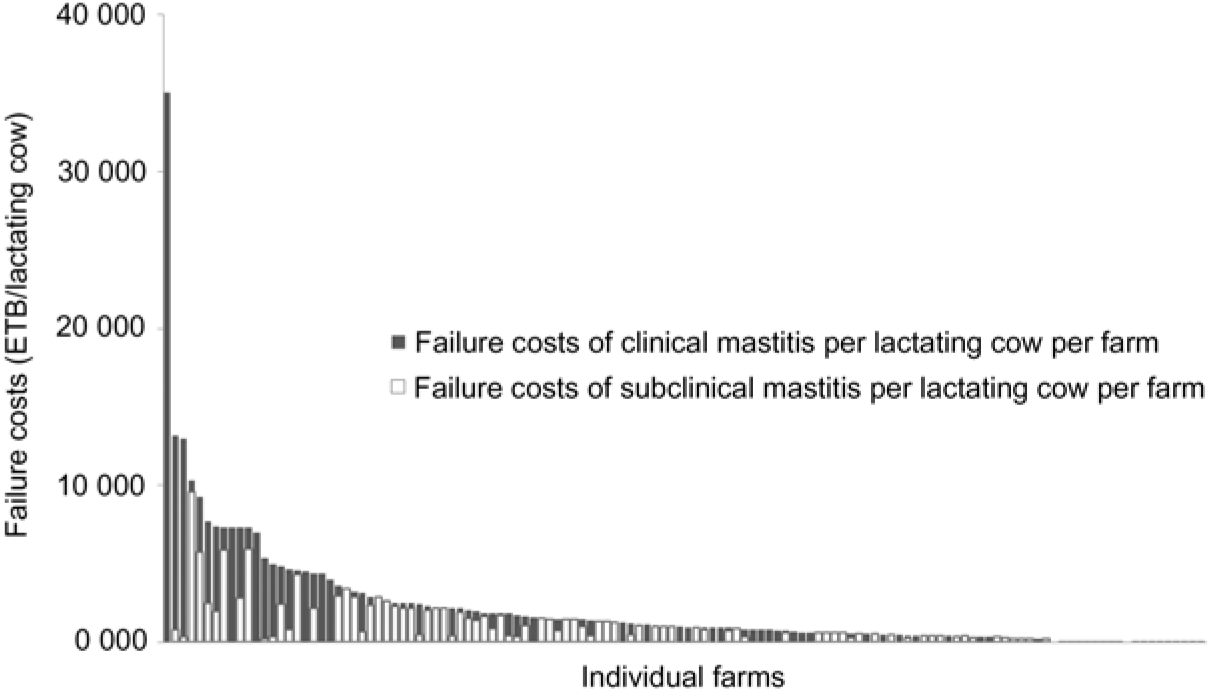
Large differences were seen between farms in the total failure costs of mastitis, costs of SCM and costs of CM per lactating cow per farm per year (Figure 2). The failure costs of CM per lactating cow were higher than the failure costs of SCM per lactating cow in the majority of the farms. Also, the costs of CM per cow per farm varied more than the costs of SCM per cow per farm. Although there was great variation in failure costs of mastitis per cow between farms of equal herd size, the variation in failure costs per cow per year was generally higher on the very small (1 to 2 lactating cows) farms.
Failure costs of mastitis in ETB per lactating cow per farm summed for subclinical mastitis and clinical mastitis on 150 market-oriented dairy farms in North-Western Ethiopia. ETB = Ethiopian Birr.

Discussion
One of the first prerequisites for dairy farmers to implement mastitis control measures is to perceive mastitis as an (economic) problem (Huijps et al., Reference Huijps, Lam and Hogeveen2008). However, dairy farmers do not always perceive mastitis as costly, and therefore often not as a problem at all. Although there is a reasonable number of papers on failure costs of mastitis, to our knowledge, only a few studies estimated the costs of mastitis at individual farm level (Huijps et al., Reference Huijps, Lam and Hogeveen2008; van Soest et al., Reference van Soest, Santman-Berends, Lam and Hogeveen2016; Guimarães et al., Reference Guimarães, Brito, Lange, Silva, Ribeiro, Mendonça, Mendonça and Souza2017). Specifically for developing countries, this type of knowledge, although valuable, is lacking. That is shown by the references used in this paper, which almost exclusively refer to North-Western European and North American dairy herds. Through estimating farm-specific failure costs of mastitis in dairy herds of small sizes in general and more specifically farm-specific failure costs of mastitis referring to North-Western Ethiopian dairy farms, our study shows the room for investment to improve mastitis management. So far, dairy farmers generally were unaware of SCM at all. Creating awareness on SCM may be an important step, because people first have to consider they have a problem before they will be motivated to solve that problem (Janz and Becker, Reference Janz and Becker1984). This may be helpful in their motivation to implement preventive measures that (partly) may have been known already, but that were so far considered to not be outweighing the problem to be solved. Thus, giving more insight in economic effects of mastitis may motivate individual dairy farmers to change their behavior related to udder health. These results may be helpful to alert other market-oriented dairy farmers in Ethiopia and in other Subsaharan countries with similar circumstances. Besides creating awareness with dairy farmers on the costs of mastitis and potential gains of improving the mastitis situation, it is important to make sure farmers know how to improve the mastitis situation by changing their management. In many developing countries, farmers have a lack of knowledge on proper mastitis management. In these situations, awareness creation should be accompanied by knowledge provision on improved management, for instance, through training.
Collecting data on factors such as parity, stage of lactation and breed under the local circumstances was quite challenging. Knowledge on the effect of season on milk production per cow would have had added value to our calculations, but it was not possible to collect those data in a reasonably precise way in the study approach chosen. Since there were no data on SCM, the results of the CMT tests were extrapolated towards a whole year. Consequently, the milk production losses due to SCM were based on the extrapolated CMT results and might have been over- or underestimated for indivudal farms. Moreover, the milk production losses due to CM and SCM were calculated independent from each other. This may lead to some double counting, although this is likely limited because losses due to SCM are relatively small compared to the farmers’ reported production losses due to CM and because there is only a few days of overlap between CM and SCM. The difference in the amount of milk production between CMT score trace and 1 was negligible in Holstein Friesian × Zebu crossbreed cows (Mungube et al., Reference Mungube, Tenhagen, Regassa, Kyule, Shiferaw, Kassa and Baumann2005). In some farms, a cow with a CM quarter was not milked at all, but was suckled by a calf during treatment and drug withdrawal, for a variable number of days per farm. Theoretically, the farmer then saves money for calf feed. However, most calves in North-Western Ethiopian dairy farms are fed by suckling with the cow and it is very difficult to collect reliable data for that short number of days calves may or may not be fed with milk. Therefore, the amount of money involved with milk for calves was considered to be very low and not in balance with the amount of work to collect that type of data.
We have learned from one of our earlier studies that increased or decreased parity is not a factor for occurrence of SCM in Ethiopian Holstein Friesian × Zebu crossbreed cows (Mekonnen et al., Reference Mekonnen, Koop, Melkie, Getahun, Hogeveen and Lam2017). This likely could be the same for CM. Also data on milk yield were obtained by asking the average milk production level of cows per farm across parities. In that case, the number of parity for occurrence of CM will have limited bias in calculating failure costs. Likewise, lactation length was considered to be equal for each cow due to a lack of data. Finally, we assumed an equal distribution between veterinary service from the governmental veterinary clinic and the private veterinary clinic if farmers used services from both.
Failure costs of mastitis
The average farm-specific failure costs were 4 765 ETB and 3 480 ETB per farm, and 1 961 ETB and 1 554 ETB per lactating cow per year at the baseline and the low milk losses scenario, respectively. This means that comparing with 4 765 ETB failure costs per farm per year, an average milk price, an average number of days in lactation, an average daily milk yield and an average number of lactating cows in a herd, the failure costs of mastitis per farm per year is equivalent to 4.7% of the average milk returns per farm and the loss is larger in farms with smaller herd size. By assuming that only one quarter was affected by CM, there might have been a small under estimation of the costs of CM in terms of withheld milk. The average farm-specific failure costs per farm were lower while the failure costs per lactating cow were higher than previously estimated for Ethiopian Holstein Friesian × Zebu breed cows (Getaneh et al., Reference Getaneh, Mekonnen and Hogeveen2017). Besides the failure costs described in this study, it is known that additional costs related to mastitis may result from associations with other diseases and reproductive failure (Gunay and Gunay, Reference Gunay and Gunay2008; Heravi Moussavi et al., Reference Heravi Moussavi, Danesh Mesgaran and Gilbert2012; Boujenane et al., Reference Boujenane, El Aimani and By2014). In this study, as in almost all other economic studies, such associations were not taken into account. This might have led to an underestimation of the failure costs of mastitis. Figure 2 shows a farm that has an exceptionally high mean cost of 35 084 ETB/cow/year. However, that situation was indeed exceptional and was an observation of a farm with one lactating cow that had CM and was culled.
In absolute terms, the failure costs of mastitis estimated per cow were lower than the failure costs estimated for Western dairy systems (Huijps et al., Reference Huijps, Lam and Hogeveen2008; Geary et al., Reference Geary, Lopez-Villalobos, Begley, McCoy, O’Brien, O’Grady and Shalloo2012; van Soest et al., Reference van Soest, Santman-Berends, Lam and Hogeveen2016). In relative terms, however, comparing the estimated failure costs of mastitis per cow with the milk returns per cow, the failure costs of mastitis in Ethiopia are high. Comparing 1 961 ETB failure costs per cow per year, an average milk price, an average number of days in lactation and an average daily milk yield revealed that the failure costs of mastitis per cow per year equal to 5.2% of the average milk returns per cow. If we do a similar calculation, for instance for Dutch dairy farms, the failure costs of mastitis per cow per year were 3.9% of the average milk returns per cow (Huijps et al., Reference Huijps, Lam and Hogeveen2008). This indicates that, in relative terms, these Ethiopian dairy farmers are losing larger income due to mastitis, as compared to Dutch dairy farms.
Great variations were seen in the average farm-specific failure costs and in the failure costs per cow between farms. In reality, the variation might even be bigger since we assumed, due to a lack of data that the milk production of CM were considered to last for half a lactation and that the milk production level was constant during lactation. This may lead to slightly under- or over-estimated failure costs of mastitis. The variation in milk price from 8 ETB to 15 ETB explains part of the high variation in failure costs between farms. When using the average milk price instead of the farm specific milk price, the 95th percentile of the failure costs increased from 20 281 ETB to 23 075 ETB and the variation in failure costs of mastitis between farms is mainly caused by the difference in incidence of CM and/or prevalence of SCM. When the average duration of milk production losses after clinical recovery was used, instead of the farmers’ reported duration of milk production losses after clinical recovery, the average failure costs of mastitis per lactating cow doubled (data not shown). This indicates that farmers underestimated milk production losses due to CM. The variation in failure costs due to mastitis between farms indicates that it is possible to gain additional income by controlling mastitis in North-Western Ethiopia.
All in all, the largest part of the variation in failure costs can be explained by differences in incidence of CM and prevalence of SCM. The large variation in incidence of CM and prevalence of SCM is partly due to the small sizes of the farms in the study, with a huge impact of one case of mastitis in small herds, for instance only one lactating cow. In our study, SCM was measured at one point in time, assuming it was constant throughout the year. Would SCM have been measured more frequently, the estimated SCM per farm would be closer to the mean, and variation between farms would be smaller. Therefore, we may have overestimated the variation in SCM. However, the large variation in incidence of CM and prevalence of SCM was also caused by the large differences in farmers’ management of mastitis (Mekonnen et al., Reference Mekonnen, Koop, Melkie, Getahun, Hogeveen and Lam2017).
Although we wanted to base the estimate of failure costs of mastitis as much as possible on actual farm data, it was not possible to retrieve all needed data from the field. Therefore, we had to make a number of assumptions, for instance on lactation length and parity of cows with CM. Because of these assumptions, there may be discrepancies between the real failure costs of mastitis and our estimates. In the sensitivity analysis, the effect of these assumptions were studied but were found to be small. For instance, the effect of a different lactation length was 18 ETB and 70 ETB on the average failure costs of mastitis per farm and per cow per year, respectively (data not shown). This indicates that the lack of information on these parameters, only had a minor effect on the estimates of the total failure costs of mastitis.
Failure costs of subclinical mastitis
A relatively large part (54%) of the total failure costs was due to SCM, which contradicts the results of Getaneh et al. (Reference Getaneh, Mekonnen and Hogeveen2017), who found a lower contribution of SCM to the failure costs of mastitis. One explanation could be differences in the prevalence of positive CMT score quarters. Getaneh et al. (Reference Getaneh, Mekonnen and Hogeveen2017) used a 40% cow level recovery rate of SCM, whereas in this study, prevalence of positive CMT score quarters were assumed to be constant throughout the year. The measurements in our study were, generally, better than that from the study by Getaneh et al. (Reference Getaneh, Mekonnen and Hogeveen2017), because most of the input values in the current study were based on data collected directly from dairy farmers. On the other hand, we extrapolated a single day measurement of SCM by means of the CMT test towards a whole year, which is an imprecise method to estimate failure costs due to SCM. Moreover, there might have been some double counting of total production due to CM losses because episodes of CM might have overlapped with SCM. However, since the production losses due to SCM are relatively small compared to the farmers’ reported production losses due to CM, this double counting is expected to be small.
The large contribution of SCM to the total failure costs of mastitis is caused by the high prevalence resulting from the generally chronic nature of SCM cases (Petrovski et al., Reference Petrovski, Trajcev and Buneski2006; Tolosa et al., Reference Tolosa, Verbeke, Piepers, Supré and De Vliegher2013). Ethiopian dairy farmers lack awareness about the existence of SCM, because there is no routine measurement of somatic cell count or any other parameters to monitor SCM (Mungube et al., Reference Mungube, Tenhagen, Regassa, Kyule, Shiferaw, Kassa and Baumann2005; Almaw et al., Reference Almaw, Zerihun and Asfaw2008; Tolosa et al., Reference Tolosa, Verbeke, Piepers, Supré and De Vliegher2013). In a situation where farmers are neither aware of the prevalence, nor of the economic consequences of SCM, it is unlikely that farmers will make efforts to prevent SCM. Therefore, counselling dairy farmers about the impacts of SCM and the potential profit of mastitis control measures, as well as training them by showing applications of mastitis prevention and management measures, is important to motivate a change in behaviour of dairy farmers to improve udder health (Lam et al., Reference Lam, Jansen, van den Borne, Renes and Hogeveen2011).
Failure costs of clinical mastitis
The total failure costs of CM, both per farm and per cow, estimated in our study were lower than failure costs of CM estimated by Getaneh et al. (Reference Getaneh, Mekonnen and Hogeveen2017). Differences between the previous and the current cost estimates can be explained by the differences in incidence of CM and duration of milk production losses between the current study and the study by Getaneh et al. (Reference Getaneh, Mekonnen and Hogeveen2017). The current estimates were based on farmers’ responses by recalling the number of cases of CM in the last year. Therefore, cases might have been missed due to recall bias. The estimates of Getaneh et al. (Reference Getaneh, Mekonnen and Hogeveen2017) were based on an incidence obtained from a previous study by Almaw et al. (Reference Almaw, Molla and Melaku2012) conducted in Ethiopia. Of the dairy farmers who experienced CM in the last year, 55% believed that, after clinical recovery, the milk production of a cow is equivalent to the milk production before CM. Based on this, we think that dairy farmers underestimated the duration of milk production losses due to CM. Milk production losses, however, contributed most to the total failure costs of CM. This underlines our finding that North-Western Ethiopian market-oriented dairy farmers underestimate failure costs of mastitis.
In conclusion, mastitis in North-Western Ethiopian market-oriented dairy farms was associated with higher failure costs than costs of mastitis previously reported for Ethiopian Holstein Friesian × Zebu breed cows’ farms. On average, farm-specific failure costs of mastitis were 1 961 ETB per lactating cow per year and showed large variation between farms. Relative to the milk returns per cow per year, these failure costs are high as compared to developed countries. Total failure costs of mastitis were mainly due to costs of milk production losses both for CM and SCM. Although a large proportion (54%) of the total failure costs of mastitis was due to SCM, Ethiopian dairy farmers seem to lack knowledge on the occurrence of SCM. This showed that mastitis and specifically SCM deserve more attention in livestock development extension service and in dairy health training programs.
Acknowledgements
We gratefully acknowledge the cooperation of the dairy farmers who participated in the study. Chekol Demis (Sheno Agricultural Research Center) and Solomon Tibebu (Wollo University, Ethiopia), Ethiopia, provided great support in the data collection. We are grateful to Dr. Wudu Temesgen (University of Gondar, Ethiopia) for translating the questionnaire from the local language (Amharic) back to English. Ato Teklu and Sisay (from Gondar artificial insemination service) deserve special appreciation for providing a list of dairy farms and helping us to identify more farms. This study was financially supported by the Netherlands organization for international cooperation in higher education (Nuffic), grant number: NFP-PhD.13/ 241.
Declaration of interest
The authors declare that they have no competing interests.
Ethics committee
For the questionnaire-based study described here, no formal approval by the Institutional Review Board of the University of Gondar or Utrecht University was required. Participating farmers were instructed about the content and goal of the questionnaire before the start of the interview (informed consent). All data were analyzed and reported anonymously.
Software and data repository resources
None
Supplementary material
To view supplementary material for this article, please visit https://doi.org/10.1017/S175173111900082X