Introduction
In recent years, prison and convict data have gained the attention of historical researchers. Prison sources have proven to be a valuable source because of the “panoptic” powers of the nineteenth-century criminal justice system (Inwood and Maxwell-Stewart Reference Inwood and Maxwell-Stewart2015: 161). At the same time, the complexity of prison populations complicates inference to the well-being of the broader population (Baten and Murray Reference Baten and Murray2000; Carson Reference Carson2011; Johnson and Nicholas Reference Johnson and Nicholas1995; Meredith and Oxley Reference Meredith and Oxley2015; Riggs Reference Riggs and Komlos1994). Anthropometric scholars typically acknowledge that prison samples are not representative of the wider population (Komlos Reference Komlos2004). This selectivity issue is not straightforward, however. All prison inmates are not alike, and various subsets may differ considerably. For example, occasional petty thieves may differ in important ways from those convicted of murder or other serious offences. Similarly, one-time offenders are not necessarily comparable to those with a history of multiple incarceration. The representativeness of prisoners thus remains a major concern for scholars who wish to use criminal justice data to infer information about wider populations.
Recidivism rates are a particular issue of concern as repeat offenders can account for a significant proportion of nineteenth-century prison populations (Fyson and Fenchel Reference Fyson and Fenchel2015: 172). Some institutions incarcerated large numbers of inmates for short periods implying that the trend in height (or anything else) is disproportionately influenced by a small, but recurrent, group of individuals. As this article demonstrates, this group is unlikely to be representative of the underlying prison population and even less likely to be representative of the general population.
Understanding the height profile of persistent offenders is crucial for anthropometric research based upon prison records. Ignoring recidivism for population-based research implies an overstatement of the importance of repeated offenders. At the same time, analysis of the heights of recidivists offers useful insights into differences among the imprisoned and helps us to understand underlying selection processes. In general, higher- and middle-class groups are strongly underrepresented in prison, as are the farmers and those from rural regions in general. The most prominent bias inherent in prison records is that the majority of inmates are drawn from the lower orders of society. Thus, prison populations contain a disproportionate number of the materially poorest individuals (Nicholas and Steckel Reference Nicholas and Steckel1991; Riggs Reference Riggs and Komlos1994). To understand the mechanisms behind this bias, scholars need to think about how individuals were selected into crime and therefore into prison. Bodenhorn et al. (2017; Reference Bodenhorn, Guinnane and Mroz2019: 1155) argue that these processes can be influenced by different economic conditions. Such factors might also lead to variations in the proportion of incarcerated repeat offenders, further complicating the assessment of selection bias.
Using a large sample of prison records from nineteenth-century Belgium, this article explores the extent to which recidivists can influence observed height trends. The first section discusses how repeat offenders have been treated in the anthropometric literature in recent years. The second section presents the Belgian prison data identifying the proportion of recidivists. Next, the prison data is compared to census data and the profile of the recidivists is compared to the overall prison population to determine whether these repeated offenders have specific characteristics. The main section of the article focusses on the implications of recidivists in prison samples for anthropometric research. A comparison of the height trend of recidivists and single-time offenders sheds light on selection biases in prison records.
Recidivism in the Anthropometric Literature
Prison records are useful for anthropometric analysis because they are widely available for nineteenth-century Western countries and have some important advantages over the more commonly used military records (Nicholas and Oxley Reference Nicholas and Oxley1993; O’Grada Reference O’Grada1991). There were, of course, no minimum height requirements for being convicted or incarcerated. Prisons housed women and children, which were sections of the population not represented in most military sources. It might also be argued, that as the marginalized are of particular interest in standard of living studies, their overrepresentation in jails and prisons could be construed as a virtue as long as this could be controlled for and measured.
Most anthropometric research with prison data examines the records of people charged with minor crimes, predominately theft. The extent of recidivism in this population has been contentious. Stephen Nicholas has argued that most inmates were first-time or single-time offenders and not members of a criminal proletariat. In his view, the British convicts transported to the Australian penal colonies were predominantly “ordinary working-class men and women who stole” (Nicholas Reference Nicholas1988). Others would contest this claim; historical criminologists have demonstrated the wide prevalence of recidivism and the significant effect of prior offending on later-life repeat offending (Gendrau et al. Reference Gendrau, Little and Goggin1996). This literature makes an important distinction between persistent and serious offending, two categories that are often confused in popular perceptions of criminals. Persistent offenders committed a large share of all crime, although they were rarely convicted of a major crime. Serious offenders, by contrast, were less likely to have a long previous record of convictions. Because of the more serious nature of these crimes, these men were likely to be tried in higher courts and sentenced to longer sentences. These were often served in national penitentiaries or resulted in sentences of transportation to penal colonies (Godfrey et al. Reference Godfrey, David and Farrall2007). Thus, while recidivism, or persistent offending, is a characteristic feature of most nineteenth-century prisons, it was especially prevalent in institutions that housed prisoners serving short sentences. In such local prisons, a substantial proportion of the detainees are likely to have been imprisoned on multiple occasions, some even within the same year (Fyson and Fenchel Reference Fyson and Fenchel2015: 170).
The inclusion of prisoners with multiple incarcerations may be a cause of selection bias, as O’Grada (Reference O’Grada1991) observed in his study of Irish prisoners. He found that while the majority of prisoners appeared to have been admitted only once, the opposite was true for sex workers. Unfortunately, while O’Grada highlighted the issue he did not reveal the strategy he employed for dealing with multiple convictions. Riggs (Reference Riggs and Komlos1994) may have been the first to check carefully for the extent of recidivism in Scottish prisons. He found that 86 percent of the prisoners were either first or second offenders, leading to the conclusion that the incarcerated population as a whole was “hardly a special criminal underclass” (ibid.: 65). More importantly, Riggs proposed two solutions for dealing with recidivists in anthropometric research. First, in his regression models, he controls for prisoners with multiple convictions by creating a dummy variable. Second, he only incorporated first and second offenders in his decade-by-decade reconstruction of mean heights. Luckily, some prison records include information on the previous incarceration history of individuals, allowing scholars to easily exclude subsequent imprisonments for an individual offender. Thus, in their study of Bavarian prisoners Baten and Murray (Reference Baten and Murray2000) were able to use such information to limit data collection to the first instance of imprisonment. In his study on female prison heights in the Netherlands, Hans de Beer (Reference de Beer2010) adopted a similar approach, while Tatarek (Reference Tatarek2006) addressed the issue by internally linking her sample to identify multiple entries for the same individual.
Most anthropometric studies, however, fail to mention whether the sample includes or excludes prisoners with multiple incarcerations, let alone include a discussion on how such cases were treated. Nicholas and Oxley (Reference Nicholas and Oxley1996), for instance, argue that data from the British Newgate prison support earlier findings derived from an analysis of records for convicts transported to Australia without considering the possibility that court processes might influence the selection of prisoners into these two institutions. It seems likely, however, that persistent offenders would be disproportionately directed through the gates of Newgate, while serious offenders would be awarded transportation sentences. This was something of a missed opportunity, as a comparison of both sources might yield important insights into differential selection into prison and transportation to the penal colonies.
Carson’s studies (Reference Carson2008, Reference Carson2009, Reference Carson2011) on racial and national height differences within nineteenth-century US prisons explore ways in which recidivism patterns might differ across black and white prisoner populations. The federal US prisons were more likely to incarcerate serious offenders and less likely to hold persistent offenders. Carson (Reference Carson2007) has also used prison data to study the heights of Chinese men that migrated to the United States. Morgan (Reference Morgan2009) did something similar based upon Australian prison registers. Morgan calculated the age of prisoners at first admission, revealing that part of his sample was indeed composed of those who had been imprisoned multiple times. While the importance of recidivism is increasingly being recognized, it can be difficult to establish the extent of multiple convictions, especially at the beginning and end of a record series because previous and future admissions are not known. Moreover, even a perfect record of life-course convictions will not necessarily reveal the extent of offending because individuals need to be arrested, convicted, and receive a custodial sentence before showing up in the data.
Some institutions not only collected the height of prisoners, but also their weight, allowing the reconstruction of historical BMI. The studies of Horrell, Meredith, and Oxley (Reference Horrell, Meredith and Oxley2009) and Meredith and Oxley (Reference Meredith and Oxley2015) reveal informative gendered differences linked to the allocation of household resources. The prison officials collected the weights of prisoners when they entered and when they were discharged, allowing researchers to study changes during imprisonment (Horrell et al. Reference Horrell, Meredith and Oxley2009: 108). For this specific situation, having multiple entries of the same prisoner may give researchers additional possibilities because weight change outside the prison walls could be measured by comparing subsequent incarcerations. These weight differences can be most revealing—providing information on the changing nutritional circumstances in the daily lives of prisoners.
The most rigorous discussion of recidivism in anthropometric prison samples can be found in the work of Inwood, Maxwell-Stewart, Oxley, and Stankovich (Reference Inwood, Maxwell-Stewart, Oxley and Stankovich2015). They include full figures of the number of convictions recorded for nineteenth-century Tasmanian offenders, showing about 77 percent of discharged prisoners were convicted just once. Some individuals, however, accumulated many convictions that led to an incarceration; many of the recidivists had more than 10 incarcerations. Notably this was more likely to be a female rather than male phenomenon. For those with multiple convictions, only the first offence was used for calculating average prison stature. The subsequent regression analysis revealed that Tasmanian recidivists were indeed on average shorter than their counterparts. Male recidivists born in different places were consistently shorter, although the size of the effect and the significance level varied. Based upon the same sources, Maxwell-Stewart, Cracknell, and Inwood (Reference Maxwell-Stewart, Cracknell and Inwood2015) confirmed a strong relationship between persistent offending and stature amongst male prisoners. Recidivist men and boys were on average shorter, but interestingly this was not the case for female prisoners.
So far little attention has been paid in the anthropometric literature to issues arising from the inclusion of persistent offenders. The few studies that consider multiple incarcerations for individual offenders suggest that these prisoners shared specific characteristics. As yet there has been no systematic investigation of the importance of recidivism for a number of issues, including the “industrial puzzle,” the phenomenon of apparently declining stature during the early stages of industrialization, It is possible that increasing admission rates for those with a history of multiple convictions might explain all or part of this phenomenon (Komlos and Coclanis Reference Komlos and Coclanis1997; Sunder Reference Sunder2004). In this article, I use a large sample of Belgian prisoners to explore the characteristics of recidivists and prepare for an assessment of the importance of recidivist-based selection to understandings of the industrial puzzle and other issues.
Belgian Prison Data
Belgian prison admission registers do not include information on previous convictions. It is therefore impossible to identify recidivists without internally linking entries to reconstitute the incarceration history of individual prisoners. This methodology resembles life-course analysis, based on linked samples of parish, population, or census records (Fyson and Fenchel Reference Fyson and Fenchel2015). In a first step, a data set was created consisting of 27,045 individual admissions to the Bruges and Ghent prisons for selected dates between 1832 and 1902.Footnote 1 As will be shown, this sampling method has consequences for the linkage of the records because not all admission years were included. The data was derived from admission registers in which prison officials kept a record of all newly arriving prisoners at the institution. These records contain information about date of admission, release date, name, one or more occupational titles, place of birth, and place of residence and the crime(s) for which each individual was convicted. A description of the prisoner was also taken, including their age, distinguishing physical characteristics, and height.
The “Code penal” of 1810 distinguished police, correctional, and criminal punishments and regulated the organization of prisoners. In general, police sentences were used for minor crimes; they never amounted to more than a few days imprisonment. More serious misbehavior was treated by the correctional courts that could pronounce sentences of up to five years. The criminal courts were reserved for crimes of a more serious nature; they could pronounce life imprisonment and the death penalty. In every judicial district, a prison was erected to receive those awarded police or correctional sentences. These prisons housed both the urban and rural convicts from within this judicial district. The vast majority of sentences did not exceed the length of one month. The revised “Code pénal” of 1867 limited the length of sentence a police court could award to seven days (Monballyu Reference Monballyu2006: 141–43), but this had a limited effect on admissions.
The prison of Ghent dates back to a correction house founded in 1773. During the nineteenth century, it had a double function: it was the institution for police and correctional sentences in the district of Ghent, and it was one of two central prisons in Belgium for convicts with long sentences (from all 14 judicial districts). Data for this article was collected from the admission register for the section of the prison housing those sentenced by police and correctional courts and from another prison in Bruges that also held men and women sentenced by the correctional court.Footnote 2
Records were linked to each other based on information about name, place of birth, sex, and age. Levenshtein distance (nearest string algorithm) was used to calculate matching scores for those with similar, but not identical names. Pairs of records with scores above 0.5 were examined individually to approve or reject a link based upon a comparison of all available information in the two records. Of course, this methodology offers no absolute certainty for the linked cases. Patterns of name commonality imply that prisoners with similar names from the same municipality may have been, in fact, different people. Equally, some positive matches may be overlooked because information was recorded inaccurately or prisoners were alternated in their use of French and Dutch names.
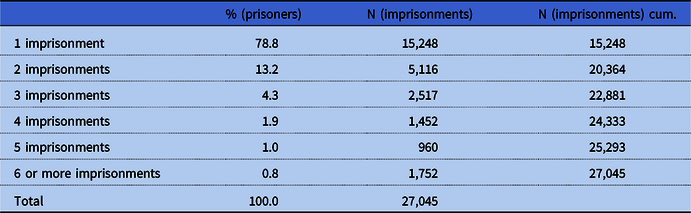
The results of this exercise show that recidivists in Belgian prisons account for 43 percent of all offenses and one fifth of all detainees. Table 1 displays the distribution of the prisoners according to the number of incarcerations in the sample. Most (78 percent) inmates could not be matched to another admission. This number is quite similar to that of Glasgow and Tasmanian prisons in the same period (Inwood et al. Reference Inwood, Maxwell-Stewart, Oxley and Stankovich2015: 192; Riggs Reference Riggs and Komlos1994: 64). Most Belgian recidivists appear twice in the data set, but a small number of prisoners had many more admissions. The top 1 percent had at least six convictions, but often many more.
Number of imprisonments for each individual prisoner (in percentage) and total number of observed imprisonments

As the data set used for this article is not a full transcription of all prisoners in Bruges and Ghent in the period 1832–1902, table 1 understates the proportion of incarcerated recidivists. An unknown, but probably significant, number of unobserved recidivists are present in the sample but cannot be identified because of an absence of information about their complete conviction history.Footnote 3 It is also likely that some individuals were imprisoned in another institution other than Bruges or Ghent over the course of their life span. A classification as nonrecidivist is therefore somewhat uncertain. The degree of recidivism in the Ghent and Bruges prisons, and difference between recidivists and nonrecidivists, must be regarded as lower-bound estimates.
Recidivists and Criminal Life Courses
Linking prison records allows us to get a closer look at the life courses of the individuals that were imprisoned multiple times. Arthur Haerinck, for instance, was born in the small municipality of Koolkerke and was incarcerated five times in the prison of Bruges between 1898 and 1902. During this time, the prison records offer some insight in Arthur’s life. At the age of 20, he lived in the Belgian coastal town of Heist where he worked as a navvy. He was arrested twice for violence and assault. By the age of 22, Arthur had moved to the small village of Lissewege where he was arrested twice, once for violence and once for making death threats. One year later, he had moved again to the city of Bruges where he was imprisoned after being convicted of petty theft. Other cases allow us to follow boys or girls during their childhood. Two young brothers from the rural village of Aartrijke, Charles and Jean Boucquez, were incarcerated in the prison of Bruges during their adolescence, often multiple times each year. Every one of these convictions was for poaching, suggesting that this illegal activity was their contribution to the household budget.
A prison population in general is, of course, rarely a representative sample of the total population. The elite, middle class, and farmers are strongly underrepresented. However, unskilled workers and other low-wage professions were often found disproportionally behind prison walls. Two different selection mechanisms largely explain this bias toward the poor social classes. First, low-wage workers have a higher chance of getting involved in criminal activities (Reiman Reference Reiman1996). In a simplified economic logic, individuals only end up in prisons when noncriminal life choices are less attractive than a criminal life path (Bodenhorn et al. Reference Bodenhorn, Guinnane and Mroz2017: 173). Second, the probability of getting arrested and convicted may differ by social group and also location. A higher probability of arrest in cities than in the countryside contributes to an underrepresentation of farmers and rural workers (Morris and Rothman Reference Morris and Rothman1995: 35).
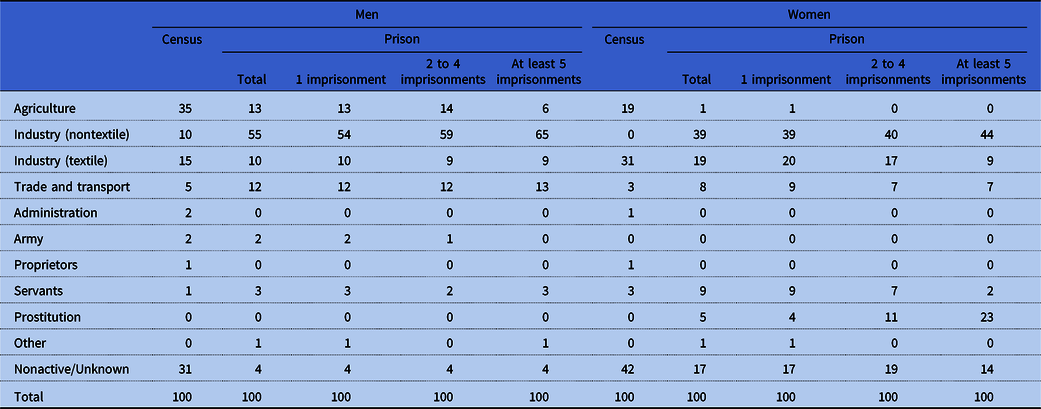
In table 2, I compare the occupational structure of the prison population with official census data. As expected, for both men and women the proportion of prisoners working in agriculture was lower than in the overall population. Most prisoners are recorded as working in the industrial sector (including the craftsmen). Given the historical importance of the textile industry in the area around Bruges and Ghent one might expect a large number of prisoners to report textile-related occupations. In fact, textile workers seem to be underrepresented in the prison sample, while nontextile occupations are heavily overrepresented. Some caution is appropriate here because many prisoners were described as worker (ouvrier) or day laborer (journalier) without any precision on what their occupation exactly was. Prison officials were seemingly not that interested in knowing exactly what a prisoner did in her or his daily life. Some of these workers could have been active in the textile industry, or could have had no job at all, but decided to call themselves worker or day laborer anyway. This could also explain the low proportion of unemployed prisoners. This number is somewhat higher for female prisoners compared to their male counterparts because this category also includes housewives. Apart from the industrial occupations, many prisoners also worked in the trade and transport industry. Again, this is not surprising. Merchants and drivers were highly mobile, had above average opportunities to engage in theft and other malefactions, and were possibly kept under closer surveillance by the police force. A final noteworthy finding is that prison records list 5 percent of the female prison population explicitly as sex workers. In the census, this occupational category does not exist.
Comparison between occupational structure for men and women (in percentage)

Census data: Census 1856, combined number for West and East Flanders, the provinces Bruges and Ghent are the capital of. Ghent University Quetelet Centre.
Prison data: Data set of prisoners from Bruges and Ghent. Bruges: State Archives Bruges (RAB), Prison Archive Bruges (SI Bruges 1999), Enrolment registers (inschrijvingsrollen), 1376–78, 1389–94, and 1418–23. Ghent: State Archives Ghent (RAG), Prison Archive Ghent (SI Ghent 1999), Enrolment registers (inschrijvingsrollen), 3486–87, 3517–20, and 3554–65.
The second issue illuminated by table 2 is if the profile and criminal life courses of a recidivist differed significantly from that of the prison population in general, or in other words, if known recidivists are unrepresentative of prisoners with their own distinct characteristics. For male prisoners, the specific features of a convict sample are reinforced for persistent offenders. The underrepresentation of farmers is even greater among offenders with more than five imprisonments. The more imprisonments were noted for an individual, the more likely these men were to be listed as industrial workers, the most common occupational group. This picture strengthens the idea that first-time offenders were, to a large extent, ordinary working men who stole or disturbed the peace, while persistent criminals comprised a distinct subset. For women, an even clearer shift in occupational pattern between one-time prisoners and recidivists can be observed. The high number of sex workers is especially noteworthy. Naturally, having a profession that in itself is punishable increases the likelihood of multiple incarcerations. Almost a quarter of female convicts with more than five imprisonments were sex workers. Frequently convicted women were clearly not a representative sample of the population, but on the contrary composed a specific subgroup.
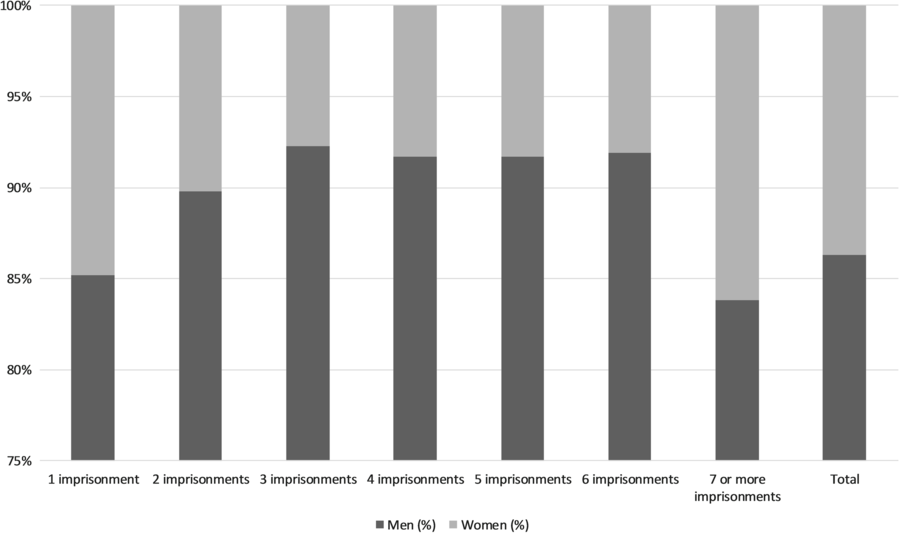
The occupational distribution highlights notable differences between the two sexes. Although a number of women were incarcerated in nineteenth-century prisons, the rate at which they were committed was less than the rate for men. Roughly 14 percent of the sample for Bruges and Ghent prisons were women.Footnote 4 Figure 1 shows the gender distribution of the prisoners in the sample by the number of imprisonments for each individual. Two opposing patterns can be observed. On the one hand, women were found less often among the persistent offenders. In particular, prisoners with three to five imprisonments in the data set were more than 90 percent male. On the other hand, the proportion of women increases with the number of imprisonments. An increased female presence among high recidivists was also found by Fyson and Fenchel (Reference Fyson and Fenchel2015). In their study of a Canadian prison two thirds of all those with 20 or more convictions were women, rising to three quarters among those with 50 or more imprisonments. These findings suggest that higher levels of recidivism amongst nineteenth-century prisoners skew heavily toward women. The Tasmanian data shows a similar pattern, with women initially less likely to be recidivists but showing up in greater numbers among the convicts with more than 10 imprisonments (Inwood et al. Reference Inwood, Maxwell-Stewart, Oxley and Stankovich2015: 192). A quarter of the highly recidivist women were sex workers. As prostitution was a punishable offence, multiple convictions were literally an occupational hazard for sex workers.
Distribution of men and women in the prison sample according to the number of observed imprisonments.

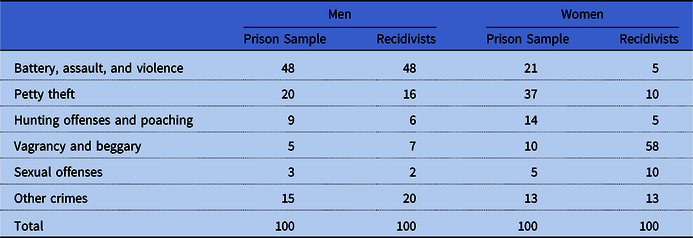
Differences in gender composition and occupational structure between criminals with multiple convictions and the general prison population reflects, in part, a different offending profile. Table 3 compares the overall distribution of offenses with the offenses of detainees with at least five imprisonments. There is little difference for the men; most prisoners were convicted for battery and assault or other minor acts of violence. Recidivists had fewer convictions for petty theft and somewhat more for other crimes that can be classified as disturbances of the peace, including public intoxication. By contrast, the convictions accumulated by female recidivists differed significantly from the general prison sample. Women with at least five convictions were mainly arrested for beggary and prostitution. Repeated incarcerations failed to break this pattern of offending suggesting that these women lacked either the capacity or a desire to alter their lives. These findings are supported by other studies. Piper and Nagy (Reference Piper and Nagy2017: 201) report that female Australian recidivists were mostly found guilty of public order offenses, although women convicted for drunkenness, vagrancy, and prostitution had higher rates of recidivism rate as well. Piper and Nagy ascribe this pattern to substance abuse, homelessness, and sex work, all risk factors associated with persistent offending.
Distribution of the crimes for which male and female prisoners were convicted, total prison sample Bruges and Ghent compared to prisoners with at least five imprisonments (in percentage)

Clearly, the recidivists are a specific subset of the prison population. Prisoners appearing two to five times in the data set were predominately male, low-skilled wage laborers, convicted for acts of minor violence, petty theft, or disturbance of the peace. This observation fits with the economic selection mechanism described by Bodenhorn et al. (Reference Bodenhorn, Guinnane and Mroz2017: 173). If individuals are more likely to be involved in crime because criminal opportunities are more attractive than noncriminal activities in a simple model of risk and reward, they are also more likely to engage repeatedly in crime and become recidivists. The selection bias introduced by this mechanism will therefore be more pronounced among repeated offenders than among one-time offenders. For the smaller group of criminal women, other mechanisms were at play, as differences between female single offenders and those convicted on multiple occasions were more pronounced. Women were more likely to be found amongst those with high number of imprisonments. Poor unskilled women arrested in the larger cities for beggary, sex work, or offences directly related to sex work dominate this portion of the sample. The simple risk and reward model of Bodenhorn et al. seems less applicable to this group of female offenders. Different selection mechanisms for male and female prisoners may influence the gender difference in height observed among prisoners.
Recidivists and Heights
Differences between persistent offenders and other prisoners are relevant to anthropometric analysis because a small but recurrent group of individuals will have disproportionate influence on the observed patterns of stature. It has been argued that short people had fewer opportunities in the legal labor market and therefore were more likely to turn to illegal activities (Bodenhorn et al. Reference Bodenhorn, Moehling and Price2010). If this is true, one might expect that this pattern is even stronger among recidivists than among one-time offenders. The assumption is thus that the inclusion of recidivist prisoners in a height sample will bias the average height downward (Inwood et al. Reference Inwood, Maxwell-Stewart, Oxley and Stankovich2015).
Among Belgian prisoners, the average height of adult men with only one imprisonment was 167.5 cm.Footnote 5 Prisoners appearing multiple times averaged 167.2 cm.Footnote 6 The difference is statistically significant (p = 0.03) on a difference of means test. For women, a different picture arises. On average, adult women with one imprisonment in the data set measured 158.2 cm, while their counterparts imprisoned multiple times averaged 159.2 cm. This difference is larger than for men, but more importantly works in the other direction. Women that were sent to prison more often, were more likely to be taller. The t-test shows this difference to be statistically significant (p = 0.02). This result is consistent with Riggs’s (Reference Riggs and Komlos1994: 66) report of Scottish prisoners; the men incarcerated more than once were 0.3 inch shorter but female recidivists were 0.1 inch taller than other female prisoners. A similar pattern is visible among Tasmanian prisoners (Maxwell-Stewart et al. Reference Maxwell-Stewart, Cracknell and Inwood2015). The immediate consequence of this finding is clear. The inclusion of multiple incarcerations for the same individual will influence the apparent pattern of prison heights. This effect is larger for women and works in the opposite direction than that observed for men. This complicates any inference from a comparison of male and female heights.
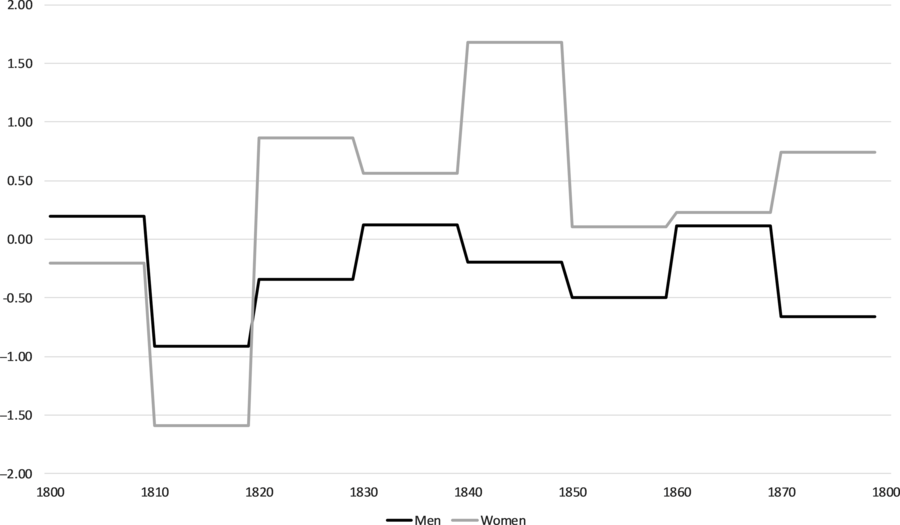
It is useful to consider if any of these patterns changed over time. Figure 2 shows the difference between the average stature of the prisoners that were found once in the sample and those with multiple incarcerations, grouped by decennial birth cohorts. The differentials are more or less constant. Persistent male offenders were mostly shorter by as much as 0.5 cm, while recidivist women were on average between 0.5 and 1 cm taller. Women born in the 1810s were an exception to this pattern as they were shorter than the average imprisoned woman, although the sample size for the earlier birth cohorts is small.
Difference between average stature for recidivists compared to once-off offenders, Ghent and Bruges prison, 1800–80. Periodic average. Prisoners sorted by birth cohort.

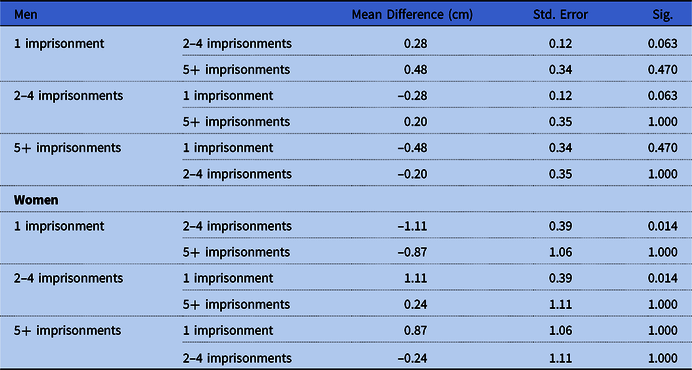
If selection is driving the differences between persistent offenders and the overall prison population, it is likely that the effect of the number of imprisonments on heights is more pronounced for those with a larger number of incarcerations. If male and female prisoners form a specific subset of the population, these biases are further exaggerated among recidivists. A now familiar pattern emerges from the ANOVA analysis reported in table 4. For men, recidivists with two to four sentences were on average 0.3 cm shorter, while those with at least five imprisonments were on average 0.5 cm shorter. While the pattern of shorter recidivist men intensifies when looking at persons with more than five imprisonments, this is not the case for women. Female recidivists with two to four sentences were on average 1.1 cm taller, and those with at least five imprisonments were 0.9 taller. For both men and women, the differential for recidivists with a large number of incarcerations is not statistically significant.
ANOVA analysis on height differences according to number of imprisonments

Is this recidivist effect simply a component of differences in occupational structure demonstrated in the previous section? A regression model can test the influence of the number of imprisonments on height while controlling for the underlying occupational structure. Table 5 shows the results, which again confirm differences men and women. Controlling for occupation, men with two to four imprisonments were on average 0.2 cm shorter and those with at least five imprisonments were 0.5 cm shorter. For women, the effects point in the other direction. None of these effects are significant, but the pattern of coefficients is nonetheless informative. Differences between the professional groups are also evident. Compared to the reference category of men working in the industrial nontextile sector, men working in agricultural professions were on average taller. The height advantage of farmers can be attributed to easier access to food supplies during childhood (including dairy products), the larger distance from unhealthy urban disease environments, and the more frequent exposure to sunlight and therefore increased production of vitamin D (Carson Reference Carson2009). Interestingly, prisoners that were active in the trade and transport sector were also notably taller. Individuals in two occupational groups were shorter: those who were unemployed or had no known occupation and those working in the textile industry, a sector that came under severe pressure in Belgium during the nineteenth century. For women, similar positive effects are found for those working in agriculture, trade, and transport, as well as for servants. Sex workers clearly stand out, being on average more than 3 cm taller than women working in the industrial sector. Lastly, prisoners born in coastal Flanders were on average shorter than inmates born in inland Flanders (Depauw Reference Depauw2017: 78).
Regression model (OLS) on height (cm)

Note: Omitted categories: one imprisonment, born 1860–79, industry (nontextile), and Bruges prison. Significance levels: *P < 0.05; **P < 0.01; ***P < 0.001.
The regression results reflect the operation of selection in the prison sample. Prisoners were likely to be shorter because most individuals will only opt for criminal activities when noncriminal opportunities are less attractive (Bodenhorn et al. Reference Bodenhorn, Guinnane and Mroz2017: 196). This economic model of risk and reward can also explain why male recidivists are on average shorter than single-time offenders. For women, however, different mechanisms are needed to explain greater stature for recidivists. The inclusion of multiple entries for recidivists imparts a downward bias to average male stature, conveys an upward bias to female stature, and suppresses the observed gender difference. Thus, the profile and prevalence of female recidivists is an important dimension of anthropometric analysis. Sex workers, in particular, stand out (O’Grada Reference O’Grada1991). In the Belgian prisons they are disproportionately found amongst those with the most incarcerations; they were significantly taller (t = 3.7 cm, p = 0.00).
Explaining the distinctiveness of girls and young women in sex work is a challenge. They were not necessarily driven by vulnerability (Mechant Reference Mechant, Devos, Koen and Van de Putte2014). The choice of profession could well have been a conscious life choice in which taller women benefitted from their height. One complication is that police could arrest any woman under suspicion of indecency, but sex workers from the lower social classes were more likely to be arrested (Altink Reference Altink1983: 147). Another potential influence is that sex workers were measured shortly after their arrest while still wearing high heels. Comparisons between the different measurements of the same individual show that imprecise measurement by prison officials cannot be excluded.
Conclusion
Prison registers are a fruitful source of height data for past populations. They are widely available and give a snapshot of individuals otherwise often excluded from social analysis. Nevertheless, selection mechanisms influencing the composition of the sample need to be recognized. It has been argued that individuals will only engage in criminal activities when legal opportunities are scarce or unattractive. Indeed, each step of the criminal and criminal justice processes have their own selection logic, leading ultimately to the well-known predominance of unskilled and low-skilled men and women in jails and prisons. In addition, there were differences between single-time offenders and a criminal proletariat that experienced repeated incarceration. Recidivism was a major concern for nineteenth-century prison officials. It was one of the reasons authorities kept such extensive prison records.
In the case of Belgium, more than 40 percent of appearances in the Bruges and Ghent prisons are known to identify a repeat offender. The nature of sample construction implies that this figure understates the true extent of recidivism. More importantly, recidivists formed a specific subset of the prison population with distinct characteristics. The comparison between recidivists and nonrecidivists points to selection mechanisms inherent in prison data. Among men, recidivists were broadly similar to other prisoners although more likely to be low-wage workers incarcerated for minor acts of violence or misconduct. The inclusion of male recidivists thus reinforces a bias toward the poorest groups of society. Among women, recidivists differed more extensively from other prisoners. Two groups were strongly represented among women with at least five imprisonments in the data set: sex workers and poor low-skilled workers arrested for begging. For men, recidivists in Belgium, as elsewhere, were shorter than the average prisoner (and especially so for multiple recidivists). Female recidivists, in contrast, were taller than one-time offenders. This result is at least partially driven by the inclusion of sex workers who were more likely to have multiple convictions and to be significantly taller. The inclusion of sex workers in the prison sample clearly follows a different selection mechanism, which invites further special attention.
The difference in average height between recidivists and nonrecidivists has important implications for anthropometric methodology. First, it questions the validity of any comparison between institutions with first-time offenders and institutions with a large number of recidivists. Second, it reinforces the necessity of counting recidivists only once in an estimation of average stature. Alternately, recidivist entries might be weighted by the inverse of the number of their appearances, or control variables might be introduced into regression models to ensure that variability in the proportion of first time and multiple convictions does not influence the measures used for interpretation. Third, recidivism distorts estimates of the gender differential in stature, perhaps the single most important contribution of prison records to the anthropometric field. Finally, the influence of recidivism reminds us that adult stature is a rather imprecise measure of well-being, in part because the sources are often subject to selection bias that requires careful exploration before findings can be extrapolated to a wider population.
Acknowledgments
This paper was earlier presented at the Social Science History Association Conference in Chicago in 2016, the European Historical Economic Society Conference in Tübingen in 2017, and an Economic History PhD Student Seminar in Barcelona in 2019. I am grateful for the comments made at those meetings as well for the remarks of Isabelle Devos, Kris Inwood, Ramon Ramon Munoz, Deborah Oxley, Hamish Maxwell-Stewart, the colleagues at Ghent University, and the two anonymous readers.