1 Introduction
There is a wide range of environmental processes and industrial applications that involve suspensions of particles settling under gravity. Among these we recall the pollutant transport in underground water, soot particle dispersion, fluidized beds and the settling of micro-organisms such as plankton, rain droplets and snow.
Often, these applications involve a large number of particles settling in quiescent fluids and despite the large number of studies on the topic, the understanding of this complex phenomenon is still far from clear. Sedimentation depends indeed on a wide range of parameters. Particles may differ in density, shape, size and stiffness, and real suspensions are hardly monodispersed. In the present work, we focus on the effects due to particle shape. In particular, we consider suspensions of buoyant oblate particles of fixed aspect ratio (
 $AR=1/3$
), and show how particle orientation leads to different dynamics and microstructures in comparison to the ideal case of spherical particles.
If we limit our attention to the case of an isolated rigid sphere, it is known that the settling speed depends on the solid-to-fluid density ratio,
 $R$
, and the Galileo number
 $Ga$
, namely the ratio between buoyancy and viscous forces acting on the particle. Even in this two-parameter space a variety of particle path regimes are encountered, involving vertical, oblique, time-periodic oscillating, zig-zagging, helical and chaotic motion as shown numerically and experimentally by Jenny, Dušek & Bouchet (Reference Jenny, Dušek and Bouchet2004), Horowitz & Williamson (Reference Horowitz and Williamson2010). The a priori estimation of the particle terminal falling velocity,
 $V_{t}$
is also non-trivial. With the assumption of Stokes flow in an unbounded quiescent fluid, it is found that the Stokes terminal velocity
 $V_{s}$
is function of the sphere radius,
 $a$
, the density ratio,
 $R$
, the magnitude of the gravitational acceleration
 $g$
and the kinematic viscosity of the fluid
 $\unicode[STIX]{x1D708}$
(Guazzelli & Morris Reference Guazzelli and Morris2011). However, when the Reynolds number of the settling particle (
 $Re_{t}=V_{t}d/\unicode[STIX]{x1D708}$
) becomes finite, the fore–aft symmetry of the fluid flow around the particle is broken leading to the generation of a rear wake. As previously mentioned, the terminal speed depends on
 $R$
and more pronouncedly on
 $Ga$
, but no theoretical formula that relates these quantities exists. Up to date, only formulae that make use of empirical relations for the drag coefficient of an isolated sphere,
 $C_{D}$
, are available (Schiller & Naumann Reference Schiller and Naumann1935; Clift, Grace & Weber Reference Clift, Grace and Weber2005; Yin & Koch Reference Yin and Koch2007). However, these formulae relate only the terminal Reynolds number
 $Re_{t}$
to the Galileo number
 $Ga$
, neglecting the dependence on the density ratio
 $R$
.
When particle suspensions are considered, the scenario is further complicated by hydrodynamic and particle–particle interactions. A most relevant effect occur when a sphere is entrained in the wake of another particle of comparable size settling at finite
 $Re_{t}$
, as the particle behind will accelerate towards the leading particle. The particles will hence touch and finally the rear particle will tumble laterally. This phenomenon is denoted as drafting–kissing–tumbling of a particle pair (Fortes, Joseph & Lundgren Reference Fortes, Joseph and Lundgren1987); during the draft phase the rear particle reaches speeds larger than the terminal velocity
 $V_{t}$
. The extent of the increase of the rear particle speed with respect to
 $V_{t}$
depends on
 $Ga$
.
Generally speaking, the mean settling speed of a suspension of particles,
 $\langle V_{z}\rangle$
, is also a function of the solid volume fraction
 $\unicode[STIX]{x1D719}$
. For very dilute suspensions under the assumption of Stokes flow, Hasimoto (Reference Hasimoto1959) and later Sangani & Acrivos (Reference Sangani and Acrivos1982) obtained expressions for the drag force exerted by the fluid on three different cubic arrays of settling spheres. A different expression was instead found by Batchelor (Reference Batchelor1972) who used a different approach based on conditional probability arguments. All these formulae relate the mean settling speed directly to the solid volume fraction
 $\unicode[STIX]{x1D719}$
but are unable to properly predict
 $\langle V_{z}\rangle$
for semi-dilute and dense suspensions. For such suspensions, the empirical formula proposed by Richardson & Zaki (Reference Richardson and Zaki1954a
,Reference Richardson and Zaki
b
) is probably the most used. This was obtained from experimental results on both sedimentation and fluidization, and relates the mean settling speed normalized by the terminal velocity to the solid volume fraction
 $\unicode[STIX]{x1D719}$
, via a power law. More specifically, the mean settling speed of the suspension
 $\langle V_{z}\rangle$
is a decreasing function of
 $\unicode[STIX]{x1D719}$
and is always smaller than
 $V_{s}$
. This formula has been shown to be accurate also for concentrated suspensions and for low Reynolds numbers
 $Re_{t}$
. A wide number of more recent studies have been devoted to the improvement of this empirical formula to account for larger
 $Re_{t}$
. Among these we recall the experimental studies by Garside & Al-Dibouni (Reference Garside and Al-Dibouni1977), Di Felice (Reference Di Felice1999) and the numerical study by Yin & Koch (Reference Yin and Koch2007). These authors showed that the power-law exponent is a nonlinear function of the Reynolds number
 $Re_{t}$
, and that a correction coefficient should be introduced.
The mean settling speed
 $\langle V_{z}\rangle$
decreases with
 $\unicode[STIX]{x1D719}$
due to the hindrance effect (Climent & Maxey Reference Climent and Maxey2003; Guazzelli & Morris Reference Guazzelli and Morris2011). In a batch sedimentation system, the fixed bottom of the container forces the fluid to move in the opposite direction such that the flux of the particle–fluid mixture remains zero. Hindrance becomes more pronounced as the volume fraction
 $\unicode[STIX]{x1D719}$
increases, leading a monotonic decrease of
 $\langle V_{z}\rangle$
with respect to
 $V_{t}$
. At large
 $Re_{t}$
, however, the suspension behaviour is further complicated by the particle–particle hydrodynamic interactions. In our previous work, we have studied semi-dilute suspensions (
 $\unicode[STIX]{x1D719}=0.5{-}1\,\%$
) of spheres with density ratio
 $R=1.02$
and
 $Ga=145$
(Fornari, Picano & Brandt Reference Fornari, Picano and Brandt2016a
) and have found that drafting–kissing–tumbling events are indeed frequent, with the involved particles reaching speeds more than twice the mean
 $\langle V_{z}\rangle$
. It was estimated that without these intermittent events the mean settling speed,
 $\langle V_{z}\rangle$
, would be smaller by approximately
 $3\,\%$
.
For suspensions of spheres with
 $\unicode[STIX]{x1D719}=0.5\,\%$
,
 $R=1.5$
and a larger value
 $Ga=178$
, Uhlmann & Doychev (Reference Uhlmann and Doychev2014) found that particle clusters form. These clusters settle faster than
 $V_{t}$
and as a result, the mean settling speed
 $\langle V_{z}\rangle$
increases by
 $12\,\%$
with respect to the terminal speed of an isolated particle,
 $V_{t}$
. The formation of clusters is related to the steady oblique motion observed for isolated spheres with
 $R=1.5$
and
 $Ga=178$
. Indeed, at a lower
 $Ga=121$
, for which an isolated sphere exhibits a steady vertical motion, no clustering is observed. An increased mean settling speed at large
 $Ga$
was also observed by Zaidi, Tsuji & Tanaka (Reference Zaidi, Tsuji and Tanaka2014), Fornari et al. (Reference Fornari, Picano, Sardina and Brandt2016b
). Recently, these results were also confirmed experimentally by Huisman et al. (Reference Huisman, Barois, Bourgoin, Chouippe, Doychev, Huck, Morales, Uhlmann and Volk2016) who also observed the formation of a columnar structure of spheres at high
 $Ga$
.
In the past few years, numerical investigations were also devoted to the study of the sedimentation of suspensions of finite-size spheres in stratified environments (Doostmohammadi & Ardekani Reference Doostmohammadi and Ardekani2015), in homogeneous isotropic (Chouippe & Uhlmann Reference Chouippe and Uhlmann2015; Fornari et al. Reference Fornari, Picano and Brandt2016a ,Reference Fornari, Picano, Sardina and Brandt b ) and shear turbulence (Tanaka & Teramoto Reference Tanaka and Teramoto2015). The case of finite-size spherical bubbles rising in vertical turbulent channel flow has been considered by Santarelli & Fröhlich (Reference Santarelli and Fröhlich2015, Reference Santarelli and Fröhlich2016).
When considering non-spherical particles, the sedimentation process is further complicated as the particle orientation plays a role in the dynamics. Feng, Hu & Joseph (Reference Feng, Hu and Joseph1994) performed two-dimensional numerical simulations of settling elliptic particles to show that in stable conditions an elliptic particle always falls with its long axis perpendicular to gravity. Three-dimensional oblates settling in steady motion at low
 $Re_{t}$
also display the symmetry axis in the gravity direction. However, increasing
 $R$
or
 $Ga$
the system becomes unstable and disc-like particles are observed to oscillate horizontally. As explained by Magnaudet & Mougin (Reference Magnaudet and Mougin2007), Ern et al. (Reference Ern, Risso, Fabre and Magnaudet2012), the path instability of spheroidal particles is closely related to their wake instability. Indeed, the release of vortices in the wake of a spheroidal particle is modified as soon as the angle between the particle symmetry axis and the velocity direction is changed. Therefore, the ensuing wake instability is also strongly related to the particle aspect ratio
 $AR$
. A complete parametric study on disc-shaped cylinders and oblates with different aspect and density ratios falling under gravity was performed by Chrust (Reference Chrust2012).
Recently we extended the immersed boundary method (IBM) of Breugem (Reference Breugem2012) to account for ellipsoidal particles (Ardekani et al.
Reference Ardekani, Costa, Breugem and Brandt2016). We have shown that above a threshold
 $Ga$
, oblate particles perform a zig-zagging motion whereas prolate particles rotate around the vertical axis with their broad side facing the falling direction. The threshold
 $Ga$
is shown to decrease as the aspect ratio departs from
 $1$
. Particle-pair interactions were also studied. It has been found that the drafting–kissing–tumbling is modified with respect to the case of settling spheres. In particular, for two oblate particles with
 $AR=1/3$
and
 $Ga=80$
, the tumbling part is suppressed and the particles fall together with a mean speed that is substantially larger than
 $V_{t}$
. Also, spheroidal particles are attracted in the wake of a leading particle from larger lateral distances than in the case of spheres. The absence of the tumbling phase was also found experimentally for pairs of falling disks with
 $AR=1/6$
by Brosse & Ern (Reference Brosse and Ern2011).
Much less is known about the sedimentation of suspensions of spheroidal particles. In their pioneering study Fonseca & Herrmann (Reference Fonseca and Herrmann2005) studied numerically the settling of suspensions of oblate ellipsoids with
 $AR\simeq 0.27$
and
 $R=4$
at relatively low Reynolds numbers,
 $Re_{t}=0.04$
and
 $7$
. Volume fractions up to
 $\unicode[STIX]{x1D719}\sim 0.2$
were considered. At the smallest
 $Re_{t}$
, these authors found a local maxima of the mean settling speed
 $\langle V_{z}\rangle$
at
 $\unicode[STIX]{x1D719}=0.05$
, that is however smaller than the settling speed of an isolated oblate,
 $V_{t}$
. On the other hand, at
 $Re_{t}=7$
it was found that
 $\langle V_{z}\rangle \simeq 1.1V_{t}$
for
 $\unicode[STIX]{x1D719}\sim 1\,\%$
. Several studies concerned instead the settling of non-spherical particles at small or zero Reynolds numbers. Among those, Saintillan, Shaqfeh & Darve (Reference Saintillan, Shaqfeh and Darve2006) studied numerically the settling of elongated fibres (
 $AR=15$
) and found that in the creeping flow regime streamers of particles are formed. In these streamers, particles are mostly oriented in the direction of gravity and settle substantially faster than isolated fibres. The authors also briefly reported results for the sedimentation of dilute suspensions of oblate particles. Oblates are also found to settle faster than isolated particles, with the orientation vector of the major axis that points mostly in the horizontal direction. In this creeping flow regime, the formation of streamers is due to the fact that particles tend to migrate laterally towards regions of higher particle density. However, for suspensions of prolates (
 $AR=5$
) at small but finite
 $Re_{t}=0.3$
, Kuusela, Höfler & Schwarzer (Reference Kuusela, Höfler and Schwarzer2001) showed that the particles tend to align horizontally due to inertia. As a consequence the sedimentation speed is reduced as compared to Stokes flow. Similar observations were later made for suspensions of elongated fibres with
 $Re_{t}$
up to
 ${\sim}10$
(Shin, Koch & Subramanian Reference Shin, Koch and Subramanian2009). To the best of our knowledge the sedimentation in suspensions of oblate particles at finite inertia has not been examined before.
In the present study, we investigate the sedimentation of semi-dilute suspensions of oblate particles at finite Reynolds number
 $Re_{t}$
. In particular, we consider particles with aspect ratio
 $AR=1/3$
, density ratio
 $R=1.02$
and Galileo number (based on the diameter of a sphere with an equivalent volume)
 $Ga=60$
. With this choice of parameters, a single oblate falls steadily with its broad side perpendicular to gravity and with a terminal Reynolds number of approximately
 $40$
. Four solid volume fractions of
 $\unicode[STIX]{x1D719}=0.5\,\%,1\,\%,5\,\%$
and
 $10\,\%$
are studied. We find that differently from spheres of equal
 $Ga$
, the mean settling speed of the suspension,
 $\langle V_{z}\rangle$
, first increases with
 $\unicode[STIX]{x1D719}$
, and is therefore larger than the terminal velocity of a single particle,
 $V_{t}$
. The mean settling speed decreases for
 $\unicode[STIX]{x1D719}>0.5\,\%$
and becomes smaller than
 $V_{t}$
between
 $\unicode[STIX]{x1D719}=5\,\%$
and
 $10\,\%$
. In this range of
 $\unicode[STIX]{x1D719}$
, a power-law fit similar to that by Richardson & Zaki (Reference Richardson and Zaki1954b
) is proposed. We then show that the enhancement of
 $\langle V_{z}\rangle /V_{t}$
at low
 $\unicode[STIX]{x1D719}$
is related to the formation of a columnar structure of particles. Within this structure, intense particle clustering is observed. For
 $\unicode[STIX]{x1D719}=0.5{-}1\,\%$
, the particle-pair distribution function is found to be high in the range
 $r\in [2c,6c]$
and between
 $\unicode[STIX]{x1D713}\simeq 2^{\circ }{-}80^{\circ }$
, with maximum values at
 $r=2.02c$
and
 $\unicode[STIX]{x1D713}=17^{\circ }{-}10^{\circ }$
(with
 $c$
the polar radius of the oblate and
 $\unicode[STIX]{x1D713}$
the polar angle with respect to the direction of gravity). Hence, particles are almost vertically piled up at low
 $\unicode[STIX]{x1D719}$
as also shown by the order parameter. At higher
 $\unicode[STIX]{x1D719}$
the amount of clustering is reduced. We also show that the mean particle orientation (computed as the cosine of the angle between the particle symmetry axis and gravity) decreases with
 $\unicode[STIX]{x1D719}$
. A power-law fit in terms of
 $\unicode[STIX]{x1D719}$
is also proposed. The particle mean pitch angle with respect to the horizontal plane increases with
 $\unicode[STIX]{x1D719}$
, from
 $22.8^{\circ }$
(
 $\unicode[STIX]{x1D719}=0.5\,\%$
) to
 $47^{\circ }$
(
 $\unicode[STIX]{x1D719}=10\,\%$
). It should be noted that for an isolated oblate with
 $Ga=60$
and
 $R=1.02$
the pitch angle is
 $0^{\circ }$
. Finally, we calculate joint probability functions of settling speeds
 $V_{z}$
and orientation
 $|O_{z}|$
. By means of conditioned averages we show that particles settling with larger speeds than the mean,
 $\langle V_{z}\rangle /V_{t}$
, settle on average with higher pitch angles. Before concluding, we report results from an additional simulation with
 $\unicode[STIX]{x1D719}=0.5\,\%$
and
 $Ga=140$
. At this
 $Ga$
, isolated oblates settle with a periodic oscillation around a mean vertical path and we therefore investigate whether this different settling behaviour leads to a different collective dynamics. We find that the mean settling speed,
 $\langle V_{z}\rangle /V_{t}$
, is very close to that for
 $Ga=60$
, although at the largest
 $Ga$
there are less velocity fluctuations around the mean. On the contrary, almost identical statistics are found for the velocity component perpendicular to gravity. Finally, we find that at the largest
 $Ga$
, particle pairs tend to be even more vertically aligned with respect to the case at
 $Ga=60$
.
2 Set-up and methodology
The sedimentation of semi-dilute suspensions of oblate particles is considered in a computational domain with periodic boundary conditions in the
 $x$
,
 $y$
and
 $z$
directions for both the fluid and the particles, with gravity acting in the positive
 $z$
direction. Oblates with aspect ratio
 $AR=1/3$
are considered. We name
 $b$
and
 $c$
the equatorial and polar radii of the ellipsoid. The computational box has size
 $20d\times 20d\times 160d$
, with
 $d$
the diameter of a sphere with the same volume as the ellipsoidal particle. Four solid volume fractions are investigated,
 $\unicode[STIX]{x1D719}=0.5\,\%,1\,\%,5\,\%$
and
 $10\,\%$
. These correspond to
 $611$
,
 $1222$
,
 $6111$
and
 $12\,222$
particles. Oblates are initially randomly distributed in the computational domain with zero angular and translational velocity, and with their orientation vector
 $[O_{x},Oy,Oz]=[0,0,1]$
. Hence, their broad side is perpendicular to gravity and the pitch angle (defined between their symmetry axis and gravity) is
 $0^{\circ }$
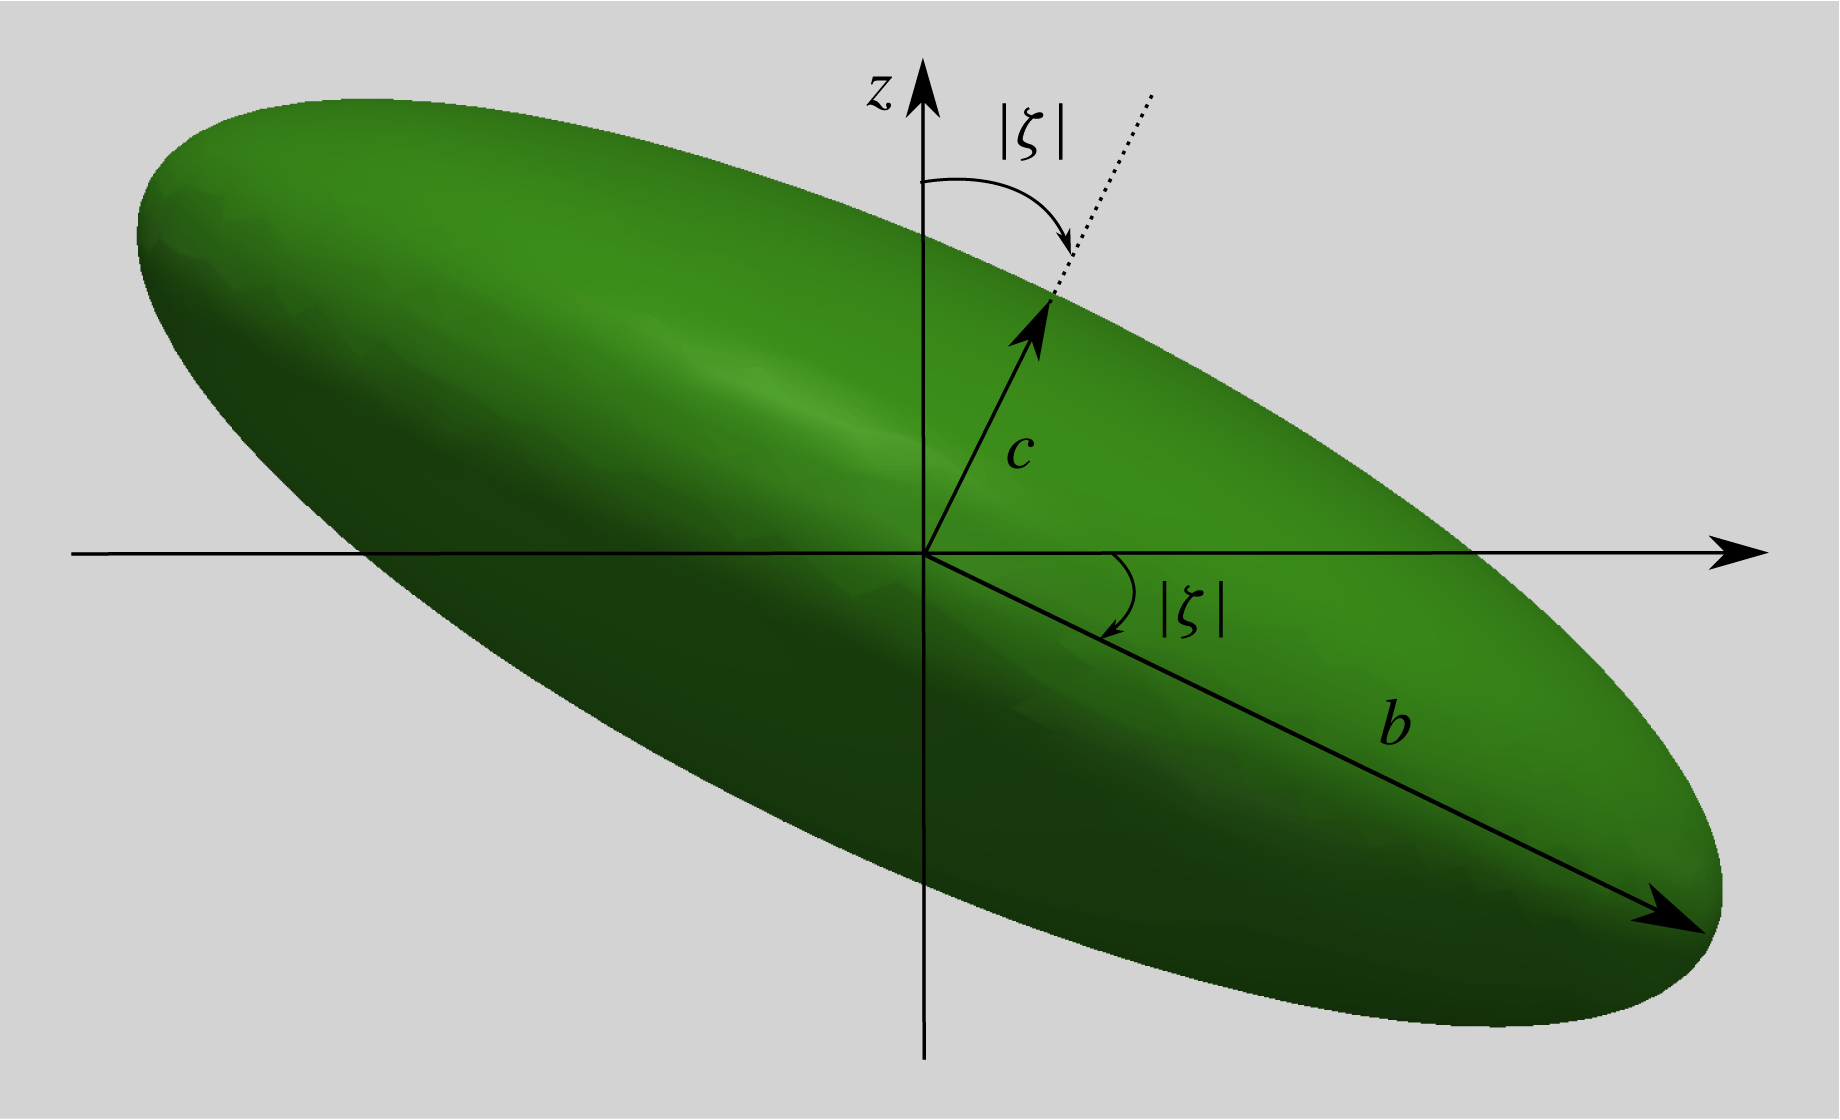
. Note that this angle is equal to the angle between the plane defined by the equatorial radius
 $b$
and the (horizontal)
 $xy$
plane, as shown in figure 1. Therefore we name it as pitch angle (i.e. when the pitch angle is larger than zero, the spheroid is inclined with respect to the horizontal plane). For comparisons, the case of an isolated oblate is also simulated as reference.
We consider non-Brownian rigid oblate particles slightly heavier than the suspending fluid with density ratio
 $R=1.02$
and Galileo number (based on the diameter
 $d$
of the equivalent sphere)
 $$\begin{eqnarray}\displaystyle Ga=\frac{\sqrt{(R-1)gd^{3}}}{\unicode[STIX]{x1D708}}=60. & & \displaystyle\end{eqnarray}$$
As previously mentioned, this non-dimensional number quantifies the importance of the gravitational forces acting on the particle with respect to viscous forces. At this
 $Ga$
isolated spheres and oblates settle vertically with steady wakes. The Reynolds number based on the terminal falling speed of a single oblate is found to be
 $Re_{t}=38.7$
.
Definition of the equatorial and polar radii,
 $b$
and
 $c$
, and of the pitch angle
 $|\unicode[STIX]{x1D701}|$
.

The simulations have been performed using the version of the immersed boundary method developed by Breugem (Reference Breugem2012) and modified by Ardekani et al. (Reference Ardekani, Costa, Breugem and Brandt2016) to account for ellipsoidal particles. With this approach, the coupling between the fluid and solid phases is fully modelled. The flow is evolved according to the incompressible Navier–Stokes equations, whereas the particle motion is governed by the Newton–Euler–Lagrangian equations for the particle centroid linear and angular velocities
 $$\begin{eqnarray}\displaystyle & \displaystyle \unicode[STIX]{x1D70C}_{p}V_{p}\frac{\text{d}\boldsymbol{u}_{p}}{\text{d}t}=\oint _{\unicode[STIX]{x2202}{\mathcal{V}}_{p}}\unicode[STIX]{x1D749}\boldsymbol{\cdot }\boldsymbol{n}\,\text{d}S+(\unicode[STIX]{x1D70C}_{p}-\unicode[STIX]{x1D70C}_{f})V_{p}\boldsymbol{g}, & \displaystyle\end{eqnarray}$$
 $$\begin{eqnarray}\displaystyle & \displaystyle \frac{\text{d}I_{p}\unicode[STIX]{x1D74E}_{p}}{\text{d}t}=\oint _{\unicode[STIX]{x2202}{\mathcal{V}}_{p}}\boldsymbol{r}\times \unicode[STIX]{x1D749}\boldsymbol{\cdot }\boldsymbol{n}\,\text{d}S, & \displaystyle\end{eqnarray}$$
where
 $\unicode[STIX]{x1D70C}_{p}$
,
 $V_{p}$
and
 $I_{p}$
are the particle density, volume and moment of inertia;
 $\boldsymbol{g}$
is the gravitational acceleration;
 $\unicode[STIX]{x1D749}=-p\boldsymbol{I}+2\unicode[STIX]{x1D707}\boldsymbol{E}$
is the fluid stress, with
 $\boldsymbol{E}=(\unicode[STIX]{x1D735}\boldsymbol{u}_{f}+\unicode[STIX]{x1D735}\boldsymbol{u}_{f}^{\text{T}})/2$
the deformation tensor;
 $\boldsymbol{r}$
is the distance vector from the centre of the particle while
 $\boldsymbol{n}$
is the unity vector normal to the particle surface
 $\unicode[STIX]{x2202}{\mathcal{V}}_{p}$
. Dirichlet boundary conditions for the fluid phase are enforced on the particle surfaces as
 $\boldsymbol{u}_{f}|_{\unicode[STIX]{x2202}{\mathcal{V}}_{p}}=\boldsymbol{u}_{p}+\unicode[STIX]{x1D74E}_{p}\times \boldsymbol{r}$
.
Using the immersed boundary method, the boundary condition at the moving fluid/solid interfaces is indirectly imposed by an additional force on the right-hand side of the Navier–Stokes equations. It is hence possible to discretize the computational domain with a fixed staggered mesh on which the fluid phase is evolved using a second-order finite-difference scheme together with a set of Lagrangian points, uniformly distributed on the surface of the particle to represent the interface. Time integration is performed by a third-order Runge–Kutta scheme combined with pressure correction at each sub-step. When the distance between two particles becomes smaller than twice the mesh size, a lubrication model is used to correctly reproduce the interaction between the particles. In particular, the closest points on the surfaces of two ellipsoids are found. From these, the Gaussian radii of curvature are calculated, and these correspond to the radii of the best fitting spheres tangent to the given surface points. The lubrication model based on Jeffrey (Reference Jeffrey1982) asymptotic solution for spheres of different size is then employed. Additionally, the soft-sphere model is used to account for normal and tangential collisions between the ellipsoids (Costa et al. Reference Costa, Boersma, Westerweel and Breugem2015). As for lubrication, collision forces are calculated for the best fitting spheres at the points of contact and are later transferred to the spheroids centres. More details and validations for the specific immersed boundary method used for ellipsoids can be found in Ardekani et al. (Reference Ardekani, Costa, Breugem and Brandt2016). Other validations specific to the immersed boundary method for spherical particles are found in Breugem (Reference Breugem2012), Lambert et al. (Reference Lambert, Picano, Breugem and Brandt2013), Picano, Breugem & Brandt (Reference Picano, Breugem and Brandt2015), Fornari et al. (Reference Fornari, Picano and Brandt2016a ).
A cubic mesh with approximately eight points per particle polar radius
 $c$
(
 ${\sim}24$
points per equatorial radius
 $b$
) is used for the results presented, which corresponds to
 $640\times 640\times 5120$
grid points in the computational domain and
 $3220$
Lagrangian points on the surface of each particle. Note finally that zero total volume flux is imposed in the simulations.
For
 $\unicode[STIX]{x1D719}=0.5{-}1\,\%$
, simulations were run for
 $182$
particle relaxation times defined using the equivalent diameter
 $d$
(
 $\unicode[STIX]{x1D70F}_{p}=Rd^{2}/(18\unicode[STIX]{x1D708})$
). Defining as reference time the time it takes for an isolated oblate to fall over a distance equal to its polar radius,
 $c/V_{t}$
, the simulation time corresponds to
 $2430c/V_{t}$
. For denser cases, the statistically steady-state condition is reached earlier and simulations were run for
 $72\unicode[STIX]{x1D70F}_{p}=962c/V_{t}$
(
 $\unicode[STIX]{x1D719}=5\,\%$
) and
 $42\unicode[STIX]{x1D70F}_{p}=561c/V_{t}$
(
 $\unicode[STIX]{x1D719}=10\,\%$
). Statistics are collected after
 $90\unicode[STIX]{x1D70F}_{p}=1202c/V_{t}$
for
 $\unicode[STIX]{x1D719}=0.5\,\%{-}1\,\%$
,
 $24\unicode[STIX]{x1D70F}_{p}=320c/V_{t}$
for
 $\unicode[STIX]{x1D719}=5\,\%$
, and
 $6\unicode[STIX]{x1D70F}_{p}=80c/V_{t}$
for
 $\unicode[STIX]{x1D719}=10\,\%$
.
3 Results
3.1 Settling speed and suspension microstructure
The most striking result of our study is that semi-dilute suspensions of oblate particles with
 $Ga\gg 1$
, settle on average substantially faster than isolated particles, approximately 33 % faster at
 $\unicode[STIX]{x1D719}=0.5\,\%$
. As the Galileo number
 $Ga$
increases, the effects of particle inertia and hydrodynamic interactions due to particle wakes become progressively more important overcoming the hindrance effect described above (Yin & Koch Reference Yin and Koch2007; Guazzelli & Morris Reference Guazzelli and Morris2011). For spherical particles at moderate
 $Ga$
, the hindrance leads to a power-law decay of the mean settling speed
 $\langle V_{z}\rangle$
with the volume fraction
 $\unicode[STIX]{x1D719}$
. Hence, the mean settling speed
 $V_{z}$
is smaller than the terminal falling speed
 $V_{t}$
of an isolated sphere for all volume fractions
 $\unicode[STIX]{x1D719}$
. At low and moderate terminal Reynolds numbers,
 $Re_{t}=V_{t}d/\unicode[STIX]{x1D708}\leqslant 20$
, the hindrance effect is well described by the modified Richardson and Zaki empirical formula (Richardson & Zaki Reference Richardson and Zaki1954b
)
 $$\begin{eqnarray}\displaystyle \frac{\langle V_{z}\rangle }{V_{t}}=\unicode[STIX]{x1D705}(1-\unicode[STIX]{x1D719})^{n}, & & \displaystyle\end{eqnarray}$$
where
 $n$
is an exponent that depends on
 $Re_{t}$
(Garside & Al-Dibouni Reference Garside and Al-Dibouni1977)
 $$\begin{eqnarray}\displaystyle \frac{5.1-n}{n-2.7}=0.1Re_{t}^{0.9}, & & \displaystyle\end{eqnarray}$$
while
 $\unicode[STIX]{x1D705}$
is a correction coefficient for finite
 $Re_{t}$
that has been found to be in the range
 $0.8{-}0.92$
(Di Felice Reference Di Felice1999; Yin & Koch Reference Yin and Koch2007). Note that we have checked that we can get consistent values of
 $\unicode[STIX]{x1D705}$
with our code. In particular, we have also performed simulations of suspensions of spheres with
 $Ga\sim 9$
settling under gravity, and found that
 $\unicode[STIX]{x1D705}\sim 0.91$
.
From the simulation of the isolated settling oblate we find that the terminal Reynolds number is
 $Re_{t}=V_{t}d/\unicode[STIX]{x1D708}=38.7$
(with
 $d$
the equivalent diameter of a sphere with the same volume). At these
 $R$
,
 $Ga$
and
 $Re_{t}$
the corresponding wake behind both spheres and oblates is steady and vertical (Bouchet, Mebarek & Dušek Reference Bouchet, Mebarek and Dušek2006; Ardekani et al.
Reference Ardekani, Costa, Breugem and Brandt2016). For the case of oblique wakes past isolated spheres, Uhlmann & Doychev (Reference Uhlmann and Doychev2014) have shown an increase of the mean settling speed (these authors considered spheres with
 $R=1.5$
and
 $Ga=178$
). The mean settling speed of the suspension (
 $\unicode[STIX]{x1D719}=0.5\,\%$
) increases above
 $V_{t}$
by approximately
 $12\,\%$
. This increase of
 $\langle V_{z}\rangle$
is due to the formation of particle clusters.
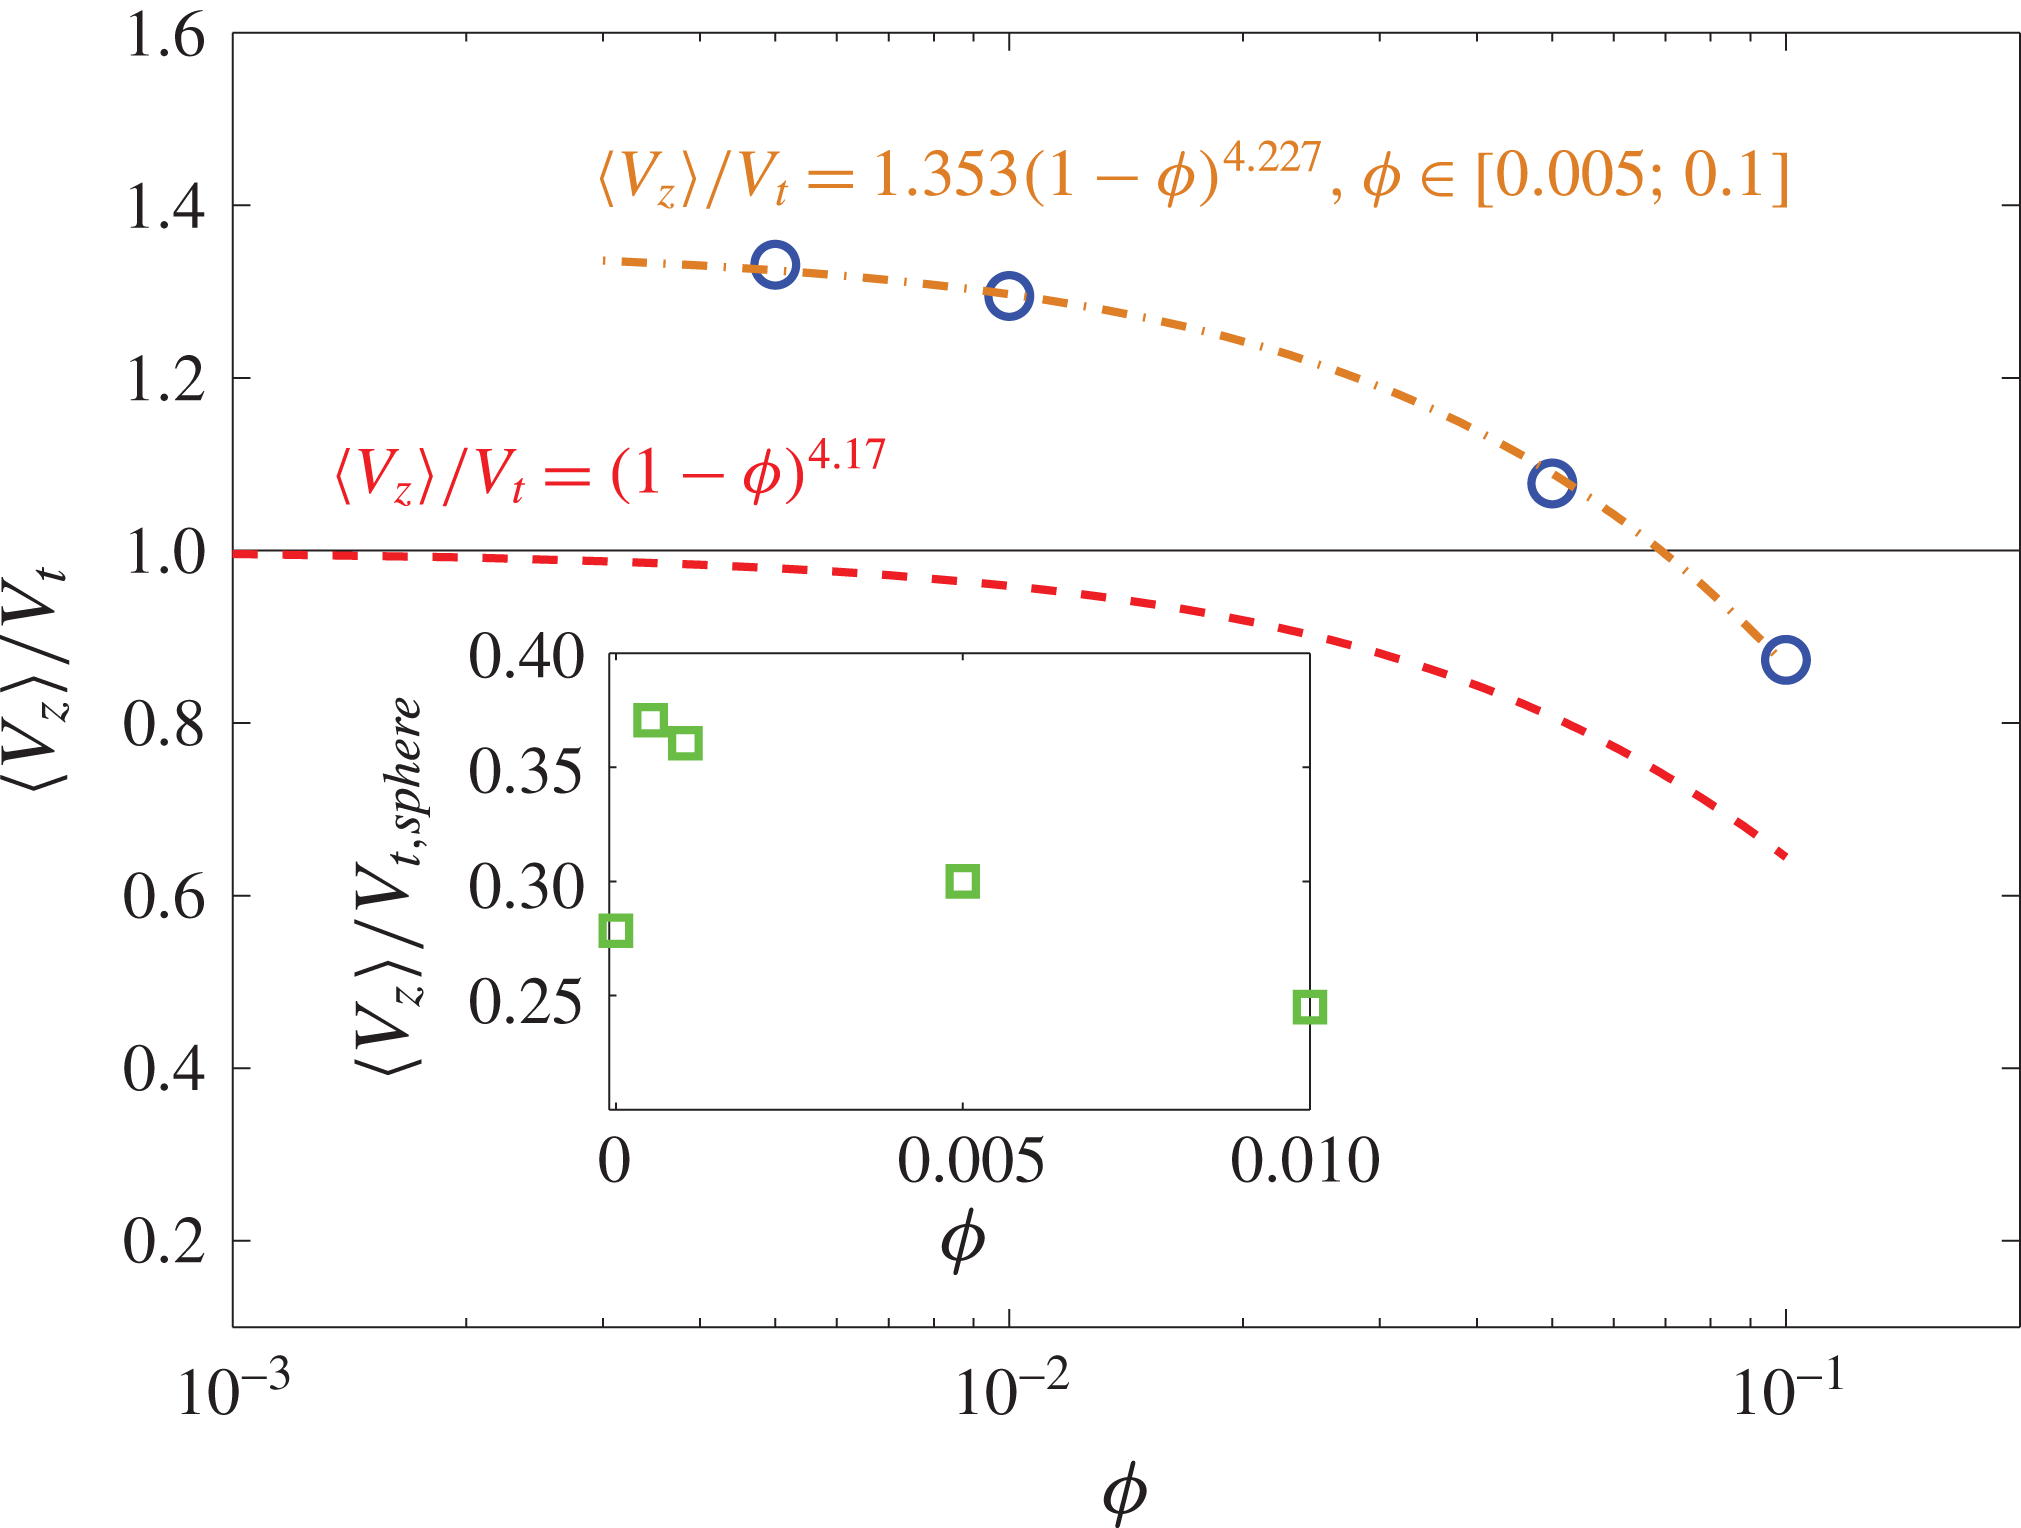
Mean settling speed
 $\langle V_{z}\rangle /V_{t}$
as function of the solid volume fraction
 $\unicode[STIX]{x1D719}$
. The dash-dotted line is a fit of
 $\langle V_{z}\rangle /V_{t}$
in the range
 $\unicode[STIX]{x1D719}\in [0.5;10]\,\%$
. The empirical fit proposed by Richardson and Zaki for settling spheres is also shown (dashed line). In the inset, the mean settling speed is normalized by the settling speed of an isolated spherical particle of same Galileo number
 $Ga$
, based on the equivalent diameter.

The results for the mean settling speed of the oblate suspension,
 $\langle V_{z}\rangle$
, normalized by
 $V_{t}$
, are shown in figure 2. The expected velocity predicted via the empirical fit (3.1) using
 $\unicode[STIX]{x1D705}=1$
and
 $n=4.17$
(obtained from (3.2) and
 $Re_{t}=38.7$
) is also shown for comparison. In contrast to what expected for spheres, we find that the mean settling speed
 $\langle V_{z}\rangle$
is larger than
 $V_{t}$
for volume fractions approximatively lower than
 $7\,\%$
. For
 $\unicode[STIX]{x1D719}=0.5\,\%$
and
 $1\,\%$
,
 $\langle V_{z}\rangle \sim 1.3V_{t}$
and for
 $\unicode[STIX]{x1D719}=5\,\%$
 $\langle V_{z}\rangle =1.08V_{t}$
. However, the hindrance effect becomes progressively stronger above
 $\unicode[STIX]{x1D719}=0.5\,\%$
, reducing
 $\langle V_{z}\rangle /V_{t}$
; this observable becomes lower than
 $1$
for the largest volume fraction considered here. We fitted our data in the range
 $\unicode[STIX]{x1D719}\in [0.5\,\%{-}10\,\%]$
using equation (3.1) to find
 $\langle V_{z}\rangle /V_{t}=1.353(1-\unicode[STIX]{x1D719})^{4.227}$
. Clearly, this relation is valid only for this range of volume fractions and possibly for larger
 $\unicode[STIX]{x1D719}$
. We leave as future work the study of more dilute cases to understand how
 $\langle V_{z}\rangle /V_{t}$
initially increases with
 $\unicode[STIX]{x1D719}$
.
In the inset of figure 2 we report the same data normalized by the terminal velocity of an isolated spherical particle with
 $Ga=60$
. We see that oblates settle at a substantially slower rate than spheres for all
 $\unicode[STIX]{x1D719}$
. For
 $\unicode[STIX]{x1D719}=0.5$
,
 $1\,\%$
,
 $\langle V_{z}\rangle \sim 0.36V_{t,sphere}$
.
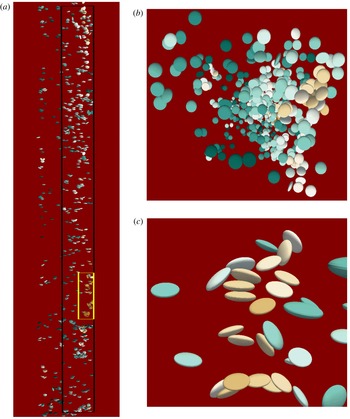
Instantaneous snapshots of oblate particles falling under gravity: (a) front view; (b) top view; (c) zoom on a cluster of
 $3$
piled up particles.

To understand the enhancement of
 $\langle V_{z}\rangle /V_{t}$
at moderate
 $\unicode[STIX]{x1D719}$
, we first show in figure 3(a) an instantaneous snapshot of the settling suspension at
 $\unicode[STIX]{x1D719}=0.5\,\%$
. It can be seen that most particles are located on the right half of the snapshot (i.e. for
 $x\geqslant 0.5L_{x}$
) where they seem to form a columnar structure. As we will soon show, particles within this columnar structure fall on average faster than the more isolated particles and the whole suspension. This peculiar particle distribution can also be observed in figure 3(b), displaying a the top view of the same instantaneous configuration. These observations confirm the importance of particle–particle hydrodynamic interactions at finite inertia. Note that the smaller region delimited by a box in figure 3(a) highlights particles that fall approximately
 $3{-}3.5$
times faster than an isolated particle.
As mentioned above, Ardekani et al. (Reference Ardekani, Costa, Breugem and Brandt2016) studied the settling of two isolated oblate particles at a similar
 $Ga$
. While two spheres would undergo the so-called drafting–kissing–tumbling phenomenon (Fortes et al.
Reference Fortes, Joseph and Lundgren1987), Ardekani et al. (Reference Ardekani, Costa, Breugem and Brandt2016) showed that the rear oblate accelerates in the wake of the front particle until it approaches it and almost perfectly sticks to it. The tumbling stage is therefore suppressed and the particles fall in contact. The particle pair falls with a speed that is
 $1.5$
times the terminal velocity of an isolated oblate. In the same study, it was also found that the maximum radius of the collision (or entrainment area) for oblates of
 $AR=1/3$
is approximately
 $4$
times larger than that of spheres of equal
 $Ga$
for several different vertical separations. These results obtained for particle pairs are reflected in and determine the suspension behaviour. From the close up in figure 3(c), we note that in a suspension with
 $\unicode[STIX]{x1D719}=0.5\,\%$
more than
 $3$
particles can pile up during drafting–kissing–tumbling events. These particle clusters generate strong wakes that, in turn, lead to the formation of the columnar-like structure. This columnar structure is observed also for larger
 $\unicode[STIX]{x1D719}$
. Note that the
 $(x,y)$
location of the structure is purely random. Similar columnar structures were observed also for spherical particles by Uhlmann & Doychev (Reference Uhlmann and Doychev2014), Huisman et al. (Reference Huisman, Barois, Bourgoin, Chouippe, Doychev, Huck, Morales, Uhlmann and Volk2016), although for much larger
 $Ga=178$
, while these were not observed for spheres at
 $Ga=120$
. It should be mentioned that the enhancement of the mean settling speed above
 $V_{t}$
at low volume fractions has also been observed for oblate and prolate particles in the creeping flow regime (Saintillan et al.
Reference Saintillan, Shaqfeh and Darve2006). As previously discussed, however, in this regime the dominant mechanism leading to clustering is different. In particular, it has been shown that non-spherical particles tend to migrate towards high particle density regions (Saintillan et al.
Reference Saintillan, Shaqfeh and Darve2006; Shin et al.
Reference Shin, Koch and Subramanian2009). Hence, different mechanisms lead to clustering formation in creeping flow and inertial regimes.
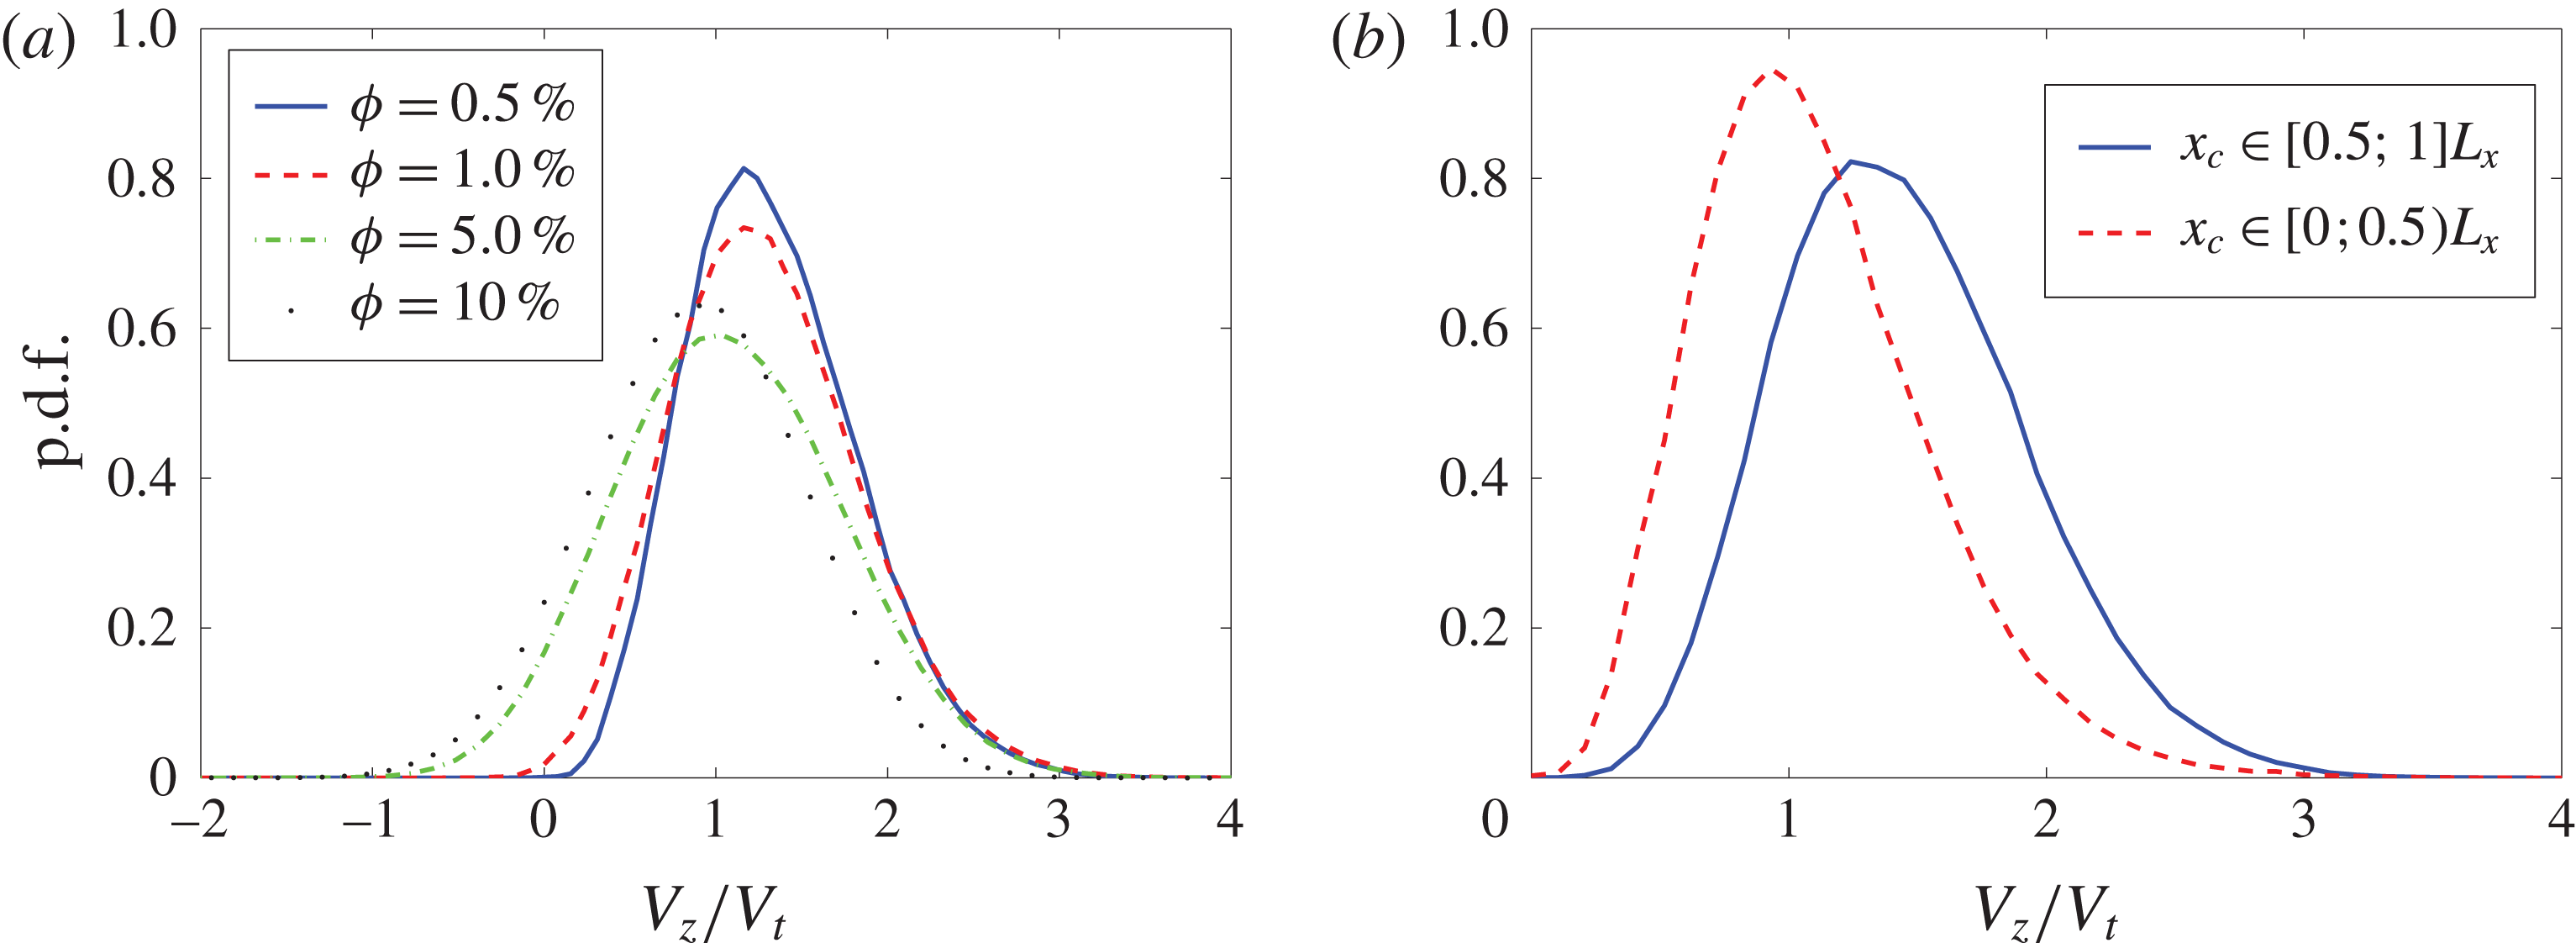
(a) Probability density function (p.d.f.) of the settling speed for all
 $\unicode[STIX]{x1D719}$
. (b) Probability density functions of the settling speed calculated for particles contained in the volumes defined by
 $x_{c}\in [0;0.5)L_{x}$
(dashed line) and
 $x_{c}\in [0.5;1]L_{x}$
(solid line), for
 $\unicode[STIX]{x1D719}=0.5\,\%$
.

Next, we display in figure 4(a) the probability density function (p.d.f.) of the settling speed
 $V_{z}/V_{t}$
for all
 $\unicode[STIX]{x1D719}$
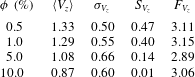
under investigation. The moments of the p.d.f.s are reported in table 1. For
 $\unicode[STIX]{x1D719}=0.5\,\%$
and
 $1\,\%$
the distributions are similar and (positively) skewed towards larger speeds than the mean value. As
 $\unicode[STIX]{x1D719}$
increases, the skewness of the p.d.f.s (
 $S_{V_{z}}$
) decreases becoming negligible for the denser case, indicating that the dynamics is mostly governed by excluded volume effects, rather than by pair interactions and clustering formation. On the contrary, the standard deviation of the p.d.f.s increases with
 $\unicode[STIX]{x1D719}$
up to
 $\unicode[STIX]{x1D719}=5\,\%$
. A slightly smaller
 $\unicode[STIX]{x1D70E}_{V_{z}}$
is found instead for
 $\unicode[STIX]{x1D719}=10\,\%$
. The flatness,
 $F_{V_{z}}$
, is always around
 $3$
. It is interesting to observe that as
 $\unicode[STIX]{x1D719}$
increases, the p.d.f.s tend progressively towards a normal distribution indicating that the settling dynamics, initially governed mostly by particle interaction through wakes, becomes progressively dominated by the hindrance effect.
As can be seen from the p.d.f.s, the probability of having particles rising increases with
 $\unicode[STIX]{x1D719}$
. This is due to the imposition of the zero total volume flux condition. This ensures that
 $\langle W_{z}\rangle =(1-\unicode[STIX]{x1D719})\langle U_{z}\rangle +\unicode[STIX]{x1D719}\langle V_{z}\rangle =0$
, where
 $W_{z}$
and
 $U_{z}$
are the bulk and fluid velocities (Guazzelli & Morris Reference Guazzelli and Morris2011). As said, particle clusters settle substantially faster than the whole suspension and to satisfy the condition
 $\langle W_{z}\rangle =0$
, strong upward local fluid streams are generated in their surroundings. When these updrafts encounter slowly settling particles, they drag them in the opposite direction with respect to gravity. Notice that we have observed this effect also for dense suspensions of spheres with
 $Ga\sim 9$
, for which we found results in agreement with the corrected Richardson–Zaki fit and with Yin & Koch (Reference Yin and Koch2007).
In figure 4(b) we show the p.d.f.s of settling speeds for particles whose centres are located within
 $x\in [0;0.5)L_{x}$
or within
 $x\in [0.5;1]L_{x}$
(i.e. the computational domain is divided in two parts denoted as left and right). Particles located within
 $x\in [0.5;1]L_{x}$
(i.e. where the columnar structure is found, right side) settle with a mean velocity larger than that of the suspension (
 $\langle V_{r,z}\rangle /V_{t}=1.45$
). A smaller mean settling speed is found instead in the left half (
 $\langle V_{l,z}\rangle /V_{t}=1.1$
). Concerning the distribution standard deviation, this is also slightly larger in the right half,
 $x_{c}\in [0.5;1]L_{x}$
(
 $\unicode[STIX]{x1D70E}_{r}=0.48$
and
 $\unicode[STIX]{x1D70E}_{l}=0.45$
). On the other hand, it is interesting to note that the skewness is larger for the slower particles, located in the region
 $x_{c}\in [0;0.5)L_{x}$
(
 $S_{l}=0.75$
and
 $S_{r}=0.44$
). This is because on the left half, there are less particles that less frequently undergo intense drafting–kissing–tumbling interactions. These interactions lead to the large skewness, while the mean value is similar to
 $V_{t}$
with the particles more isolated. Since the drafting–kissing–tumbling events are more intermittent in the left half, also the flatness is larger than for the velocities of the particles forming the fast falling column (
 $F_{l}=4$
versus
 $F_{r}=3$
).
Moments of the p.d.f.s of settling speed for all
 $\unicode[STIX]{x1D719}$
: mean value,
 $\langle V_{z}\rangle$
; standard deviation,
 $\unicode[STIX]{x1D70E}_{V_{z}}$
; skewness,
 $S_{V_{z}}$
; flatness,
 $F_{V_{z}}$
. The first two value are normalized by the terminal velocity
 $V_{t}$
.

We now turn to the discussion of the microstructure of the whole suspension. To this aim we calculate the pair distribution function
 $P(\boldsymbol{r})$
, the conditional probability of finding a particle at
 $\boldsymbol{r}$
, given one at the origin. Following Kulkarni & Morris (Reference Kulkarni and Morris2008), this is defined as
 $$\begin{eqnarray}\displaystyle P(\boldsymbol{r})=P(r,\unicode[STIX]{x1D703},\unicode[STIX]{x1D713})=\frac{H(r,\unicode[STIX]{x1D703},\unicode[STIX]{x1D713})}{nt_{s}\unicode[STIX]{x0394}V}, & & \displaystyle\end{eqnarray}$$
where
 $\unicode[STIX]{x1D703}$
is the polar angle (measured from the positive
 $x$
axis),
 $\unicode[STIX]{x1D713}$
is the azimuthal angle (measured from the positive
 $z$
axis),
 $n$
is the average particle number density,
 $t_{s}$
is the total number of sampling points,
 $\unicode[STIX]{x0394}V=r^{2}\unicode[STIX]{x0394}r\sin \unicode[STIX]{x1D713}\unicode[STIX]{x0394}\unicode[STIX]{x1D713}\unicode[STIX]{x0394}\unicode[STIX]{x1D703}$
is the volume of the sampling bin and
 $H(r,\unicode[STIX]{x1D703},\unicode[STIX]{x1D713})$
is the histogram of particle pairs. More specifically, the pair space is discretized in
 $(r,\unicode[STIX]{x1D703},\unicode[STIX]{x1D713})$
and at each sampling time we obtain
 $N_{p}(N_{p}-1)/2$
pair separation vectors
 $\boldsymbol{r}$
from the simulated particle configurations. Each vector
 $\boldsymbol{r}$
is put into the corresponding bin of size
 $\unicode[STIX]{x0394}V$
so that the particle-pair histogram
 $H(r,\unicode[STIX]{x1D703},\unicode[STIX]{x1D713})$
is progressively built.
Pair distribution function
 $P(r,\unicode[STIX]{x1D713})$
for all
 $\unicode[STIX]{x1D719}$
under investigation with
 $\unicode[STIX]{x1D719}$
increasing from left to right and top to bottom. The insets in panels (c,d), corresponding to
 $\unicode[STIX]{x1D719}=5\,\%$
and
 $10\,\%$
, show
 $P(r,\unicode[STIX]{x1D713})$
with the same contour levels as in (a,b). Panel (e) shows the radial distribution function
 $g(r)$
for all
 $\unicode[STIX]{x1D719}$
, while panel (f) shows the order parameter
 $\langle P_{2}\rangle (r)$
.

For our cases,
 $P(\boldsymbol{r})$
is axisymmetric about the direction of gravity. Therefore we first report
 $P(\boldsymbol{r})$
as function of the centre-to-centre distance
 $r$
(normalized by
 $c$
), and the azimuthal angle
 $\unicode[STIX]{x1D713}$
, averaging over
 $\unicode[STIX]{x1D703}$
. The pair distribution function
 $P(\boldsymbol{r})$
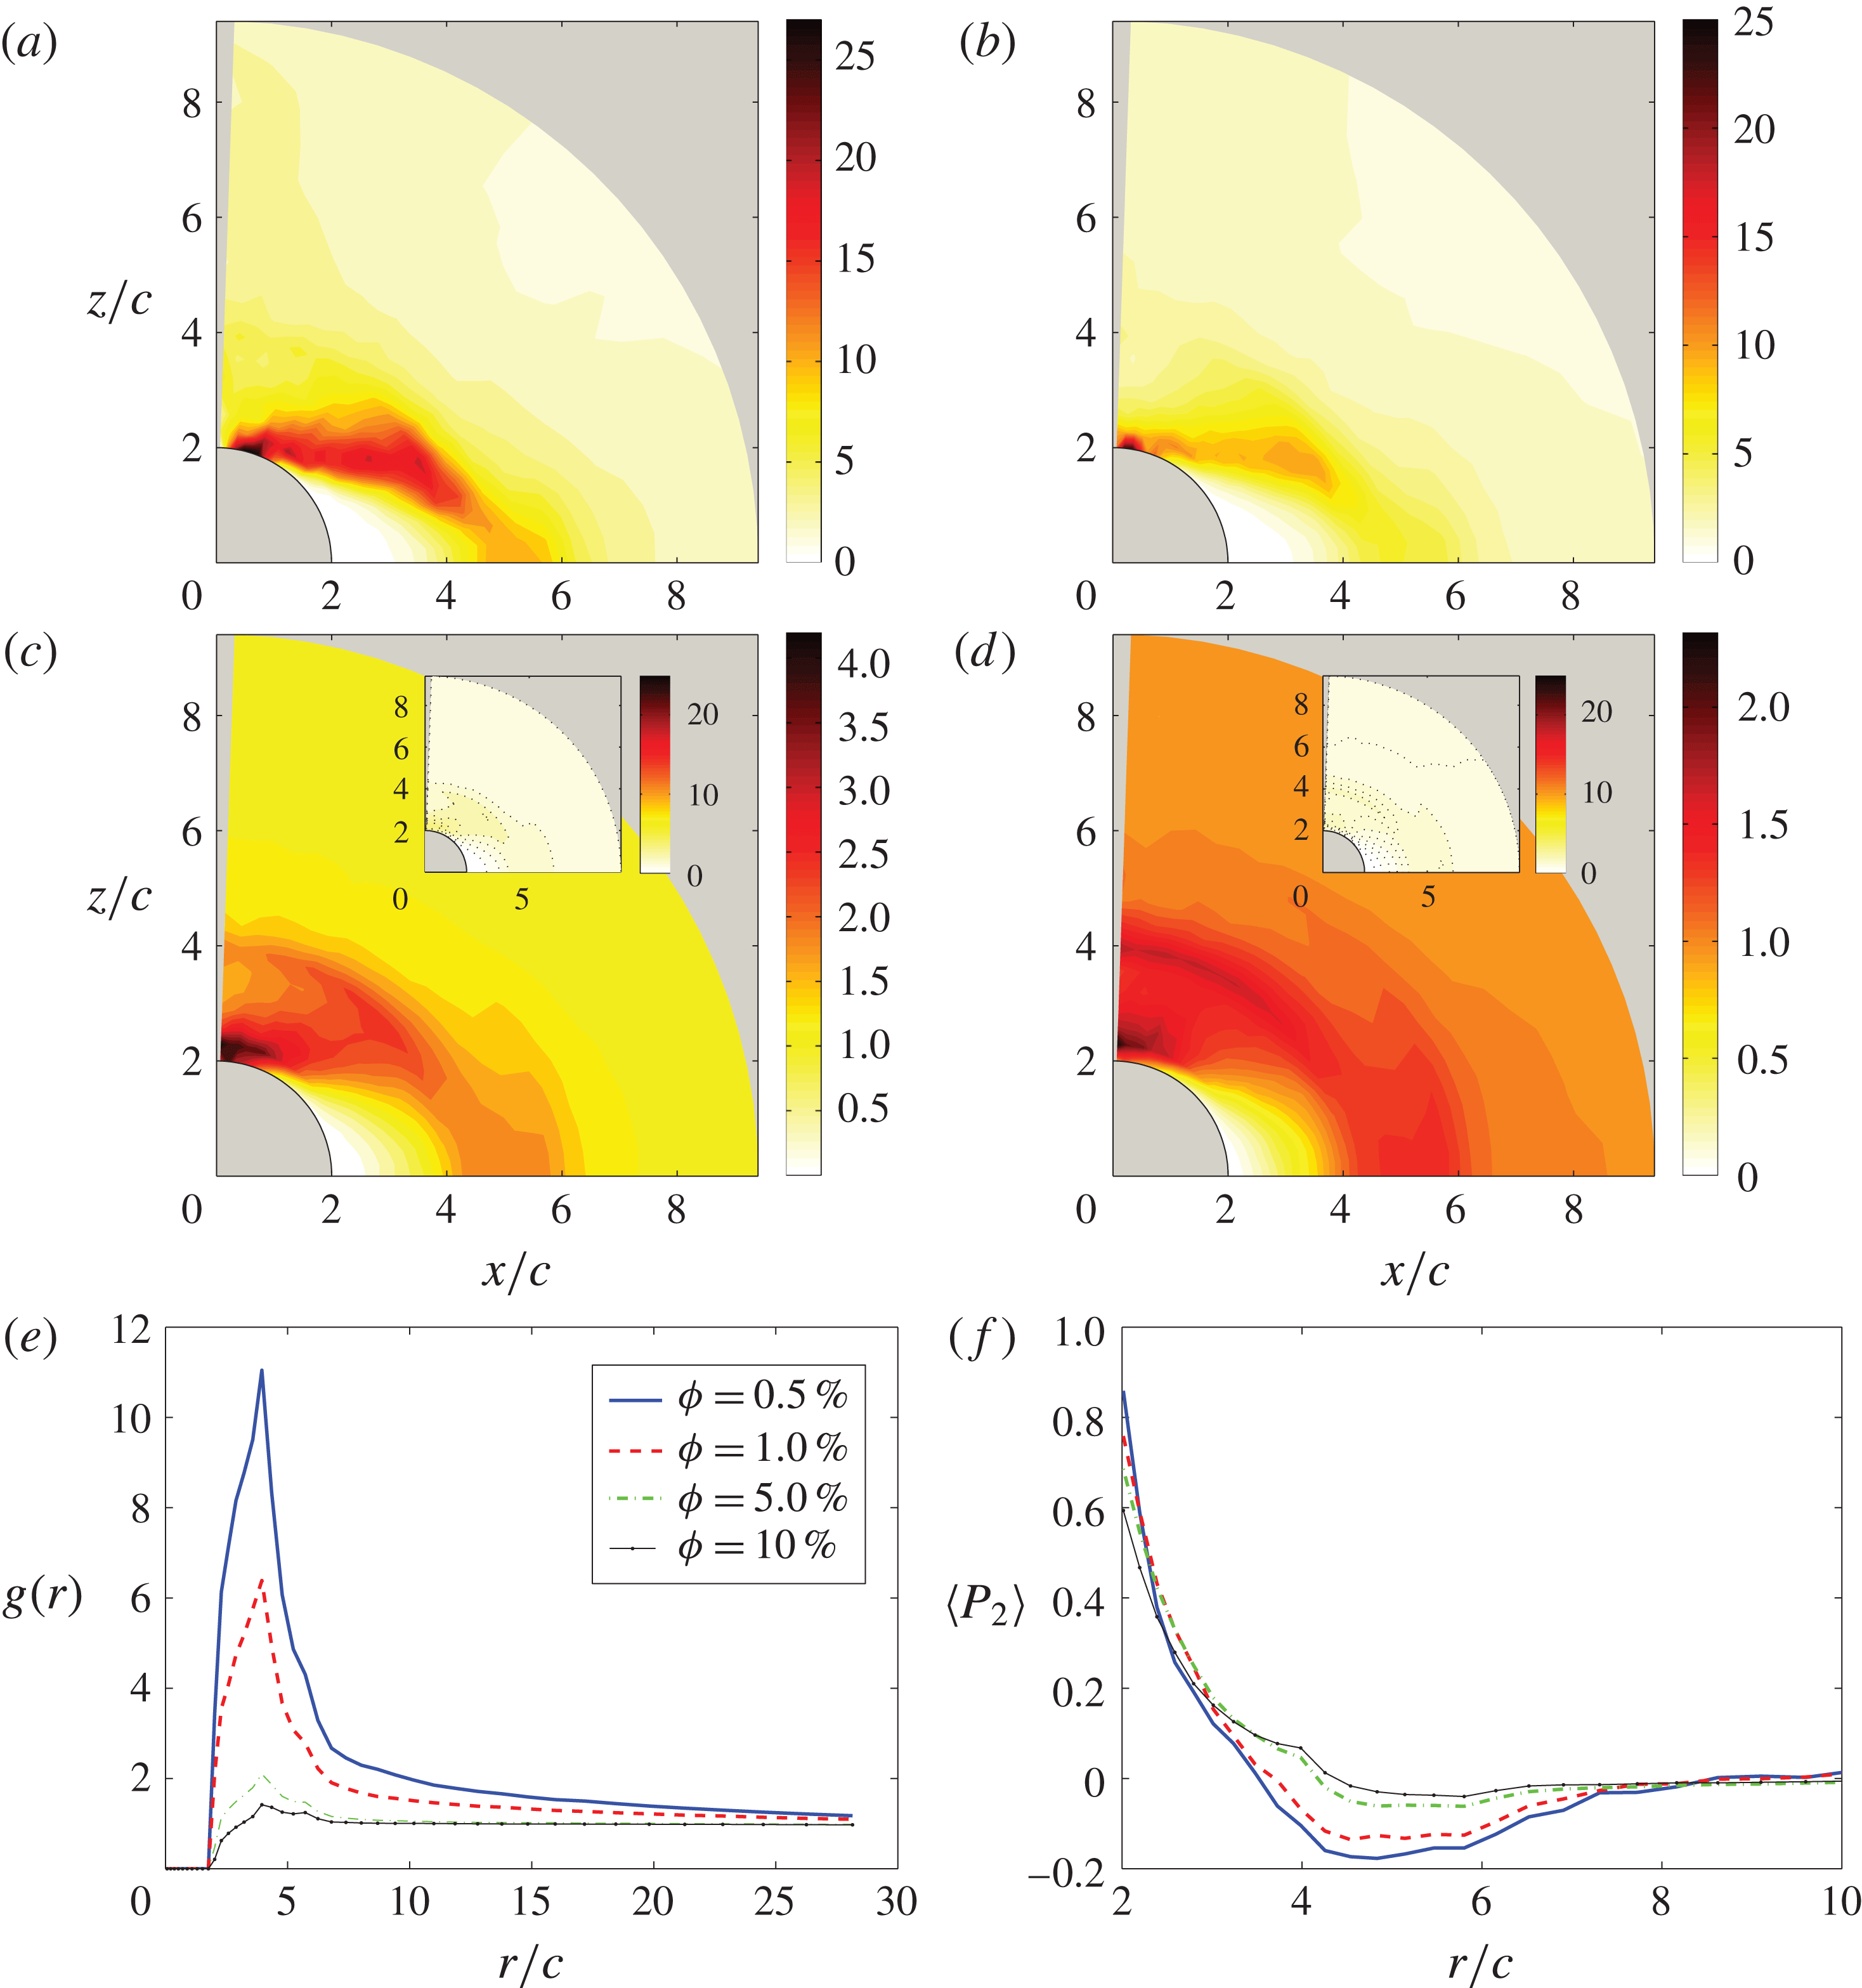
is shown in figure 5(a–d) for the four volume fractions under investigation. For simplicity, we denote the axis at
 $\unicode[STIX]{x1D713}=90^{\circ }$
as
 $x/c$
. The results are substantially different from what observed for spheres at comparable and smaller
 $Ga$
(Yin & Koch Reference Yin and Koch2007; Uhlmann & Doychev Reference Uhlmann and Doychev2014) for which no evident clustering is observed. For
 $\unicode[STIX]{x1D719}=0.5\,\%$
we see that the pair distribution function
 $P(\boldsymbol{r})$
is large all around the reference particle. On average, each particle is surrounded by other particles, with a higher probability in the region between
 $\unicode[STIX]{x1D713}\sim 5^{\circ }$
and
 $\unicode[STIX]{x1D713}\sim 80^{\circ }$
. From this figure it is also clear that particles preferentially cluster on top of each other, with their broad sides almost perpendicular to the vertical direction, and with an inclination that increases with
 $x/c$
, see also figure 3(c). The maximum of
 $P(\boldsymbol{r})$
is located at
 $r=2.02c$
and
 $\unicode[STIX]{x1D713}\simeq 17^{\circ }$
. Notice that horizontal clusters of sticking particles falling with their broad sides perfectly parallel to gravity do not occur. Indeed we see that
 $P(\boldsymbol{r})=0$
for
 $\unicode[STIX]{x1D713}=90^{\circ }$
, below
 $x\simeq 4c$
. For
 $\unicode[STIX]{x1D719}=1\,\%$
the results are similar although
 $P(\boldsymbol{r})$
is lower over the entire
 $(r,\unicode[STIX]{x1D703},\unicode[STIX]{x1D713})$
space. The probability of finding a second particle is again large all around the reference particle, with the highest values between
 $\unicode[STIX]{x1D713}\sim 2^{\circ }$
and
 $\unicode[STIX]{x1D713}\sim 70^{\circ }$
. Particles are hence more vertically aligned within clusters, with a maximum
 $P(\boldsymbol{r})$
located at
 $r=2.02c$
and
 $\unicode[STIX]{x1D713}\simeq 10^{\circ }$
(i.e. with the symmetry axis almost parallel to gravity). The maximum value is just slightly smaller than that found for
 $\unicode[STIX]{x1D719}=0.5\,\%$
. The region of high
 $P(\boldsymbol{r})$
is found to translate towards
 $\unicode[STIX]{x1D713}=0^{\circ }$
.
For
 $\unicode[STIX]{x1D719}=5\,\%$
and
 $10\,\%$
,
 $P(\boldsymbol{r})$
decreases substantially for all values of
 $(r,\unicode[STIX]{x1D703},\unicode[STIX]{x1D713})$
. The maximum of
 $P(\boldsymbol{r})$
is now found between
 $\unicode[STIX]{x1D713}=0^{\circ }$
and
 $2^{\circ }$
. Note also that for these cases
 $P(\boldsymbol{r})\sim 1$
for
 $r\geqslant 6c$
, indicating that the random (Poissonian) distribution of particles (i.e. an uncorrelated statistical particle distribution) is already reached above this radial distance. Conversely, for the cases with
 $\unicode[STIX]{x1D719}=0.5\,\%$
and
 $1\,\%$
we see that
 $P(\boldsymbol{r})\sim 1$
only in a small region between
 $[5;9]c\times [30^{\circ };70^{\circ }]$
. The correlation of the particle distribution at large
 $r/c$
for low volume fractions is indicative of the presence of the above-mentioned columnar structures.
A measure of the suspension microstructure that can be more easily quantified in a plot is the average of
 $P(r,\unicode[STIX]{x1D703},\unicode[STIX]{x1D713})$
over all possible orientations. This is known as the radial distribution function
 $g(r)$
and it is shown in figure 5(e) for all volume fractions. We see that by averaging over all
 $\unicode[STIX]{x1D703}$
and
 $\unicode[STIX]{x1D713}$
, the maximum of the radial distribution function appears at a radial distance of approximately
 $4c$
. The peak is almost halved as
 $\unicode[STIX]{x1D719}$
is doubled from
 $0.5\,\%$
to
 $1\,\%$
. For these cases, the decorrelation of the particle distribution,
 $g(r)\sim 1$
, occurs for
 $r>20c$
. This is also approximately the radius of the columnar structure identified in figure 3. The extent of clustering is sharply reduced for
 $\unicode[STIX]{x1D719}\geqslant 5\,\%$
. Indeed, the maxima of
 $P(\boldsymbol{r})$
are between
 $2$
and
 $1.5$
, and the uncorrelated value (i.e.
 $1$
) is quickly reached,
 $r/c\sim 6$
.
Finally, we consider in figure 5(f) the order parameter. This is used to quantify the preferential orientation of particle pairs and it is a function of the radial separation
 $r$
(Yin & Koch Reference Yin and Koch2007). This is defined as the angular average of the second Legendre polynomial
 $$\begin{eqnarray}\displaystyle \langle P_{2}\rangle (r)=\frac{\displaystyle \int _{0}^{\unicode[STIX]{x03C0}}P(r,\unicode[STIX]{x1D713})P_{2}(\cos \unicode[STIX]{x1D713})\sin \unicode[STIX]{x1D713}\,\text{d}\unicode[STIX]{x1D713}}{\displaystyle \int _{0}^{\unicode[STIX]{x03C0}}P(r,\unicode[STIX]{x1D713})\sin \unicode[STIX]{x1D713}\,\text{d}\unicode[STIX]{x1D713}}, & & \displaystyle\end{eqnarray}$$
where
 $P_{2}(\cos \unicode[STIX]{x1D713})=(3\cos ^{2}\unicode[STIX]{x1D713}-1)/2$
. The order parameter
 $\langle P_{2}\rangle (r)$
is
 $1$
for vertically aligned pairs at a separation
 $r$
,
 $-1/2$
for horizontally aligned pairs and
 $0$
for isotropic configurations. We see that for
 $r\sim 2c$
, the order parameter
 $\langle P_{2}\rangle$
is between
 $0.6$
and
 $0.8$
for all
 $\unicode[STIX]{x1D719}$
. This confirms the observation that when the separation distance
 $r$
is of the order of
 ${\sim}2c$
, most particles are almost perfectly piled up. Above
 $r\sim 3.5c$
,
 $\langle P_{2}\rangle$
becomes negative for
 $\unicode[STIX]{x1D719}=0.5\,\%$
and
 $1\,\%$
, with a minimum value of approximately
 $-(0.2{-}0.15)$
around
 $r=4.5c$
. Hence, at these radial distance particle pairs tend to be more horizontally aligned, with a finite inclination or pitch angle between their axis of symmetry and the direction of gravity plane (as we will show later). For the higher volume fractions,
 $\langle P_{2}\rangle$
is only slightly negative, confirming the disappearance of strong clustering in these cases. The configuration becomes more isotropic after
 $r=8c$
for the more dilute cases, and after
 $r=6c$
for the denser cases.
(a) The fraction of the total number of oblates that form clusters of
 $N=1,2,\ldots ,13$
particles, for the case with
 $\unicode[STIX]{x1D719}=0.5\,\%$
. (b) The mean settling speed of the clusters with
 $N$
particles for
 $\unicode[STIX]{x1D719}=0.5\,\%$
.

Before concluding the section we report additional information on the number of particle clusters and their mean settling speed for the dilute case with
 $\unicode[STIX]{x1D719}=0.5\,\%$
. The results for
 $\unicode[STIX]{x1D719}=1\,\%$
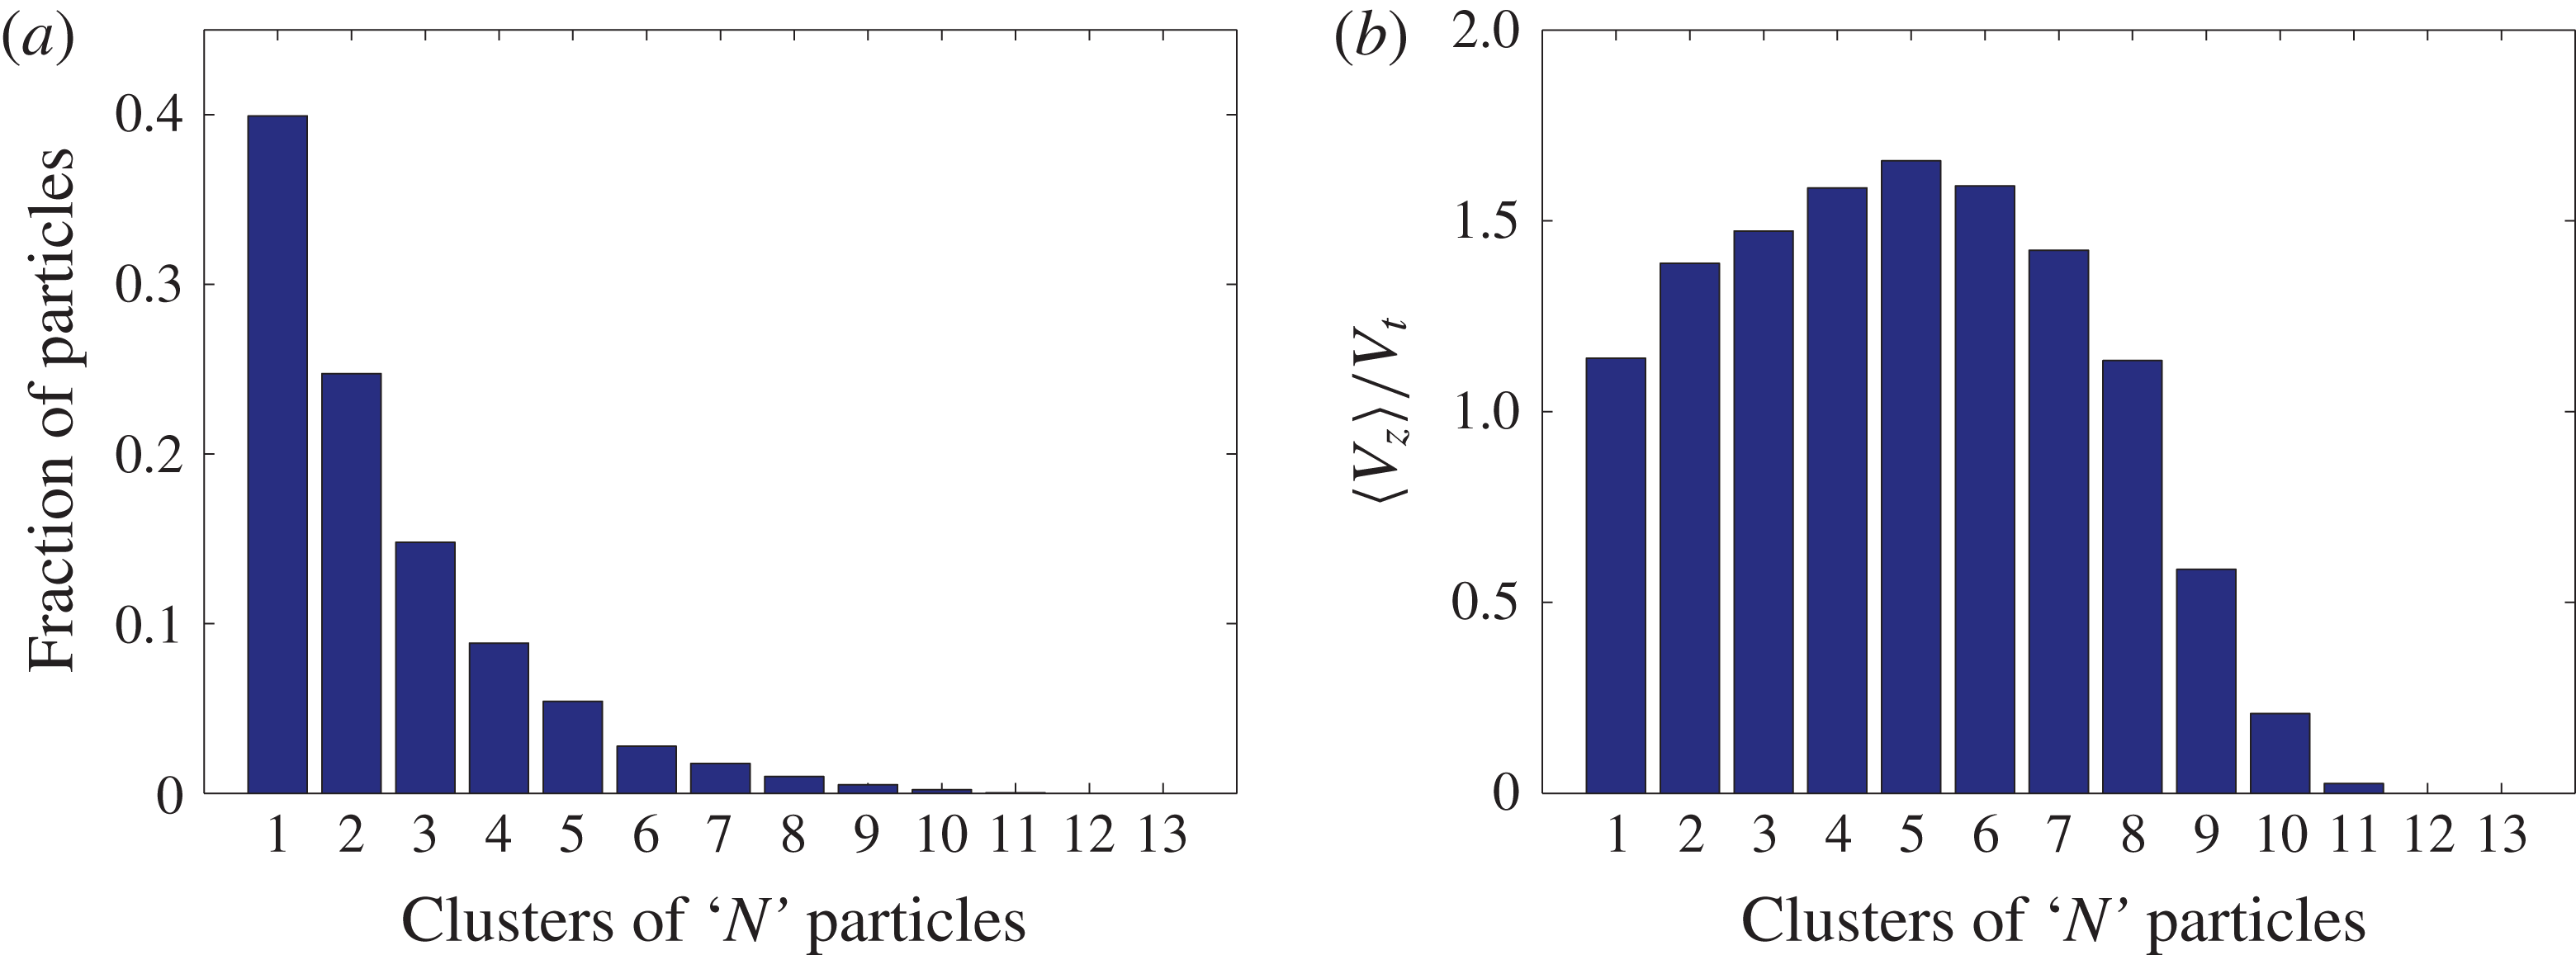
are qualitatively similar and are hence not shown. In particular, in figure 6(a) we report the fraction of the total number of oblates that fall as clusters of
 $N$
particles (the case
 $N=1$
corresponds to single particles not contained within a cluster). In the calculation, two particles are assumed to be in the same cluster if the radial distance between their centroids is less than one equivalent diameter,
 $d$
. We see that on average
 $40\,\%$
of the particles are not contained in clusters. The remaining particles can form clusters with
 $N$
up to
 $11$
. However, we see that most of the clusters consist of
 $N=2$
,
 $3$
and
 $4$
particles. Specifically,
 ${\sim}25\,\%$
,
 $15\,\%$
and
 $9\,\%$
of the total number of particles are contained in clusters with
 $N=2$
,
 $3$
and
 $4$
. In figure 6(b) we show instead the mean settling speed of the clusters with
 $N$
particles. We observe that clusters of
 $N=5$
particles fall with the largest
 $\langle V_{z}\rangle /V_{t}=1.66$
. Clusters with
 $2$
to
 $4$
particles fall with mean speeds that are approximately 1.4–1.6 times the terminal velocity. This suggests that if all particles were forming clusters of at least
 $2$
particles, the mean settling speed would be substantially larger. It is also interesting to note what happens for particles that do not settle in clusters: in this case single particles settle with a mean speed
 $1.14$
times the terminal velocity. As we will more thoroughly discuss in the next section, we have performed an additional simulation of an isolated oblate falling at a fix angle of
 $22.8^{\circ }$
, the mean pitch angle of the settling oblates when
 $\unicode[STIX]{x1D719}=0.5\,\%$
. In such artificial case, we find that the particle has a finite drift speed, and a settling speed that is
 $1.03$
times
 $V_{t}$
. However, for
 $\unicode[STIX]{x1D719}=0.5\,\%$
single oblates fall at a larger mean speed,
 $\langle V_{z}\rangle =1.14V_{t}$
. Consequently, this large mean speed cannot be solely explained by the fact that particles settle with a mean angle. Indeed, we find that in the volume occupied by the columnar structure, the fluid moves fast in the settling direction. Single particles within the column are hence accelerated by these downdrafts.
3.2 Particle dynamics
In the previous section we have analysed the p.d.f.s of particle settling speeds for all
 $\unicode[STIX]{x1D719}$
. We now study the horizontal component of the translational velocity (in the direction perpendicular to gravity), as well as the rotational velocities.
(a) Particle speed in the direction perpendicular to gravity
 $V_{x}/V_{t}$
for all
 $\unicode[STIX]{x1D719}$
. (b) Standard deviation of the particle velocities parallel,
 $\unicode[STIX]{x1D70E}_{V_{z}}$
, and perpendicular to gravity,
 $\unicode[STIX]{x1D70E}_{V_{x}}$
as a function of
 $\unicode[STIX]{x1D719}$
. (c) Anisotropy of the velocity fluctuations,
 $\unicode[STIX]{x1D70E}_{V_{x}}/\unicode[STIX]{x1D70E}_{V_{z}}$
for all cases. (d,e) Probability density functions, p.d.f. of the particle angular velocities in the directions parallel,
 $\unicode[STIX]{x1D714}_{z}$
, and perpendicular to gravity,
 $\unicode[STIX]{x1D714}_{x}$
. These are normalized by
 $V_{t}/c$
(
 $c$
is the polar radius of the oblates). (f) Standard deviation of the particle angular velocities in the directions parallel and perpendicular to gravity.

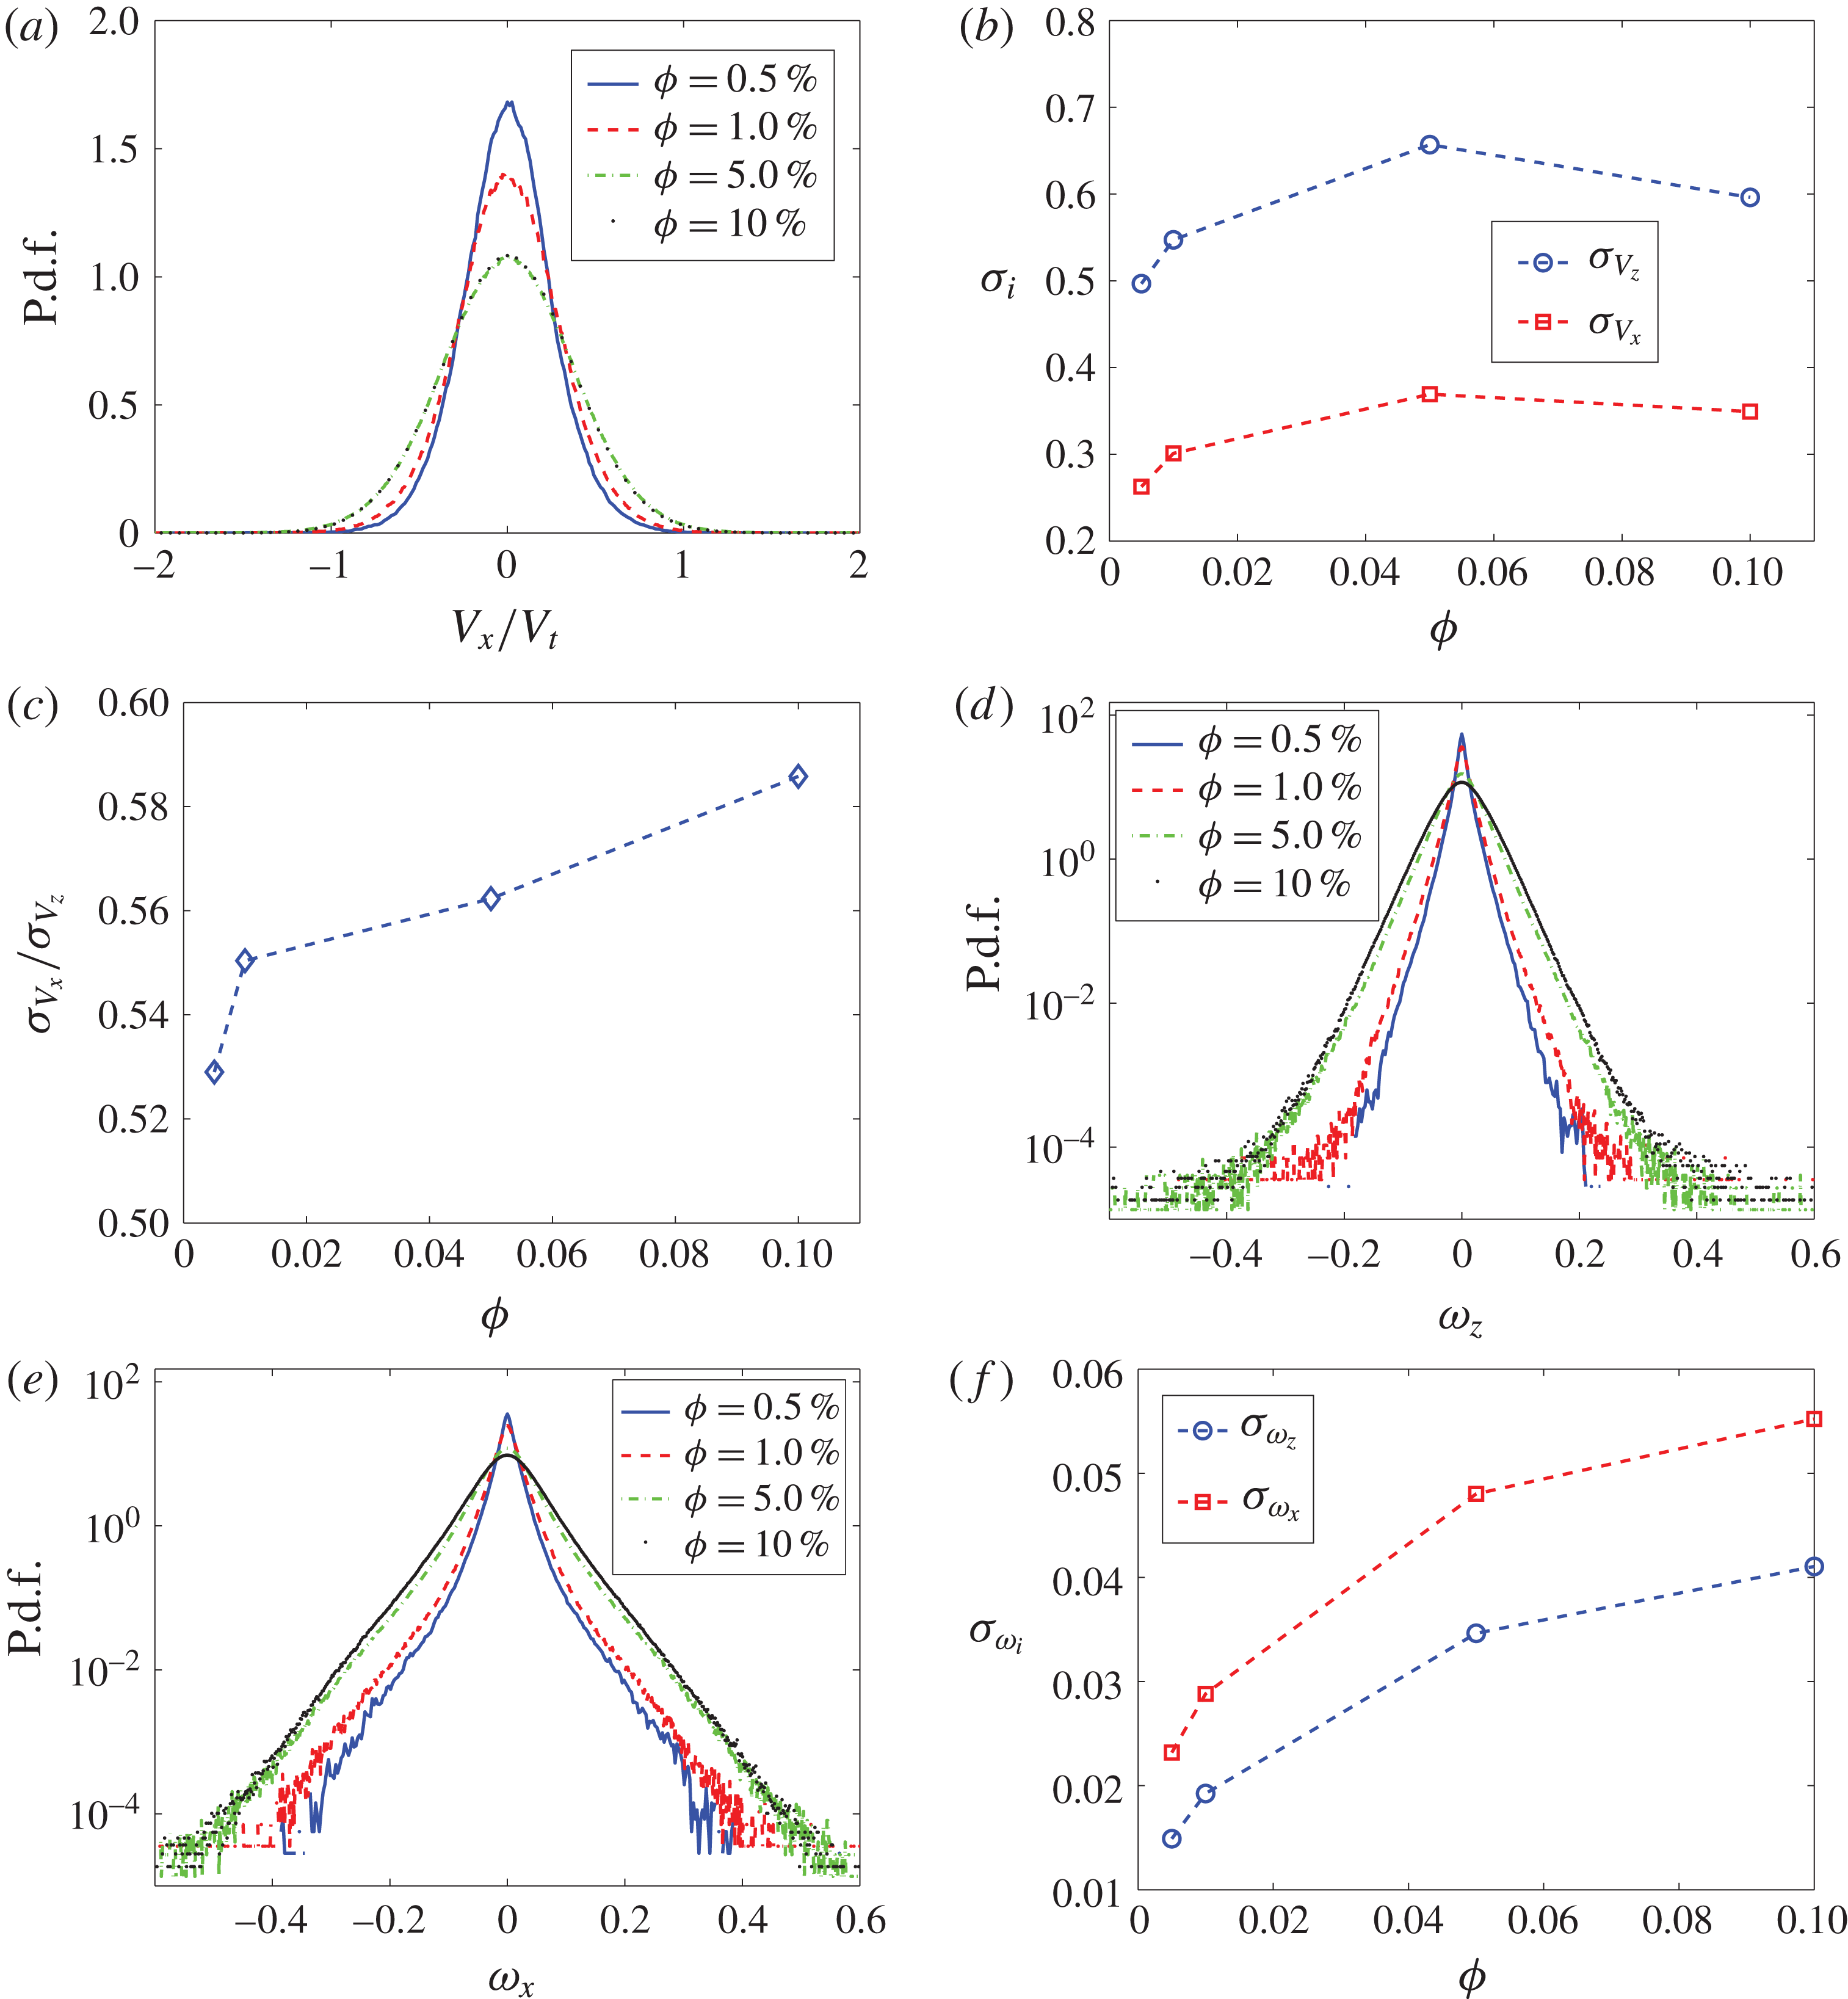
The probability density function of the horizontal component of the particle velocity in the plane perpendicular to gravity is reported in figure 7(a). For the sake of simplicity, we define this component of the velocity as
 $V_{x}$
(note that at this stage of the simulation, most particles are found within the columnar structure and hence, the horizontal velocity is symmetric around the direction of gravity). The p.d.f.s of
 $V_{x}/V_{t}$
are similar to normal distributions centred around
 $\langle V_{x}\rangle \sim 0$
, with skewness
 $S\sim 0$
and flatness
 $F$
slightly larger than
 $3$
, for all
 $\unicode[STIX]{x1D719}$
. On the other hand, the standard deviation
 $\unicode[STIX]{x1D70E}_{V_{x}}$
increases until
 $\unicode[STIX]{x1D719}=5\,\%$
. For the more dilute cases, the fact that both
 $\langle V_{x}\rangle \sim 0$
and
 $S\sim 0$
indicate that there is a constant inflow/outflow of particles to/from the columnar structure.
The standard deviation
 $\unicode[STIX]{x1D70E}_{V_{x}}$
as function of
 $\unicode[STIX]{x1D719}$
is shown in figure 7(b), together with
 $\unicode[STIX]{x1D70E}_{V_{z}}$
. It is interesting that both
 $\unicode[STIX]{x1D70E}_{V_{x}}$
and
 $\unicode[STIX]{x1D70E}_{V_{z}}$
decrease after
 $\unicode[STIX]{x1D719}=5\,\%$
. This is probably an excluded volume effect as at this high
 $\unicode[STIX]{x1D719}$
, particles are more uniformly distributed and settle as a bulk. Next, we display the ratio
 $\unicode[STIX]{x1D70E}_{V_{x}}/\unicode[STIX]{x1D70E}_{V_{z}}$
(i.e. the anisotropy of the velocity fluctuations), see figure 7(c). Considering that for
 $1$
particle
 $\unicode[STIX]{x1D70E}_{V_{x}}/\unicode[STIX]{x1D70E}_{V_{z}}=0$
, we see a sharp increase of the ratio
 $\unicode[STIX]{x1D70E}_{V_{x}}/\unicode[STIX]{x1D70E}_{V_{z}}$
up to
 $1\,\%$
. Above
 $\unicode[STIX]{x1D719}=1\,\%$
, the dynamics is controlled by excluded volume and hindrance effects, and the increase of the anisotropy with
 $\unicode[STIX]{x1D719}$
becomes approximately linear.
Finally, we examine the particle angular velocities around the directions parallel (
 $z$
) and perpendicular (
 $x$
) to gravity, see the p.d.f.s of in figure 7(d,e). The angular velocities are normalized by
 $V_{t}/c$
. First of all, we observe that both p.d.f.s are centred around
 $\langle \unicode[STIX]{x1D714}_{x}\rangle =0$
and
 $\langle \unicode[STIX]{x1D714}_{z}\rangle =0$
. Concerning the p.d.f.s of
 $\unicode[STIX]{x1D714}_{z}$
we see that the standard deviation
 $\unicode[STIX]{x1D70E}_{\unicode[STIX]{x1D714}_{z}}$
increases substantially with
 $\unicode[STIX]{x1D719}$
(for
 $\unicode[STIX]{x1D719}=10\,\%$
 $\unicode[STIX]{x1D70E}_{\unicode[STIX]{x1D714}_{z}}$
is almost
 $3$
times that found for
 $\unicode[STIX]{x1D719}=0.5\,\%$
), the skewness
 $S$
is
 ${\sim}0$
, while the flatness
 $F$
is larger than
 $3$
and decreases from
 $10$
(
 $\unicode[STIX]{x1D719}=0.5\,\%$
) to
 $5.8$
(
 $\unicode[STIX]{x1D719}=10\,\%$
). In the
 $x$
direction, the standard deviation
 $\unicode[STIX]{x1D70E}_{\unicode[STIX]{x1D714}_{x}}$
also increases substantially with
 $\unicode[STIX]{x1D719}$
(
 $\unicode[STIX]{x1D70E}_{\unicode[STIX]{x1D714}_{x}}(\unicode[STIX]{x1D719}=0.5\,\%)$
is
 $42\,\%$
of
 $\unicode[STIX]{x1D70E}_{\unicode[STIX]{x1D714}_{x}}(\unicode[STIX]{x1D719}=10\,\%)$
),
 $S$
is again approximately
 $0$
and the flatness
 $F$
decreases from
 $16$
to
 $6$
. The comparison between
 $\unicode[STIX]{x1D70E}_{\unicode[STIX]{x1D714}_{x}}$
and
 $\unicode[STIX]{x1D70E}_{\unicode[STIX]{x1D714}_{z}}$
is shown in figure 7(f). Differently from the translational velocities, we observe that the fluctuations of angular velocities are larger in the direction perpendicular to gravity and that these increase more rapidly with the volume fraction
 $\unicode[STIX]{x1D719}$
. We see indeed in figure 3 that instantaneously many particles are inclined with respect to horizontal planes. These particles may be undergoing rotations around axes perpendicular to
 $g$
, while settling with an average pitch angle.
An isolate oblate with
 $Ga=60$
falls with its broad side perpendicular to the direction of gravity. The orientation vector, defined by the direction of the particle symmetry axis, is hence
 $[O_{x},O_{y},O_{z}]^{\text{T}}=[0,0,1]$
. This means that the pitch angle between the axis of symmetry and gravity is
 $0^{\circ }$
. Due to hydrodynamic and particle–particle interactions in suspensions the mean particle orientation changes. The p.d.f. of
 $|O_{z}|$
is shown for all
 $\unicode[STIX]{x1D719}$
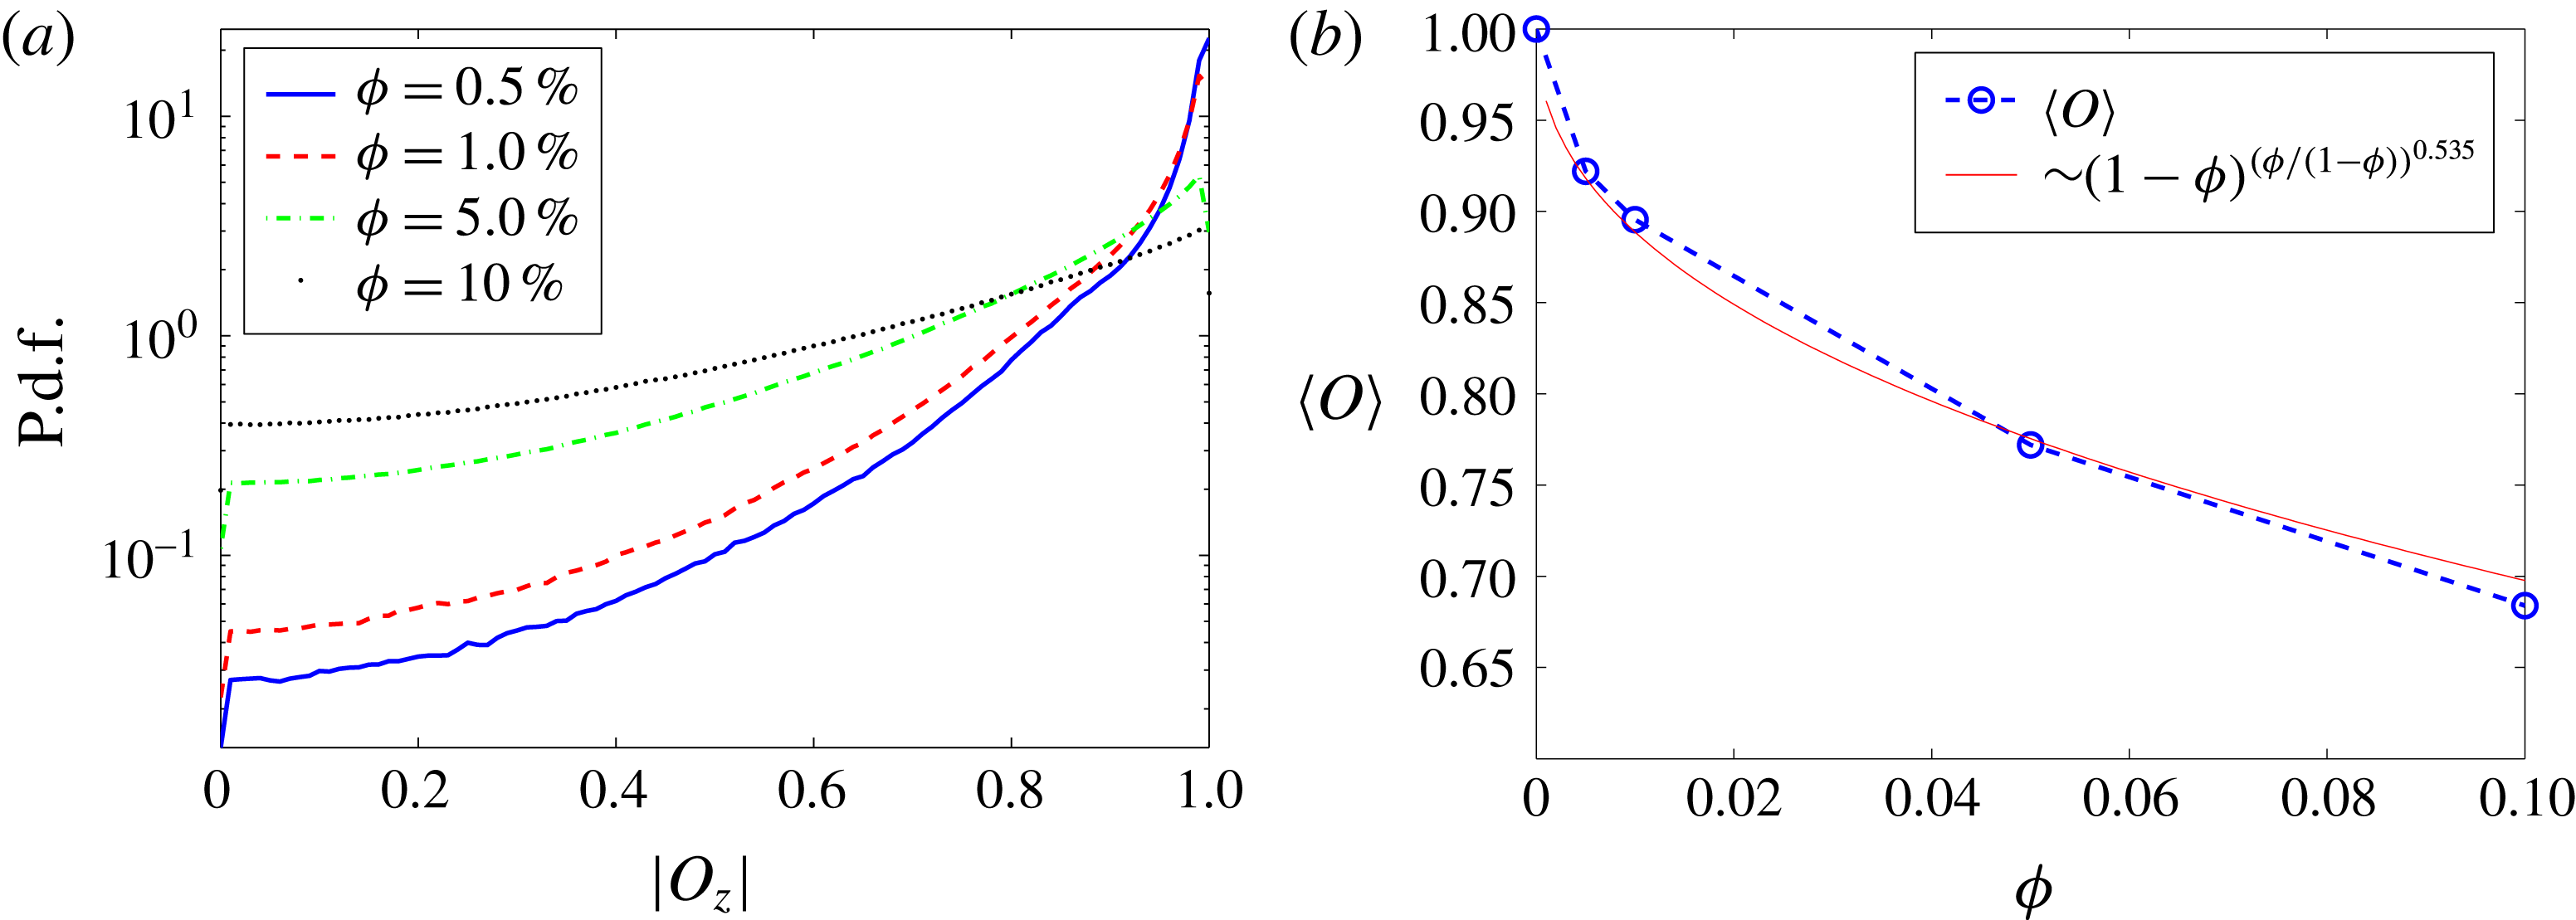
in figure 8(a). We first observe that the probability of having particles with
 $|O_{z}|\simeq 0$
(i.e. with the symmetry axis aligned with gravity) increases significantly with
 $\unicode[STIX]{x1D719}$
. For
 $\unicode[STIX]{x1D719}=10\,\%$
the probability of having
 $|O_{z}|\simeq 0$
is
 $1$
order of magnitude larger than for
 $\unicode[STIX]{x1D719}=0.5\,\%$
. On the contrary, the mean value of
 $|O_{z}|$
decreases with
 $\unicode[STIX]{x1D719}$
. The mean values
 $\langle |O_{z}|\rangle$
are shown in figure 8(b). For
 $\unicode[STIX]{x1D719}=0.5\,\%$
,
 $\langle |O_{z}|\rangle =0.922$
: on average particles are inclined by
 $22.8^{\circ }$
with respect to the horizontal plane. Increasing the volume fraction we find
 $\langle |O_{z}|\rangle =0.895$
(corresponding to an angle of
 $26.4^{\circ }$
),
 $0.765$
(
 $40^{\circ }$
) and
 $0.679$
(
 $47^{\circ }$
) for
 $\unicode[STIX]{x1D719}=1\,\%$
,
 $5\,\%$
,
 $10\,\%$
. The increase of the mean pitch angle with
 $\unicode[STIX]{x1D719}$
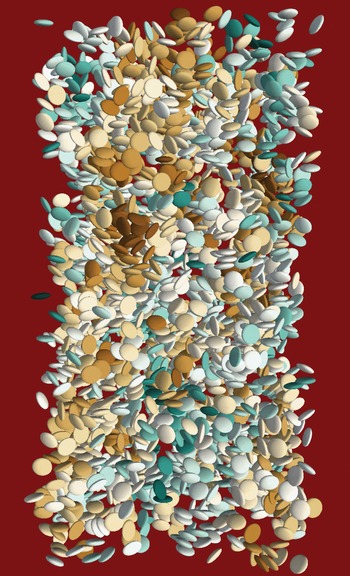
is an interesting effect and indicates that particles change their orientational configuration to better sample the available volume. An instantaneous snapshot of the settling particles for the case with
 $\unicode[STIX]{x1D719}=10\,\%$
is shown in figure 9. We see indeed that particles exhibit all possible orientations between
 $|O_{z}|=0$
and
 $1$
. Note also that some particles clusters can still be observed regardless of the high volume fraction.
(a) Probability density function of the absolute value of the particle orientation as it falls under gravity,
 $|O_{z}|$
. (b) Mean value of the orientation
 $\langle |O_{z}|\rangle$
as function of
 $\unicode[STIX]{x1D719}$
. The solid line represents an attempt to fit the data with an exponent that is itself a function of the volume fraction
 $\unicode[STIX]{x1D719}$
.

Instantaneous snapshot of the suspension with
 $\unicode[STIX]{x1D719}=10\,\%$
. For the sake of clarity,
 $25\,\%$
of the particles are shown in the first quarter of the computational domain.

Since the change in
 $|O_{z}|$
is an excluded volume effect, we believe that it should be described by a function that depends directly on the volume fraction
 $\unicode[STIX]{x1D719}$
and on the remaining parameters,
 $Ga,R$
and
 $AR$
, only via some coefficients. Therefore we also report in figure 8(b) the function
 $$\begin{eqnarray}\displaystyle f(\unicode[STIX]{x1D719})=(1-\unicode[STIX]{x1D719})^{[\unicode[STIX]{x1D719}/(1-\unicode[STIX]{x1D719})]^{0.535}}, & & \displaystyle\end{eqnarray}$$
that is shown to fit our data sufficiently well. This observation can have implications for the modelling of settling suspensions.
It must be noted that if a single oblate is constrained to fall with a finite pitch angle (
 $O_{z}<1$
), it will reach a terminal velocity larger than that for
 $O_{z}=1$
. We hence decided to perform an additional simulation of an isolated oblate settling with the mean pitch of the
 $\unicode[STIX]{x1D719}=0.5\,\%$
case (
 $O_{z}=0.922$
or
 $22.8^{\circ }$
) to see how the terminal velocity
 $V_{t}$
of an inclined particle compares to
 $\langle V_{z}\rangle$
. We find that
 $V_{x}/V_{t}=0.41$
and
 $V_{z}/V_{t}=1.03$
. The increase of the falling speed is limited, significantly lower than that of the suspension, showing again the importance of particle-pair interactions. Instead, the drift speed is about
 $1.6\unicode[STIX]{x1D70E}_{V_{x}}$
(
 $\unicode[STIX]{x1D719}=0.5\,\%$
). This indicates that although particles in dilute suspensions settle with a mean pitch angle of approximately
 $23^{\circ }$
, they hardly reach horizontal velocities equal to the drift speed. Consequently it is difficult for these particles to leave the columnar structure (which is hence a stable structure).
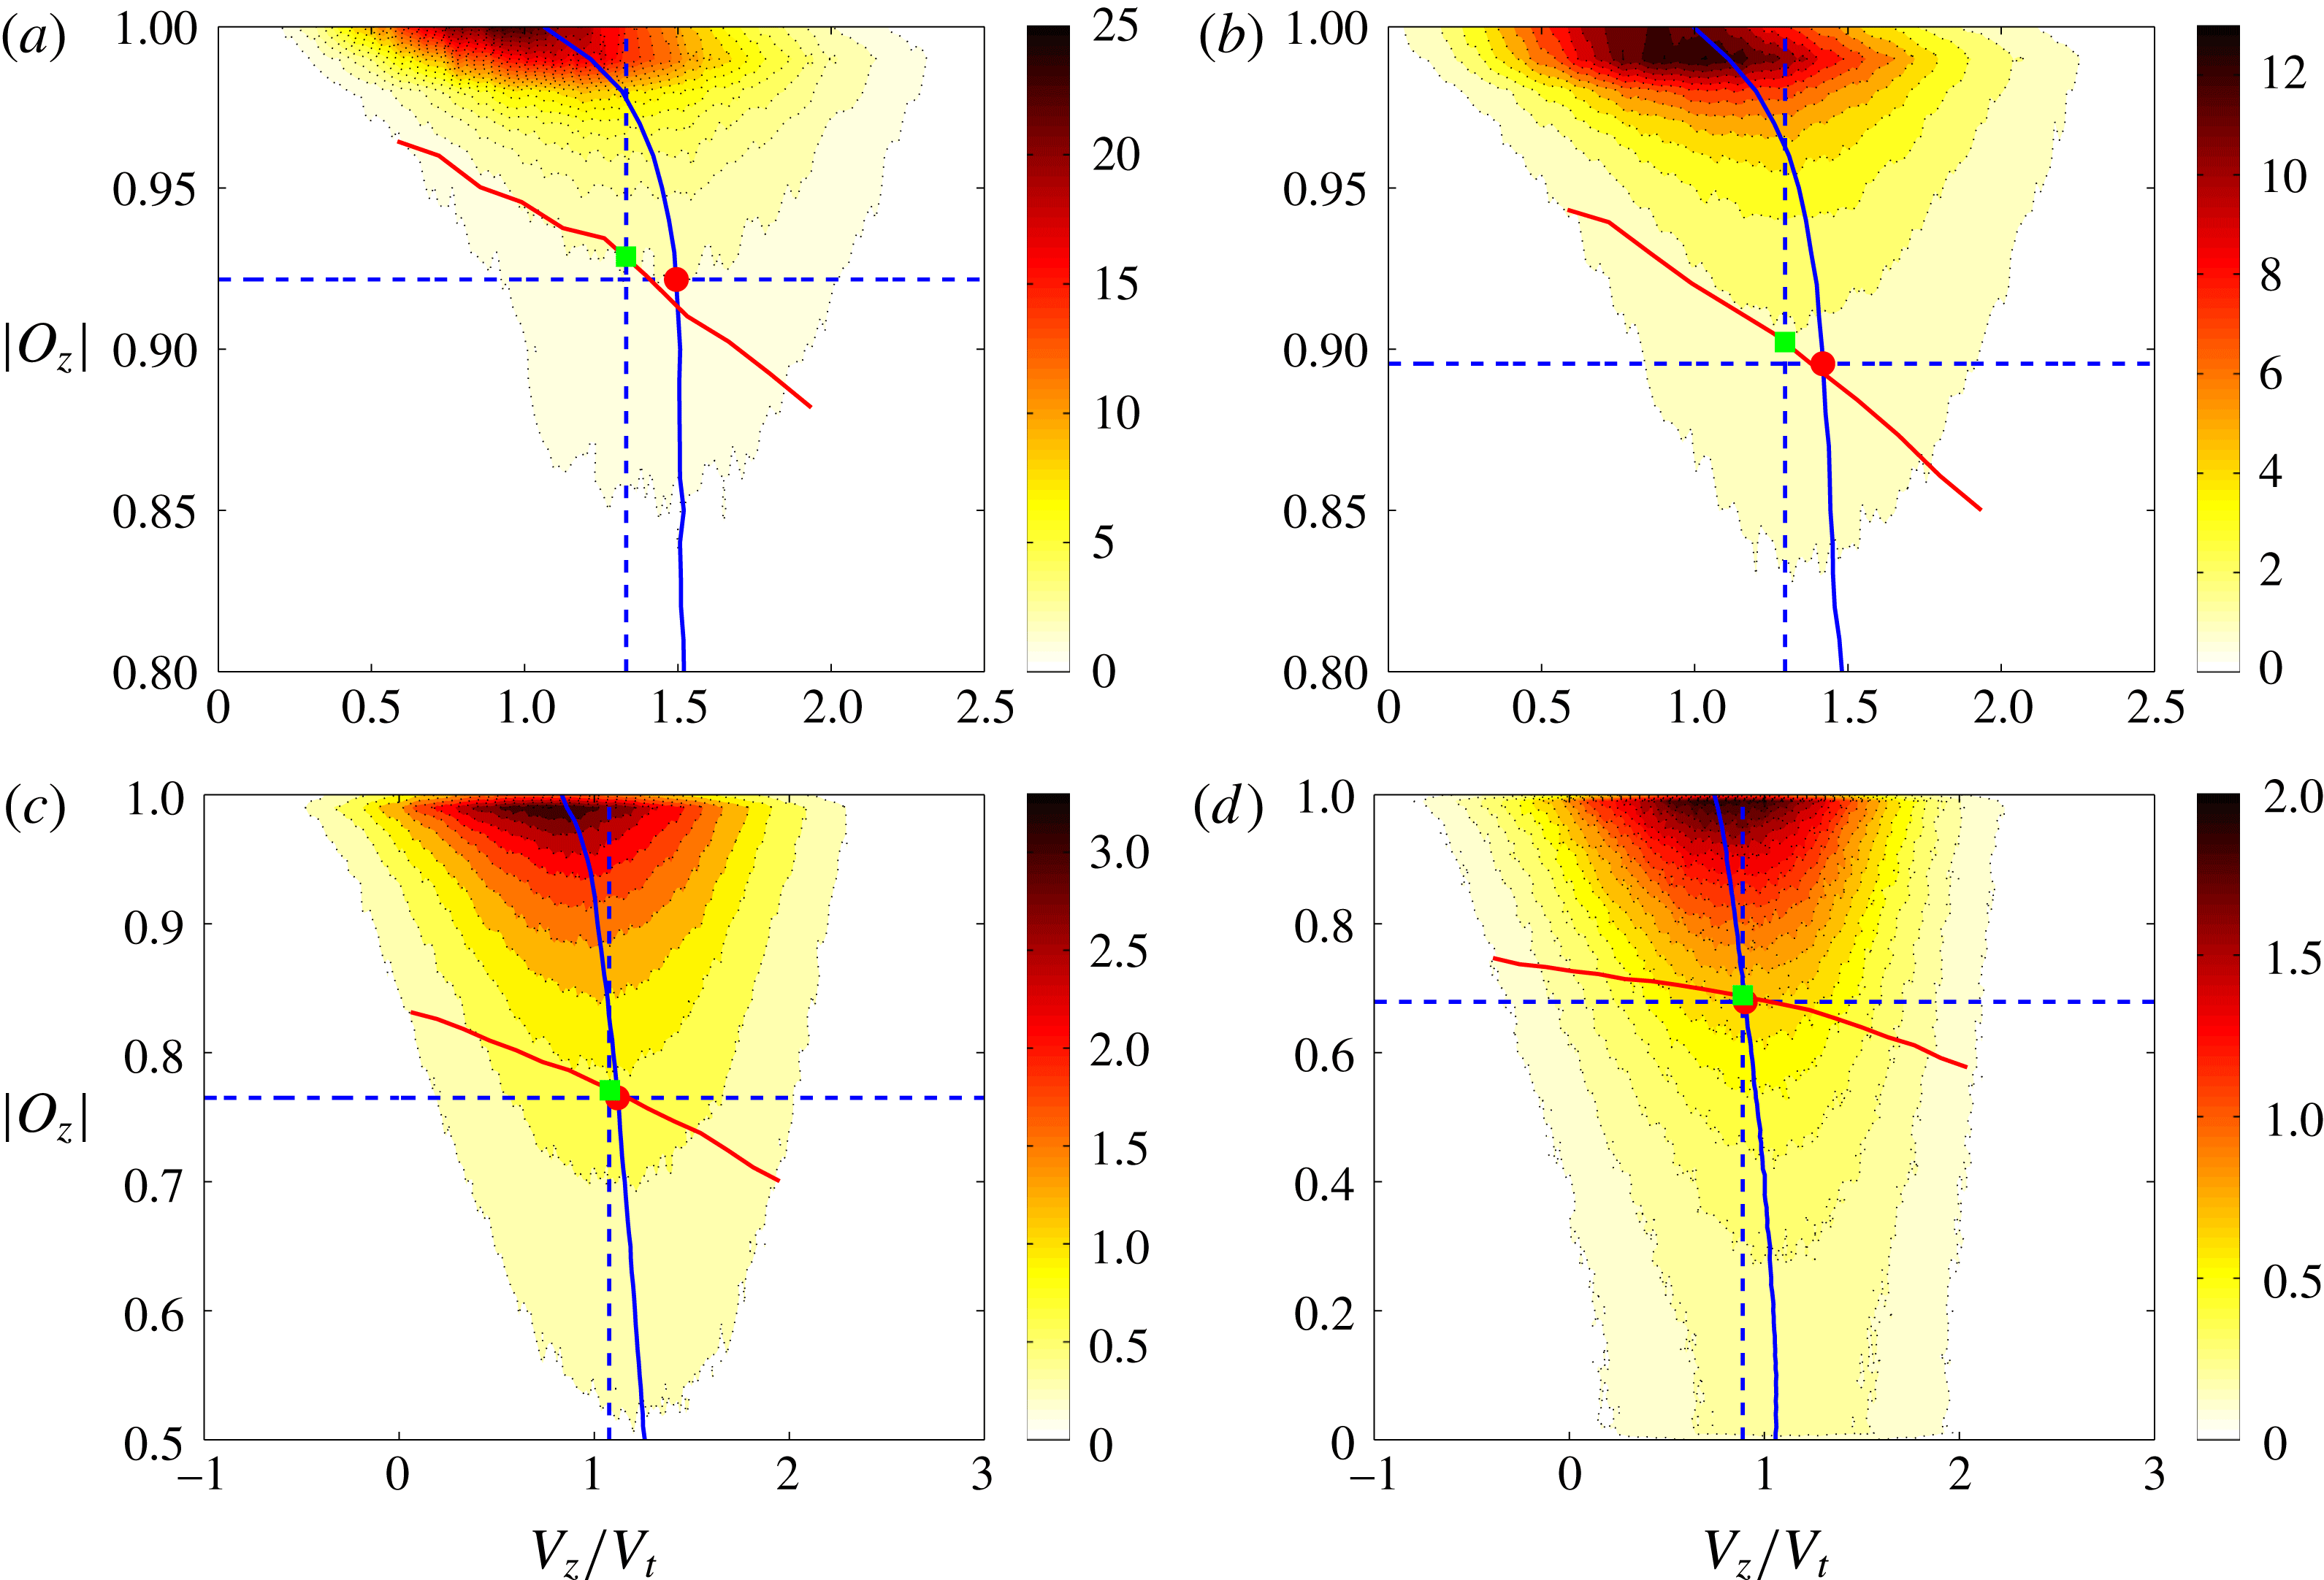
To conclude this section we report in figure 10(a–d) the joint probability density functions
 $J$
of particle settling speed
 $V_{z}/V_{t}$
and orientation
 $|O_{z}|$
for
 $\unicode[STIX]{x1D719}=0.5\,\%,1\,\%,5\,\%$
and
 $10\,\%$
. We also show the mean values of
 $V_{z}/V_{t}$
and
 $|O_{z}|$
that we found for the suspension, indicated by dashed lines. The solid blue and red lines in the plots represent the mean
 $V_{z}/V_{t}$
and
 $|O_{z}|$
obtained by conditioned averages of
 $J(V_{z}/V_{t},|O_{z}|)$
 $$\begin{eqnarray}\displaystyle & \displaystyle \langle V_{z}/V_{t}\mid |O_{z}|\rangle =\int _{-\infty }^{\infty }V_{z}J(V_{z}/V_{t}\mid |O_{z}|)\,\text{d}V_{z}, & \displaystyle\end{eqnarray}$$
 $$\begin{eqnarray}\displaystyle & \displaystyle \langle |O_{z}|\mid V_{z}/V_{t}\rangle =\int _{0}^{1}|O_{z}|J(|O_{z}|\mid V_{z}/V_{t})\,\text{d}|O_{z}|. & \displaystyle\end{eqnarray}$$
For
 $\unicode[STIX]{x1D719}=0.5\,\%$
and
 $1\,\%$
, we find that
 $\langle V_{z}/V_{t}\mid |O_{z}|\rangle$
increases from about
 $1$
at
 $|O_{z}|=1$
to an almost asymptotic value of
 $1.5$
. Hence, particles settling with an inclination
 ${\geqslant}\cos ^{-1}\langle |O_{z}|\rangle$
fall on average with speeds that are
 $12\,\%$
larger than
 $\langle V_{z}\rangle$
. In particular, we find
 $\langle V_{z}/V_{t}\mid |O_{z}|=\langle |O_{z}|\rangle \rangle =1.49$
and
 $1.42$
for
 $\unicode[STIX]{x1D719}=0.5\,\%,1\,\%$
(red circles). Concerning
 $\langle |O_{z}|\mid V_{z}/V_{t}\rangle$
we see that it decreases almost linearly with
 $V_{z}/V_{t}$
. Particles with larger
 $V_{z}/V_{t}$
fall on average with smaller
 $\langle |O_{z}|\rangle$
(i.e. more inclined with respect to the horizontal plane). The values found at speeds equal to
 $\langle V_{z}/V_{t}\rangle$
are
 $1\,\%$
larger than
 $\langle |O_{z}|\rangle$
(green squares).
Similar observations apply also to the remaining cases, those at higher
 $\unicode[STIX]{x1D719}$
. As expected, for all
 $|O_{z}|$
,
 $\langle V_{z}/V_{t}\mid |O_{z}|\rangle$
decreases with
 $\unicode[STIX]{x1D719}$
. Specifically,
 $\langle V_{z}/V_{t}\mid |O_{z}|=\langle |O_{z}|\rangle \rangle =1.12$
and
 $0.90$
for
 $\unicode[STIX]{x1D719}=5{-}10\,\%$
, approximately
 $4\,\%$
less than
 $\langle V_{z}\rangle /V_{t}$
. For
 $\langle |O_{z}|\mid V_{z}/V_{t}\rangle$
we again observe values that are
 $1\,\%$
larger than
 $\langle |O_{z}|\rangle$
.
Joint probability density functions of the settling speed
 $V_{z}/V_{t}$
, and the absolute value of the orientation
 $|O_{z}|$
, for increasing volume fraction
 $\unicode[STIX]{x1D719}$
in panels (a–d). The dashed lines correspond to the mean
 $V_{z}/V_{t}$
and
 $|O_{z}|$
. The red circles correspond to the mean
 $V_{z}/V_{t}$
conditioned to
 $|O_{z}|=\langle |O_{z}|\rangle$
of the suspension. The green squares correspond to the mean
 $|O_{z}|$
conditioned to
 $V_{z}=\langle V_{z}\rangle$
of the suspension. The conditioned averaged values for
 $\langle V_{z}/V_{t}\mid |O_{z}|\rangle$
and
 $\langle |O_{z}|\mid V_{z}/V_{t}\rangle$
are showed by the blue and red curves.

Summarizing, from the joint p.d.f.s of particle settling speeds and falling orientation, we find that on average particles settling with higher velocities tend to fall with their axis more inclined with respect to the direction of gravity. Hence, as particles interact through their wakes, eventually forming clusters, they tend to increase their pitch angle.
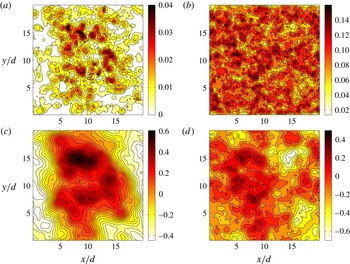
Instantaneous particle concentration averaged over the settling (
 $z$
-) direction for
 $\unicode[STIX]{x1D719}=1\,\%$
(a) and
 $10\,\%$
(b). Instantaneous vertical component of the fluid velocity averaged over the settling direction for
 $\unicode[STIX]{x1D719}=1\,\%$
(c) and
 $10\,\%$
(d). These statistics are calculated at a single time step towards the end of the simulation (
 $t\sim 182\unicode[STIX]{x1D70F}_{p}$
and
 ${\sim}42\unicode[STIX]{x1D70F}_{p}$
for
 $\unicode[STIX]{x1D719}=1\,\%$
and
 $10\,\%$
).

3.3 Fluid-phase velocity statistics
Finally, we look at the statistics of the fluid-phase velocity. Figure 11(a,b) reports the instantaneous particle concentration averaged over the settling direction, whereas figure 11(c,d) shows the instantaneous vertical component of the fluid velocity, also averaged along the
 $z$
-direction. For these statistics we choose a single time step towards the end of the simulation (
 $t\sim 182\unicode[STIX]{x1D70F}_{p}$
and
 ${\sim}42\unicode[STIX]{x1D70F}_{p}$
for
 $\unicode[STIX]{x1D719}=1\,\%$
and
 $10\,\%$
). For
 $\unicode[STIX]{x1D719}=1\,\%$
, we observe that most particles accumulate around the centre of the computational domain; see figure 11(a). Within this columnar structure, particles settle substantially faster than
 $V_{t}$
, and due to the no-slip boundary condition, the fluid surrounding the particles is forced to move in the same direction (positive
 $z$
-direction). Indeed, in figure 11(c) we see that the fluid speed
 $U_{z}$
is strongly positive in the same regions, with maxima at the locations of higher concentration. The highest fluid speed in the settling direction is almost of the order of the terminal velocity (
 $\max (U_{z})\simeq 0.6V_{t}$
). Note that due to the zero volume flux condition, in the locations depleted of particles the fluid moves in the direction opposite to gravity with non-negligible speeds (
 $\min (U_{z})\simeq -0.4$
). This contributes to the hindrance effect. Similar results are found for
 $\unicode[STIX]{x1D719}=0.5\,\%$
.
In figure 11(b,d) we show instead the mean particle concentration and mean fluid speed for
 $\unicode[STIX]{x1D719}=10\,\%$
. The volume fraction is relatively high and particles are almost uniformly distributed in the domain. The locations of high positive fluid speed cannot be easily related to the positions of high concentration. However, we still observe that where the particle concentration is lower, the mean fluid speed is large and negative (i.e. rising fluid). So, for
 $\unicode[STIX]{x1D719}=10\,\%$
the maximum positive
 $U_{z}$
is reduced (
 $\simeq 0.3V_{t}$
), while the rising fluid becomes faster (
 $\min (U_{z})\simeq -0.7$
) leading to an increased hindrance effect.
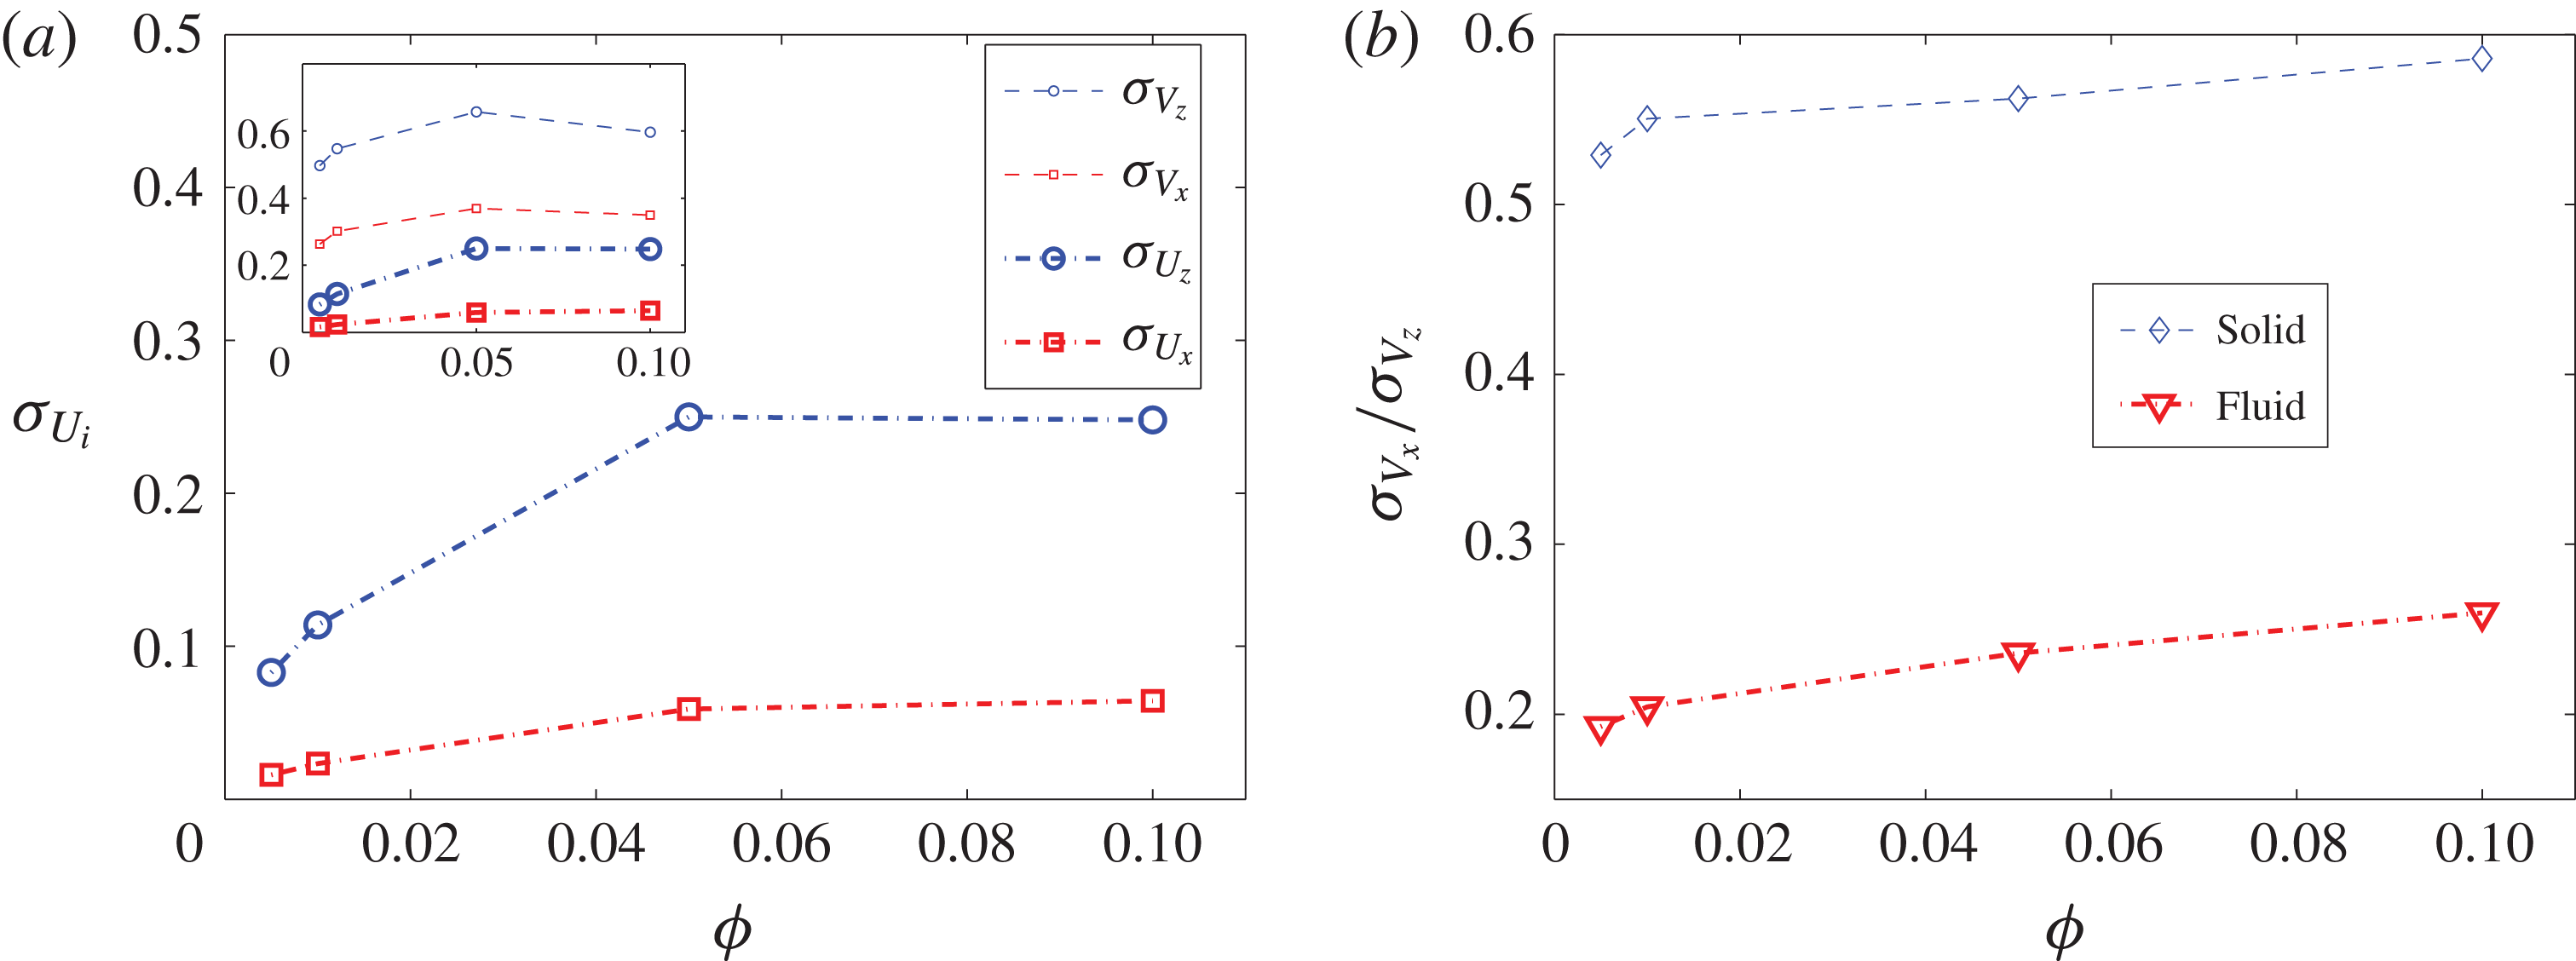
Last, we show in figure 12(a,b) the standard deviation of the vertical and horizontal components of the fluid velocity,
 $\unicode[STIX]{x1D70E}_{U_{z}}$
and
 $\unicode[STIX]{x1D70E}_{U_{x}}$
, and the velocity fluctuations anisotropy,
 $\unicode[STIX]{x1D70E}_{U_{x}}/\unicode[STIX]{x1D70E}_{U_{z}}$
, for all
 $\unicode[STIX]{x1D719}$
. We see that both
 $\unicode[STIX]{x1D70E}_{U_{z}}$
and
 $\unicode[STIX]{x1D70E}_{U_{x}}$
increase with
 $\unicode[STIX]{x1D719}$
. However, for
 $\unicode[STIX]{x1D70E}_{U_{z}}$
an approximately constant value of
 $0.25V_{t}$
is reached after
 $\unicode[STIX]{x1D719}=5\,\%$
. The standard deviations of the fluid velocities are substantially smaller than those of the particles, (especially in the horizontal direction), for the smaller volume fractions; see the inset of figure 12(a). The difference is progressively reduced as
 $\unicode[STIX]{x1D719}$
increases. For example, for
 $\unicode[STIX]{x1D719}=0.5\,\%$
we find that
 $\unicode[STIX]{x1D70E}_{U_{z}}=0.17\unicode[STIX]{x1D70E}_{V_{z}}$
, while for
 $\unicode[STIX]{x1D719}=10\,\%$
,
 $\unicode[STIX]{x1D70E}_{U_{z}}=0.42\unicode[STIX]{x1D70E}_{V_{z}}$
. This indicates that at high volume fractions, the dynamics of both phases is governed mostly by excluded volume effects. Regarding the anisotropy of fluid velocity fluctuations,
 $\unicode[STIX]{x1D70E}_{U_{x}}/\unicode[STIX]{x1D70E}_{U_{z}}$
, we see from figure 12(b) that it also increases with
 $\unicode[STIX]{x1D719}$
. As for the solid phase, the increase with
 $\unicode[STIX]{x1D719}$
is almost linear.
(a) Standard deviation of the vertical and horizontal components of the fluid velocity,
 $\unicode[STIX]{x1D70E}_{U_{z}}$
and
 $\unicode[STIX]{x1D70E}_{U_{x}}$
, for all
 $\unicode[STIX]{x1D719}$
. In the inset, the standard deviation of the particles velocities are also shown. (b) Anisotropy of fluid velocity fluctuations,
 $\unicode[STIX]{x1D70E}_{U_{x}}/\unicode[STIX]{x1D70E}_{U_{z}}$
, together with those of the solid phase, for all
 $\unicode[STIX]{x1D719}$
.

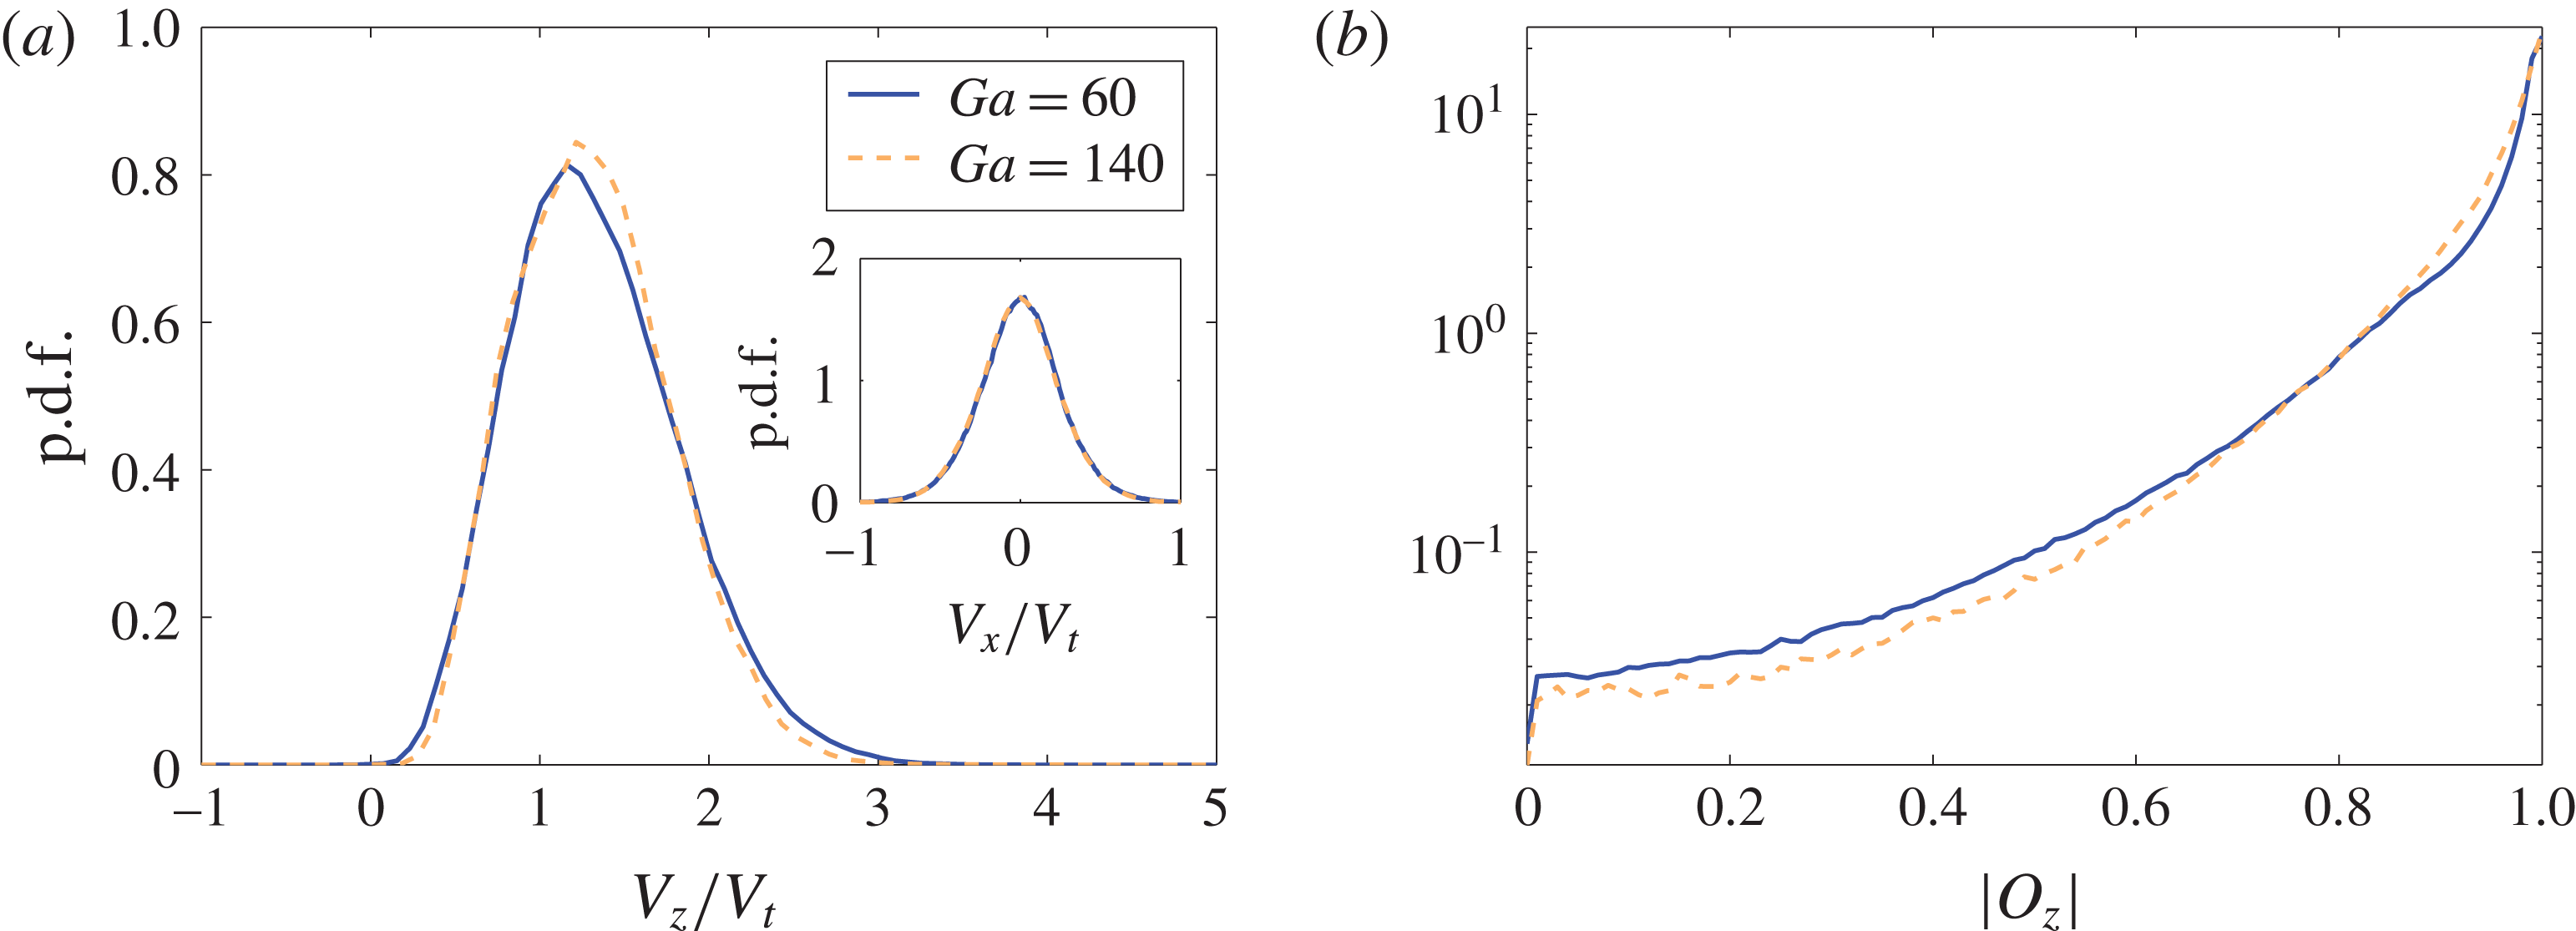
(a) The p.d.f.s of the settling speed,
 $V_{z}/V_{t}$
, for the cases with
 $Ga=60$
and
 $140$
, at constant
 $\unicode[STIX]{x1D719}=0.5\,\%$
. The inset shows the p.d.f.s of the particle lateral velocities,
 $V_{x}/V_{t}$
, for the same cases. (b) The p.d.f.s of the absolute value of the particle orientation
 $|O_{z}|$
for the cases with
 $Ga=60$
and
 $140$
, both at
 $\unicode[STIX]{x1D719}=0.5\,\%$
.

4 Effect of Galileo number
In this section, we present some results on the effect of the Galileo number
 $Ga$
on the suspension dynamics. In particular, we consider the reference case with
 $\unicode[STIX]{x1D719}=0.5\,\%$
and increase
 $Ga$
from
 $60$
to
 $140$
. At this
 $Ga$
, the motion of an isolated oblate is a periodic oscillation with, on average, a fully vertical fall (Chrust Reference Chrust2012; Ardekani et al.
Reference Ardekani, Costa, Breugem and Brandt2016). The different falling regime could hence lead to a different collective behaviour. The investigation of even higher
 $Ga$
requires a larger resolution and is hence left for future studies. The settling of an oblate particle depends on
 $3$
parameters, the density ratio
 $R$
, the Galileo number
 $Ga$
and the aspect ratio
 $AR$
. In this additional case we only increase
 $Ga$
without modifying the other two parameters. The statistics are collected after a statistically steady state is reached, and normalized by the terminal speed
 $V_{t}$
obtained from the simulation of an isolated settling oblate with
 $Ga=140$
. Cases at
 $Ga=60$
and
 $140$
are hence compared.
In figure 13(a) we show the p.d.f.s of the settling speed,
 $V_{z}/V_{t}$
, for the cases at different
 $Ga$
. We see that the p.d.f.s are similar for both Galileo numbers. Also the mean value of the settling speed,
 $\langle V_{z}/V_{t}\rangle$
is similar for both cases. However, for the larger
 $Ga$
the standard deviation of the settling speed and its skewness are reduced, as reported in table 2. In the inset of figure 13(a) we also show the p.d.f.s of the particle speed in the direction perpendicular to gravity. Remarkably we find that the curves are almost perfectly overlapping. This indicates that particle–particle interactions through their wakes and clustering dominate the lateral dynamics of particles in the suspension.
In the last two columns of table 2, we report the standard deviations of the particles angular velocities parallel and perpendicular to gravity. These are substantially larger for the larger
 $Ga$
. This is probably related to the combined effect of particle–particle interactions and the intrinsic oscillatory motion of oblate particles at
 $Ga=140$
. However, it is interesting to observe that the p.d.f.s of the particle orientation
 $|O_{z}|$
are similar for both
 $Ga$
, with mean values of
 $0.922$
(
 $Ga=60$
) and
 $0.920$
(
 $Ga=140$
), see figure 13(b). These correspond to mean pitch angles of
 $22.8^{\circ }$
and
 $23.0^{\circ }$
. The similarity between this values supports our previous statement on the importance of excluded volume effects on
 $\langle |O_{z}|\rangle$
.
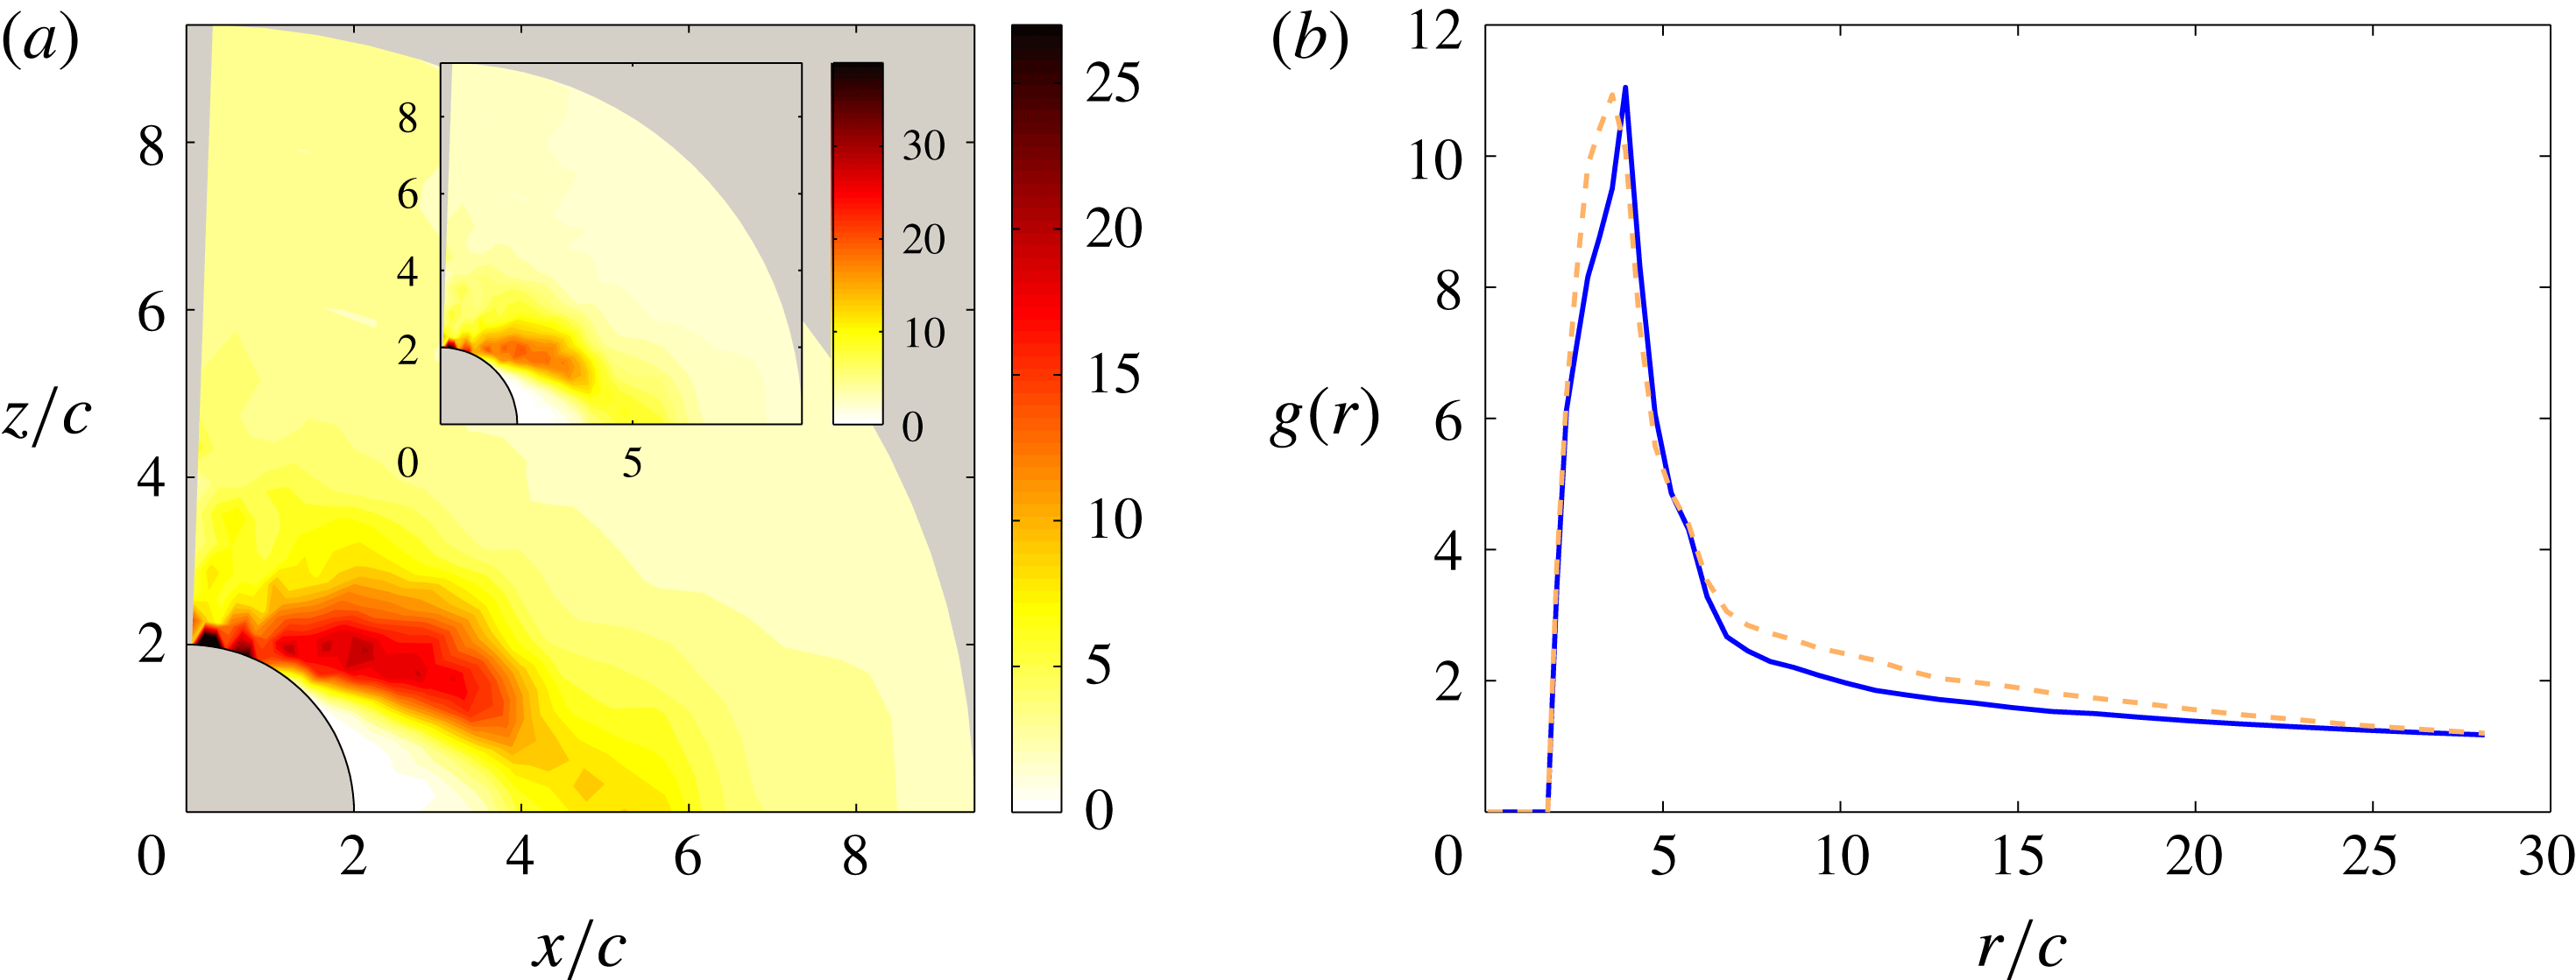
(a) Pair distribution function
 $P(r,\unicode[STIX]{x1D713})$
for the case with
 $\unicode[STIX]{x1D719}=0.5\,\%$
and
 $Ga=140$
. (b) The radial distribution function
 $g(r)$
for
 $Ga=60$
and
 $140$
.

Comparison between the statistics for
 $Ga=60$
and
 $140$
: mean value of the settling speed,
 $\langle V_{z}\rangle$
, with its standard deviation,
 $\unicode[STIX]{x1D70E}_{V_{z}}$
, and its skewness,
 $S_{V_{z}}$
; standard deviations of the lateral speed,
 $\langle V_{x}\rangle$
, and of the angular velocities in the directions parallel and perpendicular to gravity,
 $\unicode[STIX]{x1D70E}_{\unicode[STIX]{x1D714}_{z}}$
and
 $\unicode[STIX]{x1D70E}_{\unicode[STIX]{x1D714}_{x}}$
. Velocities are normalized by
 $V_{t}$
, while angular velocities are normalized by
 $V_{t}/c$
.

We finally compare particle-pair statistics for the 2 different
 $Ga$
. In figure 14(a) we report the pair distribution function
 $P(r,\unicode[STIX]{x1D713})$
for the case with
 $Ga=140$
(to be compared with figure 5
a). We observe that the probability of finding a particle pair increases between
 $\unicode[STIX]{x1D713}=0^{\circ }$
and
 $\unicode[STIX]{x1D713}=73^{\circ }$
. The maximum of
 $P(r,\unicode[STIX]{x1D713})$
is shifted closer to the
 $z$
-axis, at
 $r=2.02c$
and
 $\unicode[STIX]{x1D713}=6^{\circ }$
(note that for
 $Ga=60$
the maximum is at
 $\unicode[STIX]{x1D713}=17^{\circ }$
). On the contrary,
 $P(r,\unicode[STIX]{x1D713})$
reduces for angles larger than
 $74^{\circ }$
. Hence, the clusters tend to be more vertically aligned (i.e. particle pairs are more piled up on top of each other with respect to the case with
 $Ga=60$
). Since particle clusters are more vertically aligned, these particles tend to settle often with the same velocity, and with less fluctuations. As a consequence, the standard deviation and the skewness of the p.d.f. of
 $V_{z}/V_{t}$
are reduced in comparison to the results for
 $Ga=60$
, as shown in figure 13(a) and in table 2.
In figure 14(b) we also show the radial distribution function
 $g(r)$
for the two
 $Ga$
. The curves are similar, although it can be noted that for
 $Ga=140$
,
 $g(r)$
is larger for radial distances smaller than
 $\simeq 4c$
(at which the maximum of
 $g(r)$
is located). This is related to the fact that the vertical clustering is enhanced, as previously discussed. Remarkably, however, the maximum of
 $g(r)$
occurs at approximately the same radial distance, and is similar for both
 $Ga$
. To conclude, we also calculated the fraction of the total number of oblates falling in clusters of
 $N$
particles, together with their mean settling speed. The results are similar to those reported in figure 6(a,b), although the mean speeds of clusters of
 $N=2$
,
 $3$
and
 $4$
particles are reduced by
 $1{-}2\,\%$
, whereas the mean speed of isolated particles (
 $N=1$
) is the same.
5 Final remarks
We have studied the sedimentation of suspensions of oblate particles in quiescent fluid at finite
 $Re_{t}$
. We chose the aspect ratio
 $AR=1/3$
, density ratio
 $R=1.02$
, Galileo number
 $Ga=60$
(based on the diameter of a sphere with equal volume), and four volume fractions
 $\unicode[STIX]{x1D719}=0.5\,\%,1\,\%,5\,\%$
and
 $10\,\%$
. The single particle case was also simulated and at this combination of
 $R$
and
 $Ga$
, the particle settles with its broad side perpendicular to the direction of gravity with a straight, steady wake. The orientation vector of the isolated oblate is hence
 $[O_{x},O_{y},O_{z}]=[0,0,1]$
(i.e. the pitch angle with respect to the plane perpendicular to gravity is
 $0^{\circ }$
).
The average settling speed of a suspension changes with the particle volume fraction as the results of the competition of two different physical mechanisms: (i) the hindrance effect, which is more pronounced in higher volume fractions and tends to reduce the average settling speed; and (ii) the hydrodynamics of particle-pair interactions, e.g. drafting–kissing–tumbling, which tends to increase the average speed and form piles of particles. We report that, unlike the case of spherical particles of equal
 $Ga$
, the mean settling speed of the oblate particles suspension,
 $\langle V_{z}\rangle /V_{t}$
, increases with
 $\unicode[STIX]{x1D719}$
in dilute conditions. For
 $\unicode[STIX]{x1D719}=0.5\,\%{-}1\,\%$
; the mean settling speed is approximately
 $30\,\%$
larger than the terminal velocity of an isolated oblate. Note that for suspensions of spheres it has been shown that
 $\langle V_{z}\rangle /V_{t}$
is always a decreasing function of
 $\unicode[STIX]{x1D719}$
for
 $Ga\sim 60$
(Richardson & Zaki Reference Richardson and Zaki1954b
; Yin & Koch Reference Yin and Koch2007; Uhlmann & Doychev Reference Uhlmann and Doychev2014). The mean settling speed becomes smaller than the terminal velocity
 $V_{t}$
only for
 $\unicode[STIX]{x1D719}>5\,\%$
. This implies that at lower volume fractions the hindrance effect is overcome by hydrodynamic and particle–particle interactions and this leads to an increase of
 $\langle V_{z}\rangle /V_{t}$
. Indeed, we have shown that in dilute conditions most particles are arranged at steady state in a columnar-like structure with a radius of about
 $20c$
, where
 $c$
is the oblate polar radius. Within this structure, particle clusters settle with velocities up to
 $4$
times the mean,
 $\langle V_{z}\rangle /V_{t}$
. Therefore, the probability density functions of
 $V_{z}/V_{t}$
display a clear positive skewness,
 $S_{V_{z}}\sim 0.4$
(i.e. many particles fall with speeds larger than the mean value). While
 $\langle V_{z}\rangle /V_{t}$
is reduced increasing the volume fraction, the velocity standard deviation
 $\unicode[STIX]{x1D70E}_{V_{z}}$
increases up to
 $\unicode[STIX]{x1D719}\sim 5\,\%$
, the skewness
 $S_{V_{z}}$
tends to
 $0$
and the flatness
 $F_{V_{z}}$
is always approximately
 $3$
. Additionally, within the columnar-like structure, the fluid is strongly dragged by the particles (due to the no-slip condition) and in the settling direction it reaches speeds almost of the order of
 $V_{t}$
(
 $\max (U_{z})\sim 0.6V_{t}$
).
To study the suspension microstructure, the pair and radial distribution functions are calculated. While no clustering is observed for spheres of same
 $Ga$
, the pair distribution function
 $P(\boldsymbol{r})$
is found to be large all around a reference particle and especially between
 $\unicode[STIX]{x1D713}\sim 0^{\circ }{-}80^{\circ }$
and
 $r/c\sim 2{-}5$
. The highest probability of finding a neighbour particle is at
 $r/c=2.02$
,
 $\unicode[STIX]{x1D713}\simeq 17^{\circ }$
for
 $\unicode[STIX]{x1D719}=0.5\,\%$
,
 $r/c=2.02$
,
 $\unicode[STIX]{x1D713}\simeq 10^{\circ }$
for
 $\unicode[STIX]{x1D719}=1\,\%$
, and around
 $r/c=2.02$
,
 $\unicode[STIX]{x1D713}\simeq 0^{\circ }{-}2^{\circ }$
for the highest volume fractions investigated. Hence, on average particles are almost piled up. The extent of clustering sharply decreases for
 $\unicode[STIX]{x1D719}>1\,\%$
as it is shown by the pair distribution function
 $P(\boldsymbol{r})$
and its angular average,
 $g(r)$
(the radial distribution function). The radial distribution function is found to be maximum around
 $r/c\simeq 4$
(i.e. regardless of the orientation, the highest probability of finding a particle pair is located at a separation distance of
 $4c$
). In the cases with lowest volume fractions, the particle distribution is found to be uncorrelated at distances larger than
 $20c$
, a distance of the order of the radius of the columnar structure. For the denser cases, the decorrelation of the structure occurs at shorter separations, at distances of the order of
 $6c$
. Using the definition of order parameter
 $\langle P_{2}\rangle (r)$
we have shown that for distances of approximately
 $2c$
particles are almost perfectly vertically aligned. Above
 $r/c>3$
particles are almost horizontally aligned (with a finite inclination with respect to the horizontal plane). The suspension structure becomes more isotropic for distances
 $r/c\geqslant 6$
in the denser cases and
 $r/c\geqslant 8$
in the more dilute cases.
We have also considered the particle lateral velocity as well as the angular velocities. The mean particle lateral speed
 $\langle V_{x}\rangle /V_{t}$
is approximately
 $0$
, while its standard deviation
 $\unicode[STIX]{x1D70E}_{V_{x}}$
increases with the volume fraction up to
 $\unicode[STIX]{x1D719}=5\,\%$
and is smaller than
 $\unicode[STIX]{x1D70E}_{V_{z}}$
. The anisotropy of the particle velocity fluctuations
 $\unicode[STIX]{x1D70E}_{V_{x}}/\unicode[STIX]{x1D70E}_{V_{z}}$
increases abruptly until
 $\unicode[STIX]{x1D719}=0.5\,\%$
and then approximately linearly with
 $\unicode[STIX]{x1D719}$
. From the p.d.f.s of angular velocities, we find that particles rotate more around the directions perpendicular to gravity. It is found that particles settle on average inclined with respect to the horizontal plane (the particle orientation with respect to the axis of symmetry,
 $|O_{z}|$
, is less than
 $1$
, where 1 corresponds to a pitch angle of
 $0^{\circ }$
). The mean pitch angle increases with
 $\unicode[STIX]{x1D719}$
from
 $22.8^{\circ }$
to
 $47^{\circ }$
(i.e.
 $|O_{z}|$
decreases with
 $\unicode[STIX]{x1D719}$
). A power-law fit that depends solely on the solid volume fraction
 $\unicode[STIX]{x1D719}$
and one coefficient is proposed. Computing the terminal speed of an isolated oblate settling with the mean pitch of the suspension with
 $\unicode[STIX]{x1D719}=0.5\,\%$
(
 $22.8^{\circ }$
) we find that the lateral velocity
 $V_{x}/V_{t}=0.41$
and the vertical only
 $V_{z}/V_{t}=1.03$
, significantly lower than that of the suspension, showing the importance of particle-pair interactions.
Finally, we have calculated the joint probability functions of particle settling speed and orientation. We used conditioned averages to show that particles settling with speeds larger than the mean
 $\langle V_{z}\rangle /V_{t}$
, have on average lower mean orientations (higher pitch angles).
With this study we have began to look at the effects of particle shape in sedimenting suspensions of inertial particles. In the future, it will be interesting to consider oblate and prolate particles of different aspect ratios and Galileo numbers. Here we have started to investigate the effects of changing the Galileo number. In particular, we have considered the reference case with
 $\unicode[STIX]{x1D719}=0.5\,\%$
and increased
 $Ga$
from
 $60$
to
 $140$
. We have found that the mean settling speed
 $\langle V_{z}\rangle /V_{t}$
is similar for both
 $Ga$
, although for
 $Ga=140$
there are less velocity fluctuations around the mean. The p.d.f.s of the velocity component perpendicular to gravity are almost overlapping for both
 $Ga$
. Finally, we have noted that the pair distribution function increases for angles between
 $\unicode[STIX]{x1D713}=0^{\circ }$
and
 $73^{\circ }$
, while it decreases for larger
 $\unicode[STIX]{x1D713}$
, in comparison to the case with
 $Ga=60$
. Hence, particle pairs/clusters are more vertically aligned. In future works, we plan to investigate Galileo numbers larger than
 $210$
. At this
 $Ga$
, isolated oblates fall on an oblique path with oscillations around the mean direction (Chrust Reference Chrust2012; Ardekani et al.
Reference Ardekani, Costa, Breugem and Brandt2016) and we can expect a large modification of clustering formation and extent. Indeed, for suspensions of spheres settling in quiescent fluid, clustering has been observed when
 $Ga>155$
(Uhlmann & Doychev Reference Uhlmann and Doychev2014), for which isolated spheres settle on oblique paths, a behaviour that has been found to be directly related to cluster formation.
Acknowledgements
This work was supported by the European Research Council Grant No. ERC-2013-CoG-616186, TRITOS, and by the Swedish Research Council (VR). Computer time provided by SNIC (Swedish National Infrastructure for Computing) and the support from the COST Action MP1305: Flowing matter are acknowledged.