INTRODUCTION
Cotton is an important economic crop and the main source of textile fibre in the world. Improving cotton fibre production continues to be the main goal in cotton breeding. The tetraploid species Gossypium hirsutum L. (n = 26, AD genome), also referred to as ‘Upland cotton’, accounts for 0·95 of the world's cotton fibre production (Zhang et al. Reference Zhang, Li, Wang and Chee2008). Dissecting the genetic basis of yield traits of Upland cotton is of great significance for guiding cotton yield breeding. However, cotton yield traits including seed cotton yield (SY), lint yield (LY), boll number per plant (BN), boll weight (BW), lint percentage (LP, calculated by dividing lint yield by seed cotton yield), lint index (LI, the fibre weight of seed cotton containing 100 seeds) and seed index (SI, the weight of 100 seeds) all belong to complicated quantitative traits controlled by quantitative trait locus/loci (QTL) and environment. At the same time, a significant negative correlation exists between yield and fibre quality. Therefore, it is increasingly difficult to simultaneously improve these traits using traditional breeding methods. The use of molecular marker technology to identify QTL for target traits and the application of QTL-linked or QTL-associated markers for marker-assisted selection (MAS) can help avoid environmental interference, effectively break the negative correlation among traits, and improve breeding efficiency.
Linkage mapping is an important traditional method for the analysis of plant quantitative traits, with the construction of high-density molecular linkage maps through limited parent hybridization and location of genes/QTL of target traits in specific linkage segments. To date, there have been a number of reports on QTL studies of cotton yield traits using linkage mapping in various mapping populations, which include F2 (Ren et al. Reference Ren, Guo and Zhang2002; Guo et al. Reference Guo, Ma, Zhu, Yi and Zhang2006; An et al. Reference An, Jenkins, Wu, Guo and McCarty2010), F2/F2:3 (Ulloa & Meredith Reference Ulloa and Meredith2000; Ulloa et al. Reference Ulloa, Saha, Jenkins, Meredith, McCarty and Stelly2005; He et al. Reference He, Lin, Zhang, Nie, Guo, Feng and Stewart2005, Reference He, Lin, Zhang, Nie, Guo, Zhang and Li2007; Li et al. Reference Li, Guo, Ma and Zhang2008; Qin et al. Reference Qin, Liu, Mei, Zhang and Guo2009; Xia et al. Reference Xia, Zhang, Liu, Jia, Zhao, Li and Wang2014), recombinant inbred lines (RILs) (Shen et al. Reference Shen, Guo, Lu, Zhu, Yuan and Zhang2007; Wang et al. Reference Wang, Guo, Zhu, Wu, Huang and Zhang2007a ; Wu et al. Reference Wu, Gutierrez, Jenkins, McCarty and Zhu2009; Yu et al. Reference Yu, Ulloa, Hoffman, Kohel, Pepper, Fang, Percy and Burke2014), backcross inbred lines (BILs) (Yu et al. Reference Yu, Zhang, Li, Yu, Zhai, Wu, Li, Fan, Song, Yang, Li and Zhang2013), RILs/immortalized F2 (Liu et al. Reference Liu, Wang, Guo, Qin, Wang, Zhang and Zhang2012), three-way cross-population (Zhang et al. Reference Zhang, Chen, Zhang, Liu, Wei and Zhang2010) and four-way cross-population (Qin et al. Reference Qin, Guo, Zhang and Zhang2008). These studies have laid an important foundation for analysing the genetic basis of cotton yield traits. However, among all the located QTL for cotton breeding target traits, approximately 0·80 of the previously reported QTL could not be confirmed in subsequent studies and few have actually been applied in breeding programmes (Guo et al. Reference Guo, Zhang, Ding, Zhu, Shen and Zhu2005; Rong et al. Reference Rong, Feltus, Waghmare, Pierce, Chee, Draye, Saranga, Wright, Wilkins, May, Smith, Gannaway, Wendel and Paterson2007; Shi et al. Reference Shi, Liu, Li, Shao and Yuan2007; Wang et al. Reference Wang, Liu, Wang, Zhang, Liu, Liu, Ma and Zhang2007b ; Lacape et al. Reference Lacape, Llewellyn, Jacobs, Arioli, Becker, Calhoun, Al-Ghazi, Liu, Palaï, Georges, Giband, de Assunção, Barroso, Claverie, Gawryziak, Jean, Vialle and Viot2010). This may be because most QTL were population-specific, and the genetic variation detected in a unique bi-parental population might not be shared with other genetic populations, or shared but fixed in the parental lines. In addition, limited genetic recombination in most populations used for linkage mapping makes it difficult to map QTL with a high resolution, which severely limits their application in breeding programmes.
In recent years, with the development of genomics and improvement in biological statistical software, association mapping has become an important method for dissecting quantitative trait genes/QTL (Zhu et al. Reference Zhu, Gore, Buckler and Yu2008). After obtaining both phenotypic and genotype data of a natural population or germplasm resource population, association mapping uses a statistical method to detect the association between genetic polymorphism and trait heritable variation based on linkage disequilibrium (LD). Compared with linkage mapping, association mapping dramatically improves the detection efficiency of QTL for target traits because it uses the germplasm population with richer genetic variation (Gupta et al. Reference Gupta, Rustgi and Kulwal2005). At present, predecessors have used association mapping to detect molecular markers associated with many quantitative traits, including fibre quality (Kantartzi & Stewart Reference Kantartzi and Stewart2008; Abdurakhmonov et al. Reference Abdurakhmonov, Kohel, Yu, Pepper, Abdullaev, Kushanov, Salakhutdinov, Buriev, Saha, Scheffler, Jenkins and Abdukarimov2008, Reference Abdurakhmonov, Saha, Jenkins, Buriev, Shermatov, Scheffler, Pepper, Yu, Kohel and Abdukarimov2009; Zeng et al. Reference Zeng, Meredith, Gutierrez and Boykin2009; Zhang et al. Reference Zhang, Qian, Zhu, Chen, Wang, Mei and Zhang2013; Cai et al. Reference Cai, Ye, Zhang and Guo2014; Qin et al. Reference Qin, Chen, Yi, Bie, Zhang, Zhang, Lan, Meng, Yuan and Jiao2015), disease resistance (Mei et al. Reference Mei, Ai, Zhang, Ning and Zhang2014; Zhao et al. Reference Zhao, Wang, Chen and Li2014), salt resistance (Saeed et al. Reference Saeed, Guo and Zhang2014), plant type (Li et al. Reference Li, Ai, Zhu, Wang, Chen, Li, Hu and Wang2016) and seed quality (Liu et al. Reference Liu, Mei, Wang, Li, Zhu and Zhang2015). For yield traits, Zhang et al. (Reference Zhang, Qian, Zhu, Chen, Wang, Mei and Zhang2013) performed a preliminary association mapping study in 81 Upland cotton cultivars and identified some molecular markers associated with yield traits. Mei et al. (Reference Mei, Zhu and Zhang2013) used an association mapping panel consisting of 356 representative Upland cotton cultivars and detected a total of 55 marker–trait associations between 26 simple sequence repeat (SSR) markers and seven yield traits, among which 41 marker–trait associations could be detected in more than one environment. Qin et al. (Reference Qin, Chen, Yi, Bie, Zhang, Zhang, Lan, Meng, Yuan and Jiao2015) identified associated SSR markers for three yield component traits based on 241 Upland cotton collections, in which eight were associated with BN, three were associated with BW, and 17 were associated with LP; and these were detected across more than one environment.
China is the world's largest cotton-growing nation, but is not a cotton domestication region. Most Upland cotton cultivars developed in China were derived from several germplasm resources such as Deltapine (DPL), Stoneville (STV), Foster, King and Uganda, all of which were introduced from abroad (Huang Reference Huang2007). This narrow genetic basis has greatly hindered the breeding process of Upland cotton. Therefore, studying the genetic structure of yield traits at the genome level can benefit the efficient utilization of germplasm resources in Upland cotton. In the present study, molecular markers related to yield traits in an association mapping panel composed of 172 Upland cotton accessions were detected. The results can provide useful information for further understanding the genetic basis of yield traits, and facilitate high-yield breeding by genomic selection or molecular design in Upland cotton.
MATERIALS AND METHODS
Plant materials
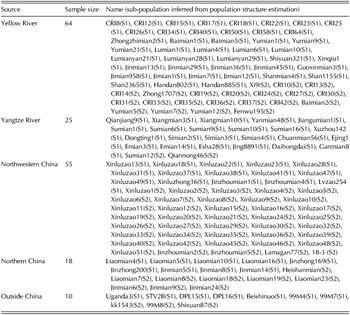
A total of 172 popular Upland cotton cultivars cultivated in or introduced to China were selected to construct an association mapping panel consisting of 64 cultivars from ecological cotton-growing areas of the Yellow River, 25 cultivars from the Yangtze River, 55 cultivars from Northwestern China, 18 cultivars from Northern China and ten cultivars from outside China (Table 1). All materials were inbred for multiple generations. All accessions were planted in two locations over 2 years (four environments) to evaluate phenotypic performance: Henan Institute of Science and Technology, Xinxiang, Henan (113°52′E, 35°18′N; 95 m a.s.l.) in 2012 (E1) and 2013 (E2); Cotton Research Institute of Shihezi, Shihezi, Xinjiang (85°56′E, 44°16′N; 442 m a.s.l.) in 2012 (E3) and 2013 (E4). The experiment was laid out in a randomized complete block design with single row plots and two replications. Considering the larger climate difference between Xinxiang (Yellow River with a longer frost-free season) and Shihezi (Northwestern China with a shorter frost-free season), we performed corresponding cultivation measures for the two locations. In Xinxiang, 14–16 plants were sown in each row (1·0 m wide and 5 m long), while in Shihezi, 38–40 plants were sown in each row (0·45 m wide and 5 m long). All activities were performed as per normal local management practices.
Source, sample size and name of 172 Upland cotton accessions in the present study

Phenotypic evaluation
For all materials in the 2 years and two locations, seven yield traits including SY (g/plant), LY (g/plant), BN, BW (g), LP (%), LI (g) and SI (g) were assessed in each row. Ten consecutive plants in the middle of each row were tagged for trait measurement. At the boll opening stage, BN was investigated, and 20 normal cracking bolls from the middle plants in each row were chosen at random to evaluate BW, LP, LI and SI. All bolls from the ten tagged plants in each row were gathered to calculate SY, and LY was subsequently determined after ginning. The average phenotypic value from the two replications of each trait was recorded as the final phenotypic value under each environment. Phenotypic data were analysed using statistical software SAS 9·4 (SAS Institute Inc., Cary, NC, USA).
Marker genotyping
Genome DNA of all materials was extracted using a modified cetyltrimethylammonium bromide (CTAB) method (Paterson et al. Reference Paterson, Brubaker and Wendel1993). Referring to the cotton tetraploid genetic map (Guo et al. Reference Guo, Cai, Wang, Han, Song, Wang, Niu, Wang, Lu, Shi and Zhang2007), SSR markers/primers at approximately 10-cM intervals in each of 26 chromosomes were selected to ensure the broad genome-wide coverage of genotyping and the representative estimation of genetic distances. Furthermore, reported QTL-linked markers for agriculturally and economically significant traits of cotton (Zhang et al. Reference Zhang, Yuan, Yu, Guo and Kohel2003; Mei et al. Reference Mei, Syed, Gao, Thaxton, Smith, Stelly and Chen2004; Nguyen et al. Reference Nguyen, Giband, Brottier, Risterucci and Lacape2004; Shen et al. Reference Shen, Guo, Lu, Zhu, Yuan and Zhang2007; Qin et al. Reference Qin, Guo, Zhang and Zhang2008; Song & Zhang Reference Song and Zhang2009) were also selected. As a result, 331 polymorphic markers of 1080 selected markers were used to screen 172 accessions. The protocol for amplification and examination of polymerase chain reaction (PCR) was based on the study of Zhang et al. (Reference Zhang, Guo and Zhang2002). Simple sequence repeat genotyping was carried out with reference to the method described by Mei et al. (Reference Mei, Zhu and Zhang2013). Briefly, the band pattern in kk1543 (numbered 1 in the panel) was designated as 1. Similar patterns were also designated as 1, while different patterns were designated as 2, 3, 4, 5, etc. In this manner, the alleles from all of the materials at each marker were measured.
Genotypic data analysis
The software PowerMarker 3·25 (Liu & Muse Reference Liu and Muse2005) was used to estimate the number of allelic variations per marker, the gene diversity index (Di) and the polymorphism information content (PIC) of polymorphic markers for the tested cotton accessions. The Bayesian model-based program STRUCTURE 2·3 (Pritchard et al. Reference Pritchard, Wen and Falush2009) was adopted to estimate the population structure (k = 1 to 10, with five runs for each k) with 70 unlinked and/or weakly linked markers using a burn-in of 10 000 and a run length of 50 000 (Table S1, available from http://journals.cambridge.org/AGS). The most likely number of clusters (k) was selected by comparing the logarithm-transformed probabilities of LnP (D) and Δk data according to Evanno et al. (Reference Evanno, Regnaut and Goudet2005), and the corresponding Q-matrix was obtained for subsequent association mapping. Again, genetic relative kinship among the individuals of experimental materials was analysed using TASSEL 2·1 software (Yu et al. Reference Yu, Pressoir, Briggs, Bi, Yamasaki, Doebley, McMullen, Gaut, Nielsen, Holland, Kresovich and Buckler2006), and the relative coefficient matrix (K-matrix) was also obtained for subsequent association mapping.
Association mapping and elite allele mining
In order to reduce the influence of population structure and individual genetic relationships on the results of association mapping, the mixed linear model (MLM) procedure of TASSEL 2·1 software (Yu et al. Reference Yu, Pressoir, Briggs, Bi, Yamasaki, Doebley, McMullen, Gaut, Nielsen, Holland, Kresovich and Buckler2006) was used for the association mapping of 331 polymorphic markers and seven phenotypic traits. Furthermore, the phenotypic allele effect was estimated by comparing the average phenotypic value over those materials with a specific allele to that of all materials (Mei et al. Reference Mei, Zhu and Zhang2013). The calculation formula was as follows:
 $$a_i = \sum {x_{ij}/n_i} - \sum {N_k/n_k}$$
where a i is the phenotypic effect of the ith allele, x ij is the phenotypic value over the jth material with the ith allele, n i is the number of materials with the ith allele, N k is the phenotypic value over all accessions and n k is the number of materials. If a i > 0, the allele is considered to have a positive effect, while a i < 0 corresponds to a negative allele. Favourable alleles were identified based on the breeding objective of each target trait.
RESULTS
Phenotype statistics
Seven yield traits of 172 Upland cotton accessions across four environments were measured. The F-value and generalized heritability from the analysis of variance (ANOVA) are listed in Table 2. For all seven traits, the variance of environment (E), genotype (G) and the interaction between genotype and environment (G × E) were all highly significant, indicating that each of the yield traits was a typical quantitative trait controlled by genotype and the environment. Seven traits were arranged in order, from high to low according to the generalized heritability, as LP (0·84), LI (0·79), SI (0·78), BW (0·66), LY (0·63), SY (0·56) and BN (0·39), reflecting the degree of influence by environment and genetic diversity level of each trait. There were significant positive correlations between SY and LY, BN, BW, LP, or LI, between LY and BN, BW, LP, or LI, between BN and BW, LP, or LI, between BW and LI or SI, between LP and LI, and between LI and SI. However, there were significant negative correlations between LP and SI (Table 3).
F-value and generalized heritability from analysis of variance for yield traits across the four environments

SY, seed cotton yield; LY, lint yield; BN, boll number per plant; BW, boll weight; LP, lint percentage; LI, lint index; SI, seed index.
Phenotypic correlations among yield traits based on trait means across the four environments

SY, seed cotton yield; LY, lint yield; BN, boll number per plant; BW, boll weight; LP, lint percentage; LI, lint index; SI, seed index.
Genetic diversity analysis
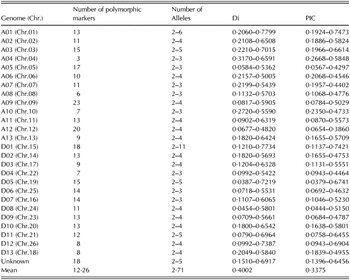
A total of 897 alleles were detected at 331 polymorphic markers (Table 4). The number of polymorphic markers on all chromosomes/unknowns ranged from three to 23, with a mean of 12·26. The number of alleles of the 331 markers ranged from two to 11, with a mean of 2·71, and 87·92% of the markers (291 of 331) yielded only two and/or three alleles. The Di of all markers ranged from 0·0387 to 0·7799, with a mean of 0·4002, and the PIC of all markers ranged from 0·0379 to 0·7473, with a mean of 0·3375. The above results indicate that Upland cotton varietal resources displayed small numbers of alleles and low levels of genetic diversity, and a large difference in the distribution frequencies between accessions.
Distribution and characteristics of polymorphic markers across 26 chromosomes among 172 Upland cotton accessions

Di, gene diversity index; PIC, polymorphism information content.
Population structure estimation
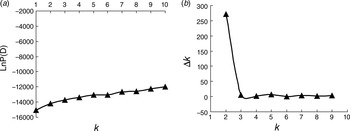
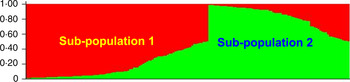
Population structure was estimated by setting the number of clusters (k) at 1–10, with five replications for each k. The LnP(D) value increased continuously with a k of 1–10 (Fig. 1(a)), and there was a sharp peak of Δk at k = 2, followed by a drastic decline for k > 2 (Fig. 1(b)). Accordingly, the total panel could be assigned into two sub-populations: sub-population 1 (S1) and sub-population 2 (S2) (Fig. 2, Table 1). The S1 contained 97 accessions: 43 from Yellow River, 23 from Yangtze River, 15 from Northwestern China, nine from North China and seven from outside China. Meanwhile, the S2 consisted of 75 accessions: 21 from Yellow River, two from Yangtze River, 40 from Northwestern China, nine from North China and three from outside China. The corresponding Q-matrix at k = 2 was used for further marker–trait association mapping. In addition, based on the results of the relatedness analysis, a K-matrix was also generated for the subsequent association mapping.
Estimated LnP(D) and ∆k over five repeats of population structure analysis: (a) LnP(D) for k from 1 to 10 for 172 accessions; (b) ∆k for k from 2 to 9 for 172 accessions.

Total panel was grouped into two sub-populations based on 331 polymorphic markers (k = 2), designated sub-population 1(S1) and sub-population 2(S2), respectively (detailed results are shown in Table 1). Colour online.

Marker–yield trait association mapping
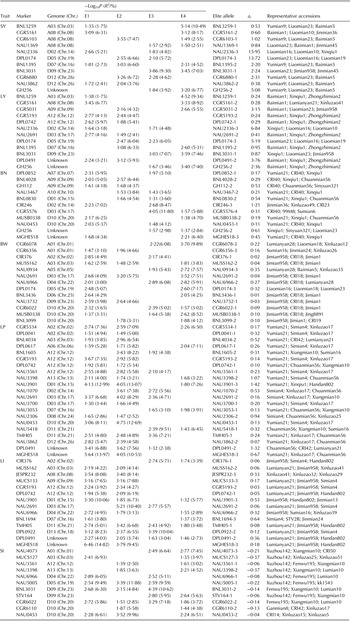
For all seven yield traits, an MLM model was applied to analyse the four datasets derived from the 172 accessions in the four environments. A total of 265 marker–yield trait associations were significant at P ⩽ 0·01 (i.e. −Log10 P = 2·00) in at least one environment and P ⩽ 0·05 (i.e. −Log10 P = 1·30) across more than one environment, and most of them (172 of 265) were identified in only one environment (Table S2, available from http://journals.cambridge.org/AGS). In order to reduce the occurrence of false positives, only significant marker–yield trait associations (P ⩽ 0·05, i.e. −Log10 P = 1·30) detected simultaneously across more than one environment are shown in Table 5. Ultimately, 93 associated markers (including repeated markers) for seven yield traits were identified. Among these 93 markers, 11 were associated with SY, 12 with LY, 11 with BN, 13 with BW, 21 with LP, 14 with LI and 11 with SI. Furthermore, the corresponding ranges in phenotypic variation explained by markers across the four environments were 1·75–10·49, 1·75–9·34, 2·84–11·80, 2·59–9·89, 2·38–13·97, 2·73–14·82 and 2·50–11·88%, respectively.
Significant marker–yield trait associations simultaneously detected across more than one environment

SY, seed cotton yield; LY, lint yield; BN, boll number per plant; BW, boll weight; LP, lint percentage; LI, lint index; SI, seed index.
R 2/% = phenotypic variation explained by marker; E1, E2, E3 and E4 indicate the four environments 2012Xinxiang, 2013Xinxiang, 2012Shihezi and 2013Shihezi, respectively; a i = phenotypic effect of allelic variation; Representative accessions mean the top three entries for the phenotypic value of the target trait with the corresponding elite alleles.
Among the 93 associated markers, 23 markers were repeated and were respectively co-associated with two or more different traits. Specifically, 13 markers (BNL1395, BNL3259, CGR5161, CGR6022, CIR376, MUSB0338, MUSS162, NAU2336, NAU3398, NAU3561, NAU3862, NAU3901 and TMH05) were co-associated with two traits, nine markers (BNL3031, CGR5193, DPL0174, DPL0491, DPL0742, GH256, MGHES18, NAU0453 and NAU6966) were co-associated with three traits, and one marker (NAU2691) was co-associated with four traits.
The elite alleles for seven yield traits were also explored. Among all of the elite alleles, NAU2336-3 had the greatest positive phenotypic effect on SY, increasing it by 15·95, with Liaomian16, Liaomian10 and Xinqiu1 as representative accessions (i.e. the top three entries for the phenotypic value of the target trait with the corresponding elite alleles). NAU2336-3 had the greatest positive phenotypic effect on LY, increasing it by 6·84, with Xinqiu1, Liaomian16 and Liaomian10 as representative accessions. CIR246-3 had the greatest positive phenotypic effect on BN, increasing it by 1·21, with Jinmian36, Xinluzao49 and CRI23 as representative accessions. NAU0934-3 had the greatest positive phenotypic effect on BW, increasing it by 0·35, with Lumianyan28, Baimian5 and Xinluzao35 as representative accessions. NAU3901-3 had the greatest positive phenotypic effect on LP, increasing it by 1·42, with Yumian21, Xinqiu1 and Handan802 as representative accessions. BNL1694-3 had the greatest positive phenotypic effect on LI, increasing it by 0·64, with Simian4, STV2B and Jinmian24 as representative accessions. MUCS127-3 had the greatest negative phenotypic effect on SI, reducing it by 0·37, with Xuzhou142, Xinluzao25 and Xinluzao51 as representative accessions.
DISCUSSION
Factors affecting association mapping
Association mapping is an effective approach for dissecting the genetic basis underlying complex traits. In order to dissect complex traits, the first thing to do is to understand the diversity level of a germplasm population. A suitable association mapping panel should embrace as much phenotypic and genotypic diversity as can be reliably measured in common environments (Flint-Garcia et al. Reference Flint-Garcia, Thuillet, Yu, Pressoir, Romero, Mitchell, Doebley, Kresovich, Goodman and Buckler2005). It is especially critical to select samples that encompass genetic diversity as much as possible. In the present study, 172 popular Upland cotton cultivars were selected for the association mapping panel. Although the sample was restricted to 172 accessions, these were derived mainly from multiple pedigrees including Deltapine, Stoneville, Foster and Uganda (the pedigrees of some cultivars were unknown, hence no detailed pedigrees are shown in the present paper), and they have also been or are currently cultivated in the four main ecological cotton-growing areas of China, i.e. Yellow River, Yangtze River, Northwestern China and Northern China. Phenotypic evaluation in different environments indicates a high degree of phenotypic diversity in yield traits, indicating that these traits are suitable for association mapping. However, marker data revealed that only 331 of the 1080 SSR markers were polymorphic in all accessions. The number of alleles of the 331 markers ranged from two to 11, with a mean of 2·71; and 87·92% of the markers (291 of 331) yielded only two and/or three alleles. The Di of all markers ranged from 0·0387 to 0·7799, with a mean of 0·4002 and the PIC of all markers ranged from 0·0379 to 0·7473, with a mean of 0·3375. These results indicate that Upland cotton varietal resources in China displayed small numbers of alleles and low levels of genetic diversity, which might affect the detection power of association mapping for target traits.
Linkage disequilibrium is the basis and premise of association mapping, which determines the number of markers required for association mapping (Zhu et al. Reference Zhu, Gore, Buckler and Yu2008). Statistical analysis indicates that genome-wide LD analysis for the human genome requires approximately 70 000 markers, maize inbred lines require 50 000 markers and Arabidopsis thaliana only requires 6000 markers (Flint-Garcia et al. Reference Flint-Garcia, Thornsberry and Bucker2003; Aranzana et al. Reference Aranzana, Kim, Zhao, Bakker, Horton, Jakob, Lister, Molitor, Shindo, Tang, Toomajian, Traw, Zheng, Bergelson, Dean, Marjoram and Nordborg2005). In cotton, Abdurakhmonov et al. (Reference Abdurakhmonov, Kohel, Yu, Pepper, Abdullaev, Kushanov, Salakhutdinov, Buriev, Saha, Scheffler, Jenkins and Abdukarimov2008) estimated the extent of genome-wide LD by using 95 core SSR markers in a total of 285 exotic G. hirsutum accessions comprising 208 landrace stocks and 77 photoperiodic variety accessions. Result revealed that at a significant threshold (r 2 ⩾ 0·1), the genome-wide average of LD declines within genetic distance at <10 cM in the landrace stocks germplasm and >30 cM in variety germplasm. Abdurakhmonov et al. (Reference Abdurakhmonov, Saha, Jenkins, Buriev, Shermatov, Scheffler, Pepper, Yu, Kohel and Abdukarimov2009) reported the extent of LD using 202 SSR markers in a collection of 335 Upland cotton accessions and concluded that at a significant threshold of r 2 ⩾ 0·1, the genome-wide average LD extended to a genetic distance of 25 cM in assayed cotton varietal accessions. However, at r 2 ⩾ 0·2, the genome-wide LD was reduced to 5–6 cM. Mei et al. (Reference Mei, Zhu and Zhang2013) reported that LD of Upland cotton declined to 17–18and 3–4 cM at r 2 ⩾ 0·1 and r 2 ⩾ 0·2, respectively. The above studies indicate that it is feasible and effective to adopt association mapping to analyse important cotton traits, but the genetic distance between markers must reach or be below 5 cM to completely detect the marker loci related to quantitative traits. Calculated as per 5200 cM genetic distances in tetraploid cotton (Lacape et al. Reference Lacape, Nguyen, Thibivilliers, Bojinov, Courtois, Cantrell, Burr and Hau2003), a minimum of 1100 polymorphic markers are required for effective genome-wide association mapping. In the present study, 1080 SSR markers were used for the polymorphic detection of 172 cotton accessions and only 331 polymorphic markers were obtained. Thus, the mean genetic distance between markers is >10 cM. Therefore, these markers used to perform the association mapping of target traits can only detect partial markers associated with target traits; real genome-wide association mapping could not be made with these markers.
In addition, factors that influence LD such as mating system, choice, genetic bottleneck and population structure also affect association mapping, with population structure an especially important factor. When population structure is simple, the efficacy of association mapping reaches its highest level, with the possibility of minimizing false positive associations (Cardon & Palmer Reference Cardon and Palmer2003). However, when the population structure is relatively complicated, due to the difference in allelic frequency within different sub-populations, the population structure and allelic unbalanced distribution within different sub-populations leads to a false positive association between genotypes and phenotypes, which make the association mapping more complicated (Knowler et al. Reference Knowler, Williams, Pettitt and Steinberg1988). In the present study, by using TASSEL 2·1, 172 Upland cotton accessions were divided into two sub-populations and the corresponding Q-matrix at k = 2 was generated. At the same time, the MLM (Q + K) model was adopted in consideration of the influence of the relationships among materials to association mapping. This would further reduce false positives caused by population stratification and improve the accuracy of the association mapping (Zhao et al. Reference Zhao, Aranzana, Kim, Lister, Shindo, Tang, Toomajian, Zheng, Dean, Marjoram and Nordborg2007; Myles et al. Reference Myles, Peiffer, Brown, Ersoz, Zhang, Costich and Buckler2009).
Molecular markers associated with yield traits
Using the MLM model of TASSEL software, a total of 93 molecular markers significantly associated with seven yield traits were identified across more than one environment. Among the 93 markers, 11 were associated with SY, 12 with FY, 11 with BN, 13 with BW, 21 with LP, 14 with LI and 11 with SI. Generally speaking, markers/QTL for target traits that are identified simultaneously across multiple environments have good stability and can be considered for MAS. For yield traits, Mei et al. (Reference Mei, Zhu and Zhang2013) performed an association mapping study for yield and its components in 356 Upland cotton accessions and a total of 55 marker–trait associations were detected. Among these, 41 could be detected in more than one environment. Yu et al. (Reference Yu, Ulloa, Hoffman, Kohel, Pepper, Fang, Percy and Burke2014) detected genomic loci for cotton yield components in an interspecific (G. hirsutum L. × G. barbadense L.) RIL population using the linkage mapping method and found that 60 of 79 putative QTLs for yield components were identified in more than one environment. The above markers/QTL can be used for MAS to improve cotton yield, considering their good stability.
In the present study, 23 of 93 associated markers were repeated and these were respectively co-associated with two or more different traits, which coincided with phenotypic correlations among yield traits. A similar conclusion was drawn in the study of Mei et al. (Reference Mei, Zhu and Zhang2013), who found that 17 of all associated markers were co-associated with two or more different yield traits and most of the lint yield-associated markers were associated with at least one of its components. The phenomenon of co-associated markers in association mapping coincided with QTL clusters or co-localization QTL in linkage mapping. Yu et al. (Reference Yu, Zhang, Li, Yu, Zhai, Wu, Li, Fan, Song, Yang, Li and Zhang2013) observed several QTL clusters in almost half of the tetraploid cotton chromosomes and some QTL clusters were mapped to the same regions that affect the same fibre quality traits or yield traits. This could result from the pleiotropy of a single causal gene or tight linkage of multiple causal genes. In breeding practice, for the selection of traits with positive correlations, the goal of simultaneously improving multiple traits can be achieved by selecting the marker loci related to one trait. However, for the selection of traits with negative correlations, elite alleles of markers for every trait should be polymerized to reduce the influence of ‘chain drag’ on the selection of related traits.
Although the markers used in different studies vary and QTL-related or QTL-associated markers are not easily compared, some of the yield-associated markers detected in the present study were consistent with those of previous studies by association and/or linkage mapping. A slight difference might exist in chromosome position of markers among different studies. The marker BNL3259 on A03 (Chr. 03) associated with SY was consistent with the study of Yu et al. (Reference Yu, Zhang, Li, Yu, Zhai, Wu, Li, Fan, Song, Yang, Li and Zhang2013). Markers BNL3259 on A03 (Chr. 03), CGR5161 on A08 (Chr. 08) and DPL0491 on an unknown chromosome associated with LY were consistent with those in the studies of Yu et al. (Reference Yu, Zhang, Li, Yu, Zhai, Wu, Li, Fan, Song, Yang, Li and Zhang2013) and Xia et al. (Reference Xia, Zhang, Liu, Jia, Zhao, Li and Wang2014). Markers DPL0742 on A12 (Chr. 12), NAU3398 on A13 (Chr. 13), NAU3700 on D03 (Chr. 17), NAU3053 on D07 (Chr. 16), NAU5418 on D11 (Chr. 21) and DPL0491 on an unknown chromosome associated with LP were consistent with those in the studies of Li et al. (Reference Li, Guo, Ma and Zhang2008); Mei et al. (Reference Mei, Zhu and Zhang2013); Zhang et al. (Reference Zhang, Qian, Zhu, Chen, Wang, Mei and Zhang2013); Xia et al. (Reference Xia, Zhang, Liu, Jia, Zhao, Li and Wang2014) and Qin et al. (Reference Qin, Chen, Yi, Bie, Zhang, Zhang, Lan, Meng, Yuan and Jiao2015). The marker BNL3398 on A13 (Chr. 13) associated with SI was consistent with the study of Qin et al. (Reference Qin, Liu, Mei, Zhang and Guo2009). These markers identified across different populations would be of great value for MAS.
Potential usages of elite alleles for cotton yield breeding
Most Upland cotton cultivars developed in China were derived from few germplasm resources introduced from abroad; therefore, the genetic base is narrow (Guo et al. Reference Guo, Zhang, Pan and Wang1997; Chen & Du Reference Chen and Du2006) which poses a clear challenge for genetic improvement. New variations that have emerged and accumulated during the long breeding history in China should be fully mined for the sake of the efficient utilization of germplasm. By comparing the average phenotypic value of each allele for target traits in the 93 stable marker–trait associations, 11, 12, 11, 13, 21, 14 and 11 elite alleles were obtained for SY, FY, BN, BW, LP, LI and SI, respectively. Among all elite alleles, NAU2336-3, NAU2336-3, CIR246-3, NAU0934-3, NAU3901-3, BNL1694-3 and MUCS127-3 had the greatest positive and/or negative phenotypic effect on each of the seven yield traits, respectively. These elite alleles and their representative accessions should be used in cotton-breeding programmes according to specific breeding objectives.
For genes controlling some traits, different allelic variations in different germplasm resources are the real cause of phenotypic differences. The efficient utilization of different germplasm resources requires a good understanding of the role of different allelic variations based on determining the amount of allelic variation, as well as in determining variations with useful or large positive effects. The allelic variations with useful or large positive effects can be used to improve breeding efficiency by breeding design (Peleman & van der Voort Reference Peleman and van der Voort2003). In the present study, the representative accessions with elite alleles for all seven yield traits were further summarized. It was found that a total of 26 accessions each contained three or more elite alleles. These were: Jimian958, containing 24 elite alleles; Yumian21, containing 22 elite alleles; Xinqiu1, containing 19 elite alleles; Simian4, containing 17 elite alleles; Chuanmian56 and Liaomian23, respectively containing 14 elite alleles; Xinluzao17, containing 13 elite alleles; Lumianyan21, containing 12 elite alleles; Baimian1 and Xiangmian10, respectively containing 11 elite alleles; CRI18, containing eight elite alleles; Baimian5, CRI40, Handan802, Jimian1, Xuzhou142 and Zhongzhimian2, respectively containing seven elite alleles; Fenwu195 and Yumian9, respectively containing six elite alleles; Liaomian16, containing five elite alleles; Lumian10 and Sumian16, respectively containing four elite alleles; CRI42, Liaomian10, Lumianyan28 and Xinluzao41, respectively containing three elite alleles. The accessions that possess most of the elite alleles should be regarded as core germplasm for cotton-breeding utilization. Simultaneously, a ranking system for MAS or genomic selection should be developed based on the results of association mapping, which involve a core germplasm panel.
Recently with the rapid development of high-throughput sequencing technology, the tetraploid G. hirsutum (AD)1 was sequenced (Li et al. Reference Li, Fan, Lu, Xiao, Zou, Kohel, Ma, Shang, Ma, Wu, Liang, Huang, Percy, Liu, Yang, Chen, Du, Shi, Yuan, Ye, Liu, Zhang, Liu, Wei, Wei, Huang, Zhang, Zhu, Zhang, Sun, Wang, Liang, Wang, He, Huang, Wang, Cui, Song, Wang, Xu, Yu, Zhu and Yu2015; Zhang et al. Reference Zhang, Hu, Jiang, Fang, Guan, Chen, Zhang, Saski, Scheffler, Stelly, Hulse-Kemp, Wan, Liu, Liu, Wang, Pan, Wang, Wang, Ye, Chang, Zhang, Song, Kirkbride, Chen, Dennis, Llewellyn, Peterson, Thaxton, Jones, Wang, Xu, Zhang, Wu, Zhou, Mei, Chen, Tian, Xiang, Li, Ding, Zuo, Tao, Liu, Li, Lin, Hui, Cao, Cai, Zhu, Jiang, Zhou, Guo, Li and Chen2015). At the same time, 67 736 predicted protein-coding genes, including 32 032 in the A sub-genome and 34 402 in the D sub-genome were functionally annotated by Zhang et al. (Reference Zhang, Hu, Jiang, Fang, Guan, Chen, Zhang, Saski, Scheffler, Stelly, Hulse-Kemp, Wan, Liu, Liu, Wang, Pan, Wang, Wang, Ye, Chang, Zhang, Song, Kirkbride, Chen, Dennis, Llewellyn, Peterson, Thaxton, Jones, Wang, Xu, Zhang, Wu, Zhou, Mei, Chen, Tian, Xiang, Li, Ding, Zuo, Tao, Liu, Li, Lin, Hui, Cao, Cai, Zhu, Jiang, Zhou, Guo, Li and Chen2015). Importantly, a genome-wide single nucleotide polymorphism (SNP) chip, NAUSNP80K, developed from whole-genome sequences of G. hirsutum was successfully made, providing an important tool for a cotton genome-wide association study (GWAS). Therefore, the next step is to perform cotton GWAS in the true sense based on a large number of SNP markers to further verify markers identified in the present study. Furthermore, based on the data of annotated protein-coding genes of tetraploid cotton, through the use of bioinformatics, transgenic function verification and other means, functional markers or candidate genes related to cotton yield could be predicted. Once breeding programmes are combined with computer simulations, cotton high-yield breeding by molecular design will be implemented in the near future.
SUPPLEMENTARY MATERIAL
The supplementary material for this article can be found at http://dx.doi.org/10.1017/S0021859616000745
This work was financially supported by the National Natural Science Foundation of China (Grant no. 31371677), the National Key Special Project of Cultivating Biological New Varieties by Transgenic Technology (Grant no. 2014ZX08005002) and the Innovative Talent Support Program of Science and Technology of Henan Institute of Higher Learning (Grant no. 16HASTIT014).