1. Introduction
It is a global phenomenon that life expectancy continues to rise. This trend has been persistent and driven by significant progresses in hygiene, nutrition, lifestyle, medical knowledge, and health care. Although it is definitely no mean feat for humans, it presents a significant challenge to pension plan sponsors and annuity providers. There is the so-called longevity risk that pension plans or annuity portfolios pay more than expected because of unanticipated improvements in mortality. Roughly speaking, this risk has two components, systematic longevity risk and non-systematic longevity risk, in which only the latter can be mitigated by increasing the plan or portfolio size.
There are generally three broad approaches for financial institutions to tackle longevity risk (Cairns et al., Reference Cairns, Blake and Dowd2008). The first is the use of insurance and reinsurance, in which the unwanted risk is passed on to an insurer or reinsurer after paying a premium. The second is natural hedging (Li & Haberman, Reference Li and Haberman2015), which is basically a diversification strategy and exploits the opposite changes in the values of annuities and life insurances. The third approach, capital market solutions, has attracted much attention in recent years. These solutions include insurance securitisation, mortality- or longevity-linked securities, and derivatives. Insurance securitisation involves securitising a class of business as a complex package and then selling the highly structured securities to capital market investors. Moreover, some currently popular bespoke de-risking methods like buy-ins, buy-outs, and longevity swaps are also customised transactions for hedging specific portfolios. On the other hand, standardised mortality- or longevity-linked securities and derivatives have their cash flows linked to an index or reference population, but not the (book) population underlying the portfolio being hedged. There would then be a potential mismatch between the hedging instrument and the portfolio, due to certain demographic differences (e.g. age profile, sex, socioeconomic status). There are also two other important issues. First, the experience of a small portfolio tends to be more volatile and is more likely to deviate further from that of the reference population. Second, the payoff structures of the hedging tool and the portfolio would usually be quite different. These three sources of discrepancies give rise to longevity basis risk, the assessment of which is under much research in the latest actuarial literature.
While most longevity transactions thus far have been customised, index-based solutions and standardised products could potentially draw more interest from financial institutions both inside and outside the insurance sector. They have substantial potential to allow effective risk management at lower costs and provide significant capital savings. As noted above, however, the potential mismatch between the hedging instrument and the pension or annuity portfolio to be hedged leads to longevity basis risk, which is composed of demographic basis risk (demographic or socioeconomic differences), sampling basis risk (random outcomes of individual lives), and structural basis risk (differences in payoff structures). For small- to medium-sized pension plans or annuity portfolios, the mortality experience would be more volatile, which means that sampling basis risk and structural basis risk would have more impact and hence need to be properly allowed for. Haberman et al. (Reference Haberman, Kaishev, Millossovich, Villegas, Baxter, Gaches, Gunnlaugsson and Sison2014) and Villegas et al. (Reference Villegas, Haberman, Kaishev and Millossovich2017) proposed a decision tree framework as a practical guide for choosing a two-population mortality projection model for assessing demographic basis risk. The major options are namely the M7-M5 model, the CAE+Cohorts (common age effect + cohort effect) model, and the characterisation approach. In this paper, we put the earlier work in Haberman et al. (Reference Haberman, Kaishev, Millossovich, Villegas, Baxter, Gaches, Gunnlaugsson and Sison2014) into practice and measure longevity basis risk under various practical conditions. In particular, we take all the three basis risk components into account and investigate a variety of hedging scenarios using UK population and industry data sets.
The structure of this paper is as follows. Section 2 analyses the historical mortality patterns and improvements as reflected in three UK data sets. Section 3 provides the details of the M7-M5 and CAE+Cohorts models we have used. Section 4 explains the simulation technique and the calibration method adopted. Section 5 examines a range of hedging scenarios of pension portfolios using index-based longevity swaps, and calculates the corresponding levels of longevity risk reduction. Section 6 performs an extensive sensitivity analysis on the hedging results by making a series of changes to the original model settings and assumptions, and also the time series processes. Lastly, Section 7 concludes the paper.
2. Data Features
The UK mortality data used in this paper are collected from the Continuous Mortality Investigation (CMI; Self-Administered Pension Scheme Mortality Investigation), Office for National Statistics (ONS; by deprivation subgroups), and Human Mortality Database (HMD 2017; England and Wales). The first two data sets are taken as the underlying experience of the pension or annuity portfolio being hedged. The last data set is assumed to represent the experience of the reference population of the hedging instrument. The retirement age range of 60–89 is covered in the analysis, while the data of ages 90+ are scarce and so are excluded.
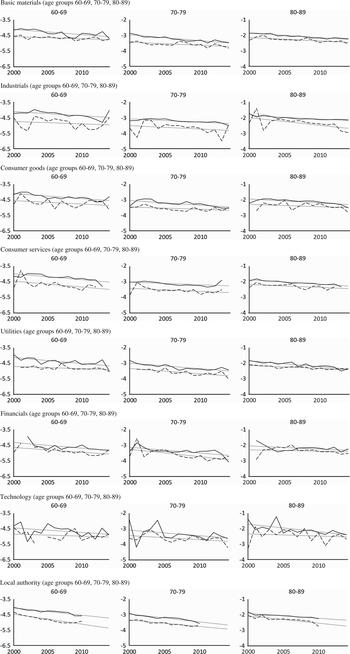
Figure 1 plots the logit mortality rates of different CMI groups of male pensioners under normal retirement at ages 60–69, 70–79, and 80–89. The solid line corresponds to the pension range of £1–£8,500 p.a., the dashed line refers to £8,500+ p.a., and the dotted lines depict their potential underlying linear trends over time. It can be seen that the higher pension groups have lower mortality and more volatile experience in general, but the differences between the two pension groups tend to reduce over age. Moreover, the differences in mortality levels between industries appear quite random and are rather small, especially at older ages. Table 1 states the average mortality rate and the average annual rate of improvement in mortality rate for each group during the period. The higher pension groups generally have lower mortality levels, and the differences in average mortality rates between industries look quite small, though the pensioners in financials seem to have slightly lower mortality levels than the others. Moreover, the improvement rates range largely from around 1%–5% p.a. and have a tendency to reduce over age. The lower pension groups, which have higher mortality rates, seem to experience greater improvements in mortality for many of the cases. The differences in improvement rates between industries are mostly randomly scattered, except that the pensioners in local authority appear to enjoy greater mortality improvements than the rest.
Logit mortality rates of Continuous Mortality Investigation male pensioners from 2000 to 2014. The solid line corresponds to the pension range of £1–£8,500 p.a., the dashed line refers to £8,500+ p.a. (for technology, the split is by £4,500 p.a. instead), and the dotted lines depict their potential underlying linear trends over time.

Average mortality levels and improvements of Continuous Mortality Investigation male pensioners from 2000 to 2014.

Figure 2 shows the logit mortality rates of England IMD (index of multiple deprivation) quintile groups of males for the same age groups as above. The five different lines with progressively lighter shades represent the most deprived areas to the least consecutively, in which the IMD is an overall relative measure of deprivation, based on a number of socioeconomic factors such as income, employment, and education. It is very clear that mortality increases with the deprivation level for all age groups, but the differences between the quintile groups become smaller at older ages. The declining temporal trends are all fairly steady, as the data exposures are very large. Table 2 lists the average mortality rate and the average annual rate of improvement in mortality rate for each group during the period. Less deprived areas have lower mortality levels and also higher improvement rates than more deprived areas. The improvement rates range from 1.3% to 3.6% p.a. and are highest at ages 70–79.
Logit mortality rates of England index of multiple deprivation quintile groups from 2001 to 2015 for age groups 60–69, 70–79, and 80–89.

Average mortality levels and improvements of England index of multiple deprivation quintile groups from 2001 to 2015.

Figure 3 displays the logit mortality rates of the English and Welsh male population from 2000 to 2014. The decreasing mortality trends over time are stable for all age groups with little variability, due to the very large population exposures. Table 3 gives the average mortality rate and the average annual rate of mortality improvement for each age group. The improvement rates range from 2.3% to 3.5% p.a. They are lowest at ages 80–89, and like the IMD quintile groups, those lives aged 70–79 experience the highest improvement rates.
Logit mortality rates of English and Welsh male population from 2000 to 2014 for age groups 60–69, 70–79, and 80–89.

Average mortality levels and improvements of English and Welsh male population from 2000 to 2014.

Between the CMI pensioners (Table 1) and IMD quintile groups (Table 2), the mortality levels of the lower pension groups are comparable to those of the third most deprived areas, whereas the higher pension groups have slightly lower mortality than the least deprived areas. One interesting observation is that while the lower pension (less wealthy) groups seem to have greater mortality improvements in many cases, the less deprived (wealthier) areas clearly have higher improvement rates. This conflicting difference may be explained by two reasons. First, the former uses only the pension amount in dividing the groups, but the latter adopts the IMD based on a combination of seven domains, so the two sets of results may correspond to individuals with different demographic features. Second, the data exposures of each CMI industry are much smaller than those of the IMD quintile groups, and the experience is unavoidably a lot more volatile. Between the CMI pensioners and English and Welsh population (Table 3), the lower pension groups have mortality levels and improvement rates roughly comparable to those of the English and Welsh population.
3. Model Descriptions
In this paper, we apply the M7-M5 model and the CAE+Cohorts model in Haberman et al. (Reference Haberman, Kaishev, Millossovich, Villegas, Baxter, Gaches, Gunnlaugsson and Sison2014) to the three data sets. The M7-M5 model is a two-population extension of the Cairns–Blake–Dowd model (Cairns et al., Reference Cairns, Blake and Dowd2006, Reference Cairns, Blake, Dowd, Coughlan, Epstein, Ong and Balevich2009) and has two major components:
 $${\rm logit}\,q_{{x,t}}^{R} {\equals}\kappa _{{t,1}}^{R} {\plus}\left( {x{\minus}\bar{x}} \right){\rm }\kappa _{{t,2}}^{R} {\plus}\left( {\left( {x{\minus}\bar{x}} \right)^{2} {\minus}\sigma ^{2} } \right){\rm }\kappa _{{t,3}}^{R} {\plus}\gamma _{{t{\minus}x}}^{R} {\equals}\eta _{{x,t}}^{R} $$
(reference component)
 $${\rm logit}\,q_{{x,t}}^{B} {\minus}{\rm logit }\,q_{{x,t}}^{R} {\equals}\kappa _{{t,1}}^{B} {\plus}\left( {x{\minus}\bar{x}} \right){\rm }\kappa _{{t,2}}^{B} {\equals}\eta _{{x,t}}^{B} $$
(book component)
In the reference component,
 $$q_{{x,t}}^{R} $$
is the mortality rate of the reference population at age x in year t,
 $$\kappa _{{t,1}}^{R} $$
,
 $$\kappa _{{t,2}}^{R} $$
, and
 $$\kappa _{{t,3}}^{R} $$
refer to the level, slope, and curvature, respectively, of the mortality curve across age in year t, and
 $$\gamma _{{t{\minus}x}}^{R} $$
describes the cohort effect of those lives born in year t−x. In the book component, the difference in the logit mortality rate between the book and reference populations in year t,
 $${\rm logit }\,q_{{x,t}}^{B} {\minus}{\rm logit }\,q_{{x,t}}^{R} $$
, is captured by another two parameters
 $$\kappa _{{t,1}}^{B} $$
and
 $$\kappa _{{t,2}}^{B} $$
. The two terms
 $$\bar{x}{\equals}{1 \over {{\rm no}{\rm .}\,{\rm of}\,{\rm ages}}}\mathop{\sum}\limits_x x $$
and
 $$\sigma ^{2} {\equals}{1 \over {{\rm no}{\rm .}\,{\rm of}\,{\rm ages}}}\mathop{\sum}\limits_x {\left( {x{\minus}\bar{x}} \right)^{2} } $$
, and
 $$\eta _{{x,t}}^{R} $$
and
 $$\eta _{{x,t}}^{B} $$
denote the overall reference and book components. The mortality rates can then be expressed as
 $$q_{{x,t}}^{R} {\equals}{{{\rm exp}\left( {\eta _{{x,t}}^{R} } \right)} \over {1{\plus}{\rm exp}\left( {\eta _{{x,t}}^{R} } \right)}}{\equals}{1 \over {{\rm exp}\left( {{\minus}\eta _{{x,t}}^{R} } \right){\plus}1}}$$
and
 $$q_{{x,t}}^{B} {\equals}{{{\rm exp}\left( {\eta _{{x,t}}^{B} {\plus}\eta _{{x,t}}^{R} } \right)} \over {1{\plus}{\rm exp}\left( {\eta _{{x,t}}^{B} {\plus}\eta _{{x,t}}^{R} } \right)}}{\equals}{1 \over {{\rm exp}\left( {{\minus}\eta _{{x,t}}^{B} {\minus}\eta _{{x,t}}^{R} } \right){\plus}1}}$$
. Moreover, there are three identifiability constraints
 $$\mathop{\sum}\limits_c {\gamma _{c}^{R} } {\equals}0,\,\mathop{\sum}\limits_c {c\gamma _{c}^{R} } {\equals}0,\,{\rm and}\,\mathop{\sum}\limits_c {c^{2} \gamma _{c}^{R} } {\equals}0,$$
which ensure that the cohort parameters have a unique set of solutions and fluctuate around zero over successive cohorts.
While Haberman et al. (Reference Haberman, Kaishev, Millossovich, Villegas, Baxter, Gaches, Gunnlaugsson and Sison2014) used the binomial distribution assumption, we model the random numbers of deaths at age x in year t of the reference and book populations with the Poisson distribution instead, i.e.,
 $$D_{{x,t}}^{R} \sim{\rm Poisson}\,\left( {{\rm }e_{{x,t}}^{R} {\rm }m_{{x,t}}^{R} } \right)$$
and
 $$D_{{x,t}}^{B} \sim{\rm Poisson }\left( {{\rm }e_{{x,t}}^{B} {\rm }m_{{x,t}}^{B} } \right),$$
which are in agreement with most of the current literature. The terms
 $$e_{{x,t}}^{R} $$
and
 $$e_{{x,t}}^{B} $$
are the corresponding central exposed to risk measures. We further assume that the force of mortality is constant within each age-time cell and so it is equal to the central death rate. Then the central death rates of the reference and book populations can be expressed as
 $$m_{{x,t}}^{R} {\equals}{\minus}\!\ln \left( {{\rm }1{\minus}q_{{x,t}}^{R} } \right){\equals}{\rm ln}\left( {{\rm }1{\plus}{\rm exp}\left( {\eta _{{x,t}}^{R} } \right){\rm }} \right)$$
and
 $$m_{{x,t}}^{B} {\equals}{\minus}\!\ln \left( {{\rm }1{\minus}q_{{x,t}}^{B} } \right){\equals}\ln \left( {{\rm }1{\plus}\exp \left( {\eta _{{x,t}}^{B} {\plus}\eta _{{x,t}}^{R} } \right){\rm }} \right)$$
. Under the Poisson assumption, the log likelihood functions of the two populations are:
 $$l^{R} {\equals}\mathop{\sum}\limits_{x,t} {\left( {{\rm }d_{{x,t}}^{R} \,\ln e_{{x,t}}^{R} {\plus}d_{{x,t}}^{R} \,\ln m_{{x,t}}^{R} {\minus}e_{{x,t}}^{R} {\rm }m_{{x,t}}^{R} {\minus}\ln \left( {d_{{x,t}}^{R} \,!\,} \right){\rm }} \right)} $$
 $$l^{B} {\equals}\mathop{\sum}\limits_{x,t} {\left( {{\rm }d_{{x,t}}^{B} \ln e_{{x,t}}^{B} {\plus}d_{{x,t}}^{B} \ln m_{{x,t}}^{B} {\minus}e_{{x,t}}^{B} {\rm }m_{{x,t}}^{B} {\minus}\ln \left( {d_{{x,t}}^{B} \,!\,} \right){\rm }} \right)} $$
in which
 $$d_{{x,t}}^{R} $$
and
 $$d_{{x,t}}^{B} $$
are the observed numbers of deaths. The iterative updating schemes for estimating the model parameters are given in the Appendix.
For projecting and simulating future mortality rates, we follow Haberman et al. (Reference Haberman, Kaishev, Millossovich, Villegas, Baxter, Gaches, Gunnlaugsson and Sison2014) and model the time series of
 $$\kappa _{{t,1}}^{R} $$
,
 $$\kappa _{{t,2}}^{R} $$
, and
 $$\kappa _{{t,3}}^{R} $$
with a multivariate random walk with drift (MRWD):
 $$\left( {\matrix{ {\kappa _{{t,1}}^{R} } \cr {\kappa _{{t,2}}^{R} } \cr {\kappa _{{t,3}}^{R} } \cr } } \right){\equals}\left( {\matrix{ {d_{1} } \cr {d_{2} } \cr {d_{3} } \cr } } \right){\plus}\left( {\matrix{ {\kappa _{{t{\minus}1,1}}^{R} } \cr {\kappa _{{t{\minus}1,2}}^{R} } \cr {\kappa _{{t{\minus}1,3}}^{R} } \cr } } \right){\plus}\left( {\matrix{ {{\epsilon}_{{t,1}} } \cr {{\epsilon}_{{t,2}} } \cr {{\epsilon}_{{t,3}} } \cr } } \right)$$
The parameters d
1, d
2, and d
3 are the drift terms (slopes of the linear trends), and ε
t,1, ε
t,2, and ε
t,3 are the multivariate normal error terms with mean zero and covariance matrix Σ. The future variability of
 $$\kappa _{{t,1}}^{R} $$
,
 $$\kappa _{{t,2}}^{R} $$
, and
 $$\kappa _{{t,3}}^{R} $$
increase over time. Moreover, we model the time series of
 $$\gamma _{c}^{R} $$
with an autoregressive integrated moving average process (ARIMA(1,1,0)):
 $$\gamma _{c}^{R} {\minus}\gamma _{{c{\minus}1}}^{R} {\equals}\phi _{0} {\plus}\phi _{1} \left( {\gamma _{{c{\minus}1}}^{R} {\minus}\gamma _{{c{\minus}2}}^{R} } \right){\plus}\omega _{c} $$
The slope of the long-term linear trend is equal to ϕ
0/(1−ϕ
1) if | ϕ
1 | <1. The size of autocorrelations depends on the value of ϕ
1. The term ω
c
is the normal error term with mean zero and variance
 $$\sigma _{\omega }^{2} $$
and is independent of
 $$\left( {{\epsilon}_{{t,1}}^{{}} ,{\rm }{\epsilon}_{{t,2}}^{{}} ,{\rm }{\epsilon}_{{t,3}}^{{}} } \right)$$
. If |ϕ
1|<1, the future variability of
 $$\gamma _{c}^{R} $$
is finite and increases over time. Furthermore, we model the time series of
 $$\kappa _{{t,1}}^{B} $$
and
 $$\kappa _{{t,2}}^{B} $$
with a vector autoregressive process of order one (VAR(1)):
 $$\left( {\matrix{ {\kappa _{{t,1}}^{B} } \cr {\kappa _{{t,2}}^{B} } \cr } } \right){\equals}\left( {\matrix{ {\varphi _{{1,0}} } \cr {\varphi _{{2,0}} } \cr } } \right){\plus}\left[ {\matrix{ {\varphi _{{1,1}} } & {\varphi _{{1,2}} } \cr {\varphi _{{2,1}} } & {\varphi _{{2,2}} } \cr } } \right]{\rm }\left( {\matrix{ {\kappa _{{t{\minus}1,1}}^{B} } \cr {\kappa _{{t{\minus}1,2}}^{B} } \cr } } \right){\plus}\left( {\matrix{ {\xi _{{t,1}} } \cr {\xi _{{t,2}} } \cr } } \right)$$
The size of autocorrelations depends on the values of φ
1,1, φ
1,2, φ
2,1, and φ
2,2. The two terms ξ
t,1 and ξ
t,2 are the bivariate normal error terms with mean zero and covariance matrix Ψ. If it is required that the projected book-to-reference ratio of mortality rates at each age should converge approximately in the long termFootnote
1
, all the eigenvalues of the matrix
 $$\left[ {\matrix{ {\varphi _{{1,1}} } & {\varphi _{{1,2}} } \cr {\varphi _{{2,1}} } & {\varphi _{{2,2}} } \cr } } \right]$$
must be smaller than one in magnitude, and so both
 $$\kappa _{{t,1}}^{B} $$
and
 $$\kappa _{{t,2}}^{B} $$
tend to a constant over time. Under such conditions, the future variability of
 $$\kappa _{{t,1}}^{B} $$
and
 $$\kappa _{{t,2}}^{B} $$
are bounded across time. Note that
 $$\left( {{\epsilon}_{{t,1}}^{{}} ,{\rm }{\epsilon}_{{t,2}}^{{}} ,{\rm }{\epsilon}_{{t,3}}^{{}} ,{\rm }\omega _{c} } \right)$$
and
 $$\left( {\xi _{{t,1}}^{{}} ,{\rm }\xi _{{t,2}}^{{}} } \right)$$
are independent in each year t. More technical details of time series modelling can be found in Tsay (Reference Tsay2002). In fact, using other time series processes could produce very different effects. A sensitivity analysis on time series modelling is provided in section 6.
The CAE+Cohorts model is a two-population extension of the Lee & Carter (Reference Lee and Carter1992) model and also has two main components:
 $${\rm logit }\,q_{{x,t}}^{R} {\equals}\alpha _{x}^{R} {\plus}\beta _{x}^{R} {\rm }\kappa _{t}^{R} {\plus}\gamma _{{t{\minus}x}}^{R} {\equals}\eta _{{x,t}}^{R} $$
(reference component)
 $${\rm logit }\,q_{{x,t}}^{B} {\minus}{\rm logit }\,q_{{x,t}}^{R} {\equals}\alpha _{x}^{B} {\plus}\beta _{x}^{R} {\rm }\kappa _{t}^{B} {\equals}\eta _{{x,t}}^{B} $$
(book component)
In the reference component,
 $$\alpha _{x}^{R} $$
depicts the mortality schedule over age x,
 $$\kappa _{t}^{R} $$
is the mortality index reflecting the overall mortality improvement over time t, with
 $$\beta _{x}^{R} $$
as the age-specific sensitivity measure, and
 $$\gamma _{{t{\minus}x}}^{R} $$
incorporates the cohort effect of the lives who were born in year t−x. In the book component, the difference in the logit mortality rate between the two populations is described by another Lee–Carter structure with the parameters
 $$\alpha _{x}^{B} $$
,
 $$\beta _{x}^{R} $$
(the same
 $$\beta _{x}^{R} $$
as that in the reference component), and
 $$\kappa _{t}^{B} $$
. There are five identifiability constraints
 $$\mathop{\sum}\limits_x {\beta _{x}^{R} } {\equals}1,<$> <$>\mathop{\sum}\limits_t {\kappa _{t}^{R} } {\equals}0,\,\mathop{\sum}\limits_c {\gamma _{c}^{R} } {\equals}0,\,\mathop{\sum}\limits_c {\left( {c{\minus}\bar{c}} \right)\gamma _{c}^{R} } {\equals}0,\,{\rm and}\,\mathop{\sum}\limits_t {\kappa _{t}^{B} } {\equals}0,$$
in which
 $$\bar{c}{\equals}{1 \over {{\rm no}{\rm .}\,{\rm of}\,{\rm cohorts}\,{\rm in}\,{\rm reference}}}\mathop{\sum}\limits_c c $$
. These constraints make sure that all the model parameters have unique solutions. The mortality rates and log likelihood functions can be treated similarly as under the M7-M5 model.
We then model the time series of
 $$\kappa _{t}^{R} $$
as a random walk with drift (RWD), i.e.,
 $$\kappa _{t}^{R} {\equals}d{\plus}\kappa _{{t{\minus}1}}^{R} {\plus}{\epsilon}_{t} $$
. The parameter d is the drift term (slope of the linear trend) and ε
t
is the normal error term with mean zero and variance
 $$\sigma _{{\epsilon}}^{2} $$
. The future variability of
 $$\kappa _{t}^{R} $$
increases over time. Moreover, we model the time series of
 $$\gamma _{c}^{R} $$
as an ARIMA(1,1,0), like in the M7-M5 model, and assume that ε
t
and ω
c
are independent. Finally, we model the time series of
 $$\kappa _{t}^{B} $$
as an autoregressive process of order one, AR(1), i.e.,
 $$\kappa _{t}^{B} {\equals}\varphi _{0} {\plus}\varphi _{1} {\rm }\kappa _{{t{\minus}1}}^{B} {\plus}\xi _{t} $$
. The long-term mean of
 $$\kappa _{t}^{B} $$
is equal to φ
0/(1−φ
1) if |φ
1| <1. The extent of autocorrelations depends on the size of φ
1. The term ξ
t
is the normal error term with mean zero and variance
 $$\sigma _{\xi }^{2} $$
. If it is required that the projected book-to-reference ratio of mortality rates at each age should converge approximately in the long run, | φ
1 | must be smaller than one and so the projected
 $$\kappa _{t}^{B} $$
converges to φ
0/(1−φ
1) over time. (The closer φ
1 is to zero, the faster the process converges.) Under this condition, the future variability of
 $$\kappa _{t}^{B} $$
is bounded across time. The error terms
 $$\left( {{\rm }{\epsilon}_{t}^{{}} ,{\rm }\omega _{c} } \right)$$
and ξ
t
are treated as independent.
The BIC (Bayesian information criterion) values of fitting the two models to the different data sets and the time series parameter estimates are provided in the Appendix.
4. Future Simulations
From a modelling or regulatory perspective (e.g. Comité Européen des Assurances, Reference Carter and Lee2007), evaluating uncertainty of future outcomes needs to cover all of process error, parameter error, and model error (or process risk, parameter uncertainty/risk, and model uncertainty/risk). Here we adapt the residuals bootstrapping method (Koissi et al., Reference Koissi, Shapiro and Högnäs2006, Li, Reference Li2014) to incorporate both process error (variability in the time series) and parameter error (uncertainty in estimating parameters) in simulating future mortality rates:
(a) The residuals from fitting the M7-M5 model or CAE+Cohorts model to the actual data are resampled, with replacement, for each age-time cell within all x and t. The standardised deviance residuals of the two populations are computed by using the two formulae
 $$r_{{x,t}}^{R} {\equals}{\textstyle{1 \over {\sqrt {\hat{\phi }^{R} } }}}{\rm sign}\left( {d_{{x,t}}^{R} {\minus}e_{{x,t}}^{R} {\rm }\hat{m}_{{x,t}}^{R} } \right)\sqrt {2\left( {d_{{x,t}}^{R} \ln \left( {{{d_{{x,t}}^{R} } \mathord{\left/ {\vphantom {{d_{{x,t}}^{R} } {\left( {e_{{x,t}}^{R} {\rm }\hat{m}_{{x,t}}^{R} } \right)}}} \right. \kern-\nulldelimiterspace} {\left( {e_{{x,t}}^{R} {\rm }\hat{m}_{{x,t}}^{R} } \right)}}} \right){\minus}d_{{x,t}}^{R} {\plus}e_{{x,t}}^{R} {\rm }\hat{m}_{{x,t}}^{R} } \right)} $$
and
$$r_{{x,t}}^{B} {\equals}{\textstyle{1 \over {\sqrt {\hat{\phi }^{B} } }}}{\rm sign}\left( {d_{{x,t}}^{B} {\minus}e_{{x,t}}^{B} {\rm }\hat{m}_{{x,t}}^{B} } \right)\sqrt {2\left( {d_{{x,t}}^{B} \ln \left( {{{d_{{x,t}}^{B} } \mathord{\left/ {\vphantom {{d_{{x,t}}^{B} } {\left( {e_{{x,t}}^{B} {\rm }\hat{m}_{{x,t}}^{B} } \right)}}} \right. \kern-\nulldelimiterspace} \!{\left( {e_{{x,t}}^{B} {\rm }\hat{m}_{{x,t}}^{B} } \right)}}} \right){\minus}d_{{x,t}}^{B} {\plus}e_{{x,t}}^{B} {\rm }\hat{m}_{{x,t}}^{B} } \right)} $$
. The dispersion parameters are estimated by
$$\hat{\phi }^{R} {\equals}{\textstyle{1 \over {n_{d}^{R} {\minus}n_{p}^{R} }}}\mathop{\sum}\nolimits_{x,t}{^}{2} {\left( {d_{{x,t}}^{R} \ln \left( {{{d_{{x,t}}^{R} } \mathord{\left/ {\vphantom {{d_{{x,t}}^{R} } {\left( {e_{{x,t}}^{R} {\rm }\hat{m}_{{x,t}}^{R} } \right)}}} \right. \kern-\nulldelimiterspace} {\!\left ( {e_{{x,t}}^{R} {\rm }\hat{m}_{{x,t}}^{R} } \right)}}} \right){\minus}d_{{x,t}}^{R} {\plus}e_{{x,t}}^{R} {\rm }\hat{m}_{{x,t}}^{R} } \right)} $$
and
$$\hat{\phi }^{B} {\equals}{\textstyle{1 \over {n_{d}^{B} {\minus}n_{p}^{B} }}}\mathop{\sum}\nolimits_{x,t}{^}{2} {\left( {d_{{x,t}}^{B} \ln \left( {{{d_{{x,t}}^{B} } \mathord{\left/ \!{\vphantom {{d_{{x,t}}^{B} } {\left( {e_{{x,t}}^{B} {\rm }\hat{m}_{{x,t}}^{B} } \right)}}} \right. \kern-\nulldelimiterspace} {\left( {e_{{x,t}}^{B} {\rm }\hat{m}_{{x,t}}^{B} } \right)}}} \right){\minus}d_{{x,t}}^{B} {\plus}e_{{x,t}}^{B} {\rm }\hat{m}_{{x,t}}^{B} } \right)} ,$$
where
$$n_{d}^{R} $$
and
$$n_{p}^{R} $$
are the number of data points and the number of effective parameters of the reference population, and
$$n_{d}^{B} $$
and
$$n_{p}^{B} $$
are those of the book population.
(b) The inverse functions of the residuals formulae in step (a) are used to turn the resampled residuals into a pseudo sample of the numbers of deaths
$$d_{{x,t}}^{{R{\rm }\left( i \right)}} $$
and
$$d_{{x,t}}^{{B{\rm }\left( i \right)}} $$
for all x and t, in which the superscript (i) represents the ith scenario.(c) The M7-M5 model or CAE+Cohorts model is fitted to the pseudo data sample from step (b) and correspondingly the model parameters
$$\left( {\kappa _{{t,1}}^{{R{\rm }\left( i \right)}} ,\,\kappa _{{t,2}}^{{R{\rm }\left( i \right)}} \,\kappa _{{t,3}}^{{R{\rm }\left( i \right)}} ,\,\gamma _{c}^{{R{\rm }\left( i \right)}} ,\,\kappa _{{t,1}}^{{B{\rm }\left( i \right)}} ,\,\kappa _{{t,2}}^{{B{\rm }\left( i \right)}} ,\,{\rm or}\,\alpha _{x}^{{R{\rm }\left( i \right)}} ,\,\beta _{x}^{{R{\rm }\left( i \right)}} , \kappa _{t}^{{R{\rm }\left( i \right)}} ,\,\gamma _{c}^{{R{\rm }\left( i \right)}} ,<$> <$> \alpha _{x}^{{B{\rm }\left( i \right)}} ,\,\kappa _{t}^{{B{\rm }\left( i \right)}} } \right)$$
are calculated. The step allows for parameter error.(d) The time series processes are fitted to the temporal model parameters of the pseudo data sample
$$\left( {\kappa _{{t,1}}^{{R{\rm }\left( i \right)}} ,\,\kappa _{{t,2}}^{{R{\rm }\left( i \right)}} ,\,\kappa _{{t,3}}^{{R{\rm }\left( i \right)}} ,\,\gamma _{c}^{{R{\rm }\left( i \right)}} ,\,\kappa _{{t,1}}^{{B{\rm }\left( i \right)}} ,\,\kappa _{{t,2}}^{{B{\rm }\left( i \right)}} ,\, {\rm or}\,\kappa _{t}^{{R{\rm }\left( i \right)}} ,\,\gamma _{c}^{{R{\rm }\left( i \right)}} ,\,\kappa _{t}^{{B{\rm }\left( i \right)}} } \right)$$
from step (c) to simulate their future values. This step allows for process error.(e) Samples of future mortality rates,
$$q_{{x,t}}^{{R{\rm }\left( i \right)}} $$
and
$$q_{{x,t}}^{{B{\rm }\left( i \right)}} $$
, for all x and future t, are generated from incorporating the calculated parameters from step (c) and the simulated values from step (d) into
$$\eta _{{x,t}}^{{R{\rm }\left( i \right)}} $$
and
$$\eta _{{x,t}}^{{B{\rm }\left( i \right)}} $$
. This set of future mortality rates forms one random future scenario.(f) Steps (a) to (e) are repeated to produce 5,000 random future scenarios.
(g) For each random scenario, the future number of survivors in the pension portfolio over time is simulated as
$$l_{{x{\plus}1,t{\plus}1}}^{{B{\rm }\left( i \right)}} \sim {\rm Binomial}\left( {{\rm }l_{{x,t}}^{{B{\rm }\left( i \right)}} {\rm },\,1{\minus}q_{{x,t}}^{{B{\rm }\left( i \right)}} } \right)$$
. The notation
$$l_{{x,t}}^{{B{\rm }\left( i \right)}} $$
is the future number of lives aged x at time t in the book population. Different starting values of
$$l_{{x,0}}^{B} $$
at the valuation date may be used in turn to examine the effect of different initial portfolio sizes. (In principle, the future number of lives in the reference population can also be simulated in the same fashion, but we omit this step for computation convenience, as the size of the reference population here is very large for a binomial distribution assumption.)


Note that while Haberman et al. (Reference Haberman, Kaishev, Millossovich, Villegas, Baxter, Gaches, Gunnlaugsson and Sison2014) chose to ignore parameter error of the reference population and did not perform the bootstrapping on the reference population, we still carry out the bootstrapping for both populations in order to formalise the overall procedure. In fact, we have experimented with their approach but realise that it tends to underestimate demographic basis risk. Moreover, the extent of model error (uncertainty in model selection) can be assessed by comparing the results obtained from different models and assumptions. This way requires some form of subjective or qualitative judgement, which may involve certain individual bias. An alternative, being more theoretically sound, is to adopt a Bayesian framework to incorporate all of process error, parameter error, and model error simultaneously. However, this Bayesian approach is technically demanding (e.g. Markov chain Monte Carlo simulation) and much more computationally intensive (Li, Reference Li2014), particularly for use in insurance or actuarial practice.
Using the simulated environment, we implement a simple numerical optimisation procedure to determine the optimal positions of the hedging instruments. In this paper, we set an objective to minimise the 99.5% value-at-risk (VaR) (minus the mean) of the present value of the aggregate pension portfolio position. In practice, other risk measures (e.g. standard deviation and 99.5% expected shortfall) or a mix of different objectives (e.g. risk minimisation with a targeted level of profitability) may also be used, depending on the purpose of the analysis. Note that when the number of unknown quantities to be estimated increases (e.g. multiple index-based derivatives are available for hedging), there may be a higher chance of the procedure getting trapped in a local optimum rather than obtaining the true global optimum. Some simple, practical methods to mitigate this problem include using other sensible starting values, applying alternative numerical algorithms, simplifying the model settings where possible, and repeating the optimisation procedure by setting some or all the previous solutions as the new starting values.
5. Hedging Results
The effectiveness of an index-based longevity hedge can be described as how much longevity risk is transferred away. The remaining part can then be seen as an outcome of longevity basis risk. To be consistent with Coughlan et al. (Reference Coughlan, Khalaf-Allah, Ye, Kumar, Cairns, Blake and Dowd2011), we define the level of longevity risk reduction for a longevity hedge imposed on a pension plan or annuity portfolio as:
 $${\rm longevity}\,{\rm risk}\,{\rm reduction}{\equals}\left( {1{\minus}{{{\rm risk}\left( {{\rm hedged}} \right)} \over {{\rm risk}\left( {{\rm unhedged}} \right)}}} \right){\times}100\,\%\,$$
The terms risk(unhedged) and risk(hedged) are the portfolio’s aggregate longevity risk before and after the hedging. This metric provides the proportion of the portfolio’s initial longevity risk that is being hedged away. We apply some risk measures commonly used in the literature (Dowd & Blake, Reference Dowd and Blake2006), including the variance, standard deviation, 99.5% VaR, and 99.5% expected shortfall (conditional VaR), to the random present value of the portfolio liability. The 99.5% VaR is of particular interest in practice, as it is embedded in the calculation of the Solvency Capital Requirement (SCR) under Solvency IIFootnote 2 . Measuring the levels of risk reduction in different index-based longevity hedges could help identify potential opportunities for capital savings.
In this section, we first consider a simple hypothetical case study of a pension plan to illustrate the concept. The current date is taken as the start of the calendar year 2014. Suppose all the pensioners in the plan are now aged exactly 65 and each pension pays $1 per year on survival from ages 66 to 90. The pension plan is already closed and there are no more new members. The pensioners (book population) have the same mortality experience as that reflected in the CMI data or the ONS data (starting from year 2000 or 2001). The pension plan sponsor intends to minimise the longevity risk exposure by constructing a longevity hedge with standardised longevity swaps. (Note: Bespoke longevity swaps are by far the most commonly used hedging instruments in current practice.) Assume that an index-based 25-year longevity swap for the same birth cohort as the pensioners with annual exchange of payments is available in the de-risking market, in which the reference population in the floating leg is the English and Welsh male population. The payments on the fixed leg of the swap are calculated from the central estimates of future mortality rates, based on the HMD data from year 1980. This simplifying assumption implies a zero risk premium and would affect only the price but not the effectiveness of the hedge. Let the interest rate be 1% p.a. flat during the whole period. (Note: UK Gilt 10-year and 30-year yields were 1.05% p.a. and 1.67% p.a. as at 24 April 2017.) Later we will cover a more complex pension plan with multiple cohorts, in which there are two cases of an open pension plan and a closed one.
The present value of future liability of the pension plan is equal to
 $$\mathop{\sum}\limits_{t{\equals}1}^{25} {{\rm }l_{{65{\plus}t,t}}^{{B{\rm }\left( i \right)}} {\rm }\left( {1{\plus}r} \right)^{{{\rm }{\minus}t}} } $$
, in which r is the interest rate. Moreover, the present value of future cash inflows of the longevity swap as a floating rate receiver is expressed as
 $$\mathop{\sum}\limits_{t{\equals}1}^{25} {\left( {{\rm }{}_{{t{\rm }}}p_{{65}}^{{R{\rm }\left( i \right)}} {\minus}{}_{{t{\rm }}}p_{{65}}^{{R{\rm \,;\, forward}}} } \right)\,\left( {1{\plus}r} \right)^{{{\rm }{\minus}t}} } $$
, where the random future survivor index
 $${}_{{t{\rm }}}p_{{65}}^{{R{\rm }\left( i \right)}} $$
and the forward survivor index
 $${}_{{t{\rm }}}p_{{65}}^{{R{\rm \,;\, forward}}} $$
are calculated by adapting the survival probability formula
 $${}_{t}p_{{65}}^{R} {\equals}\left( {1{\minus}q_{{65,0}}^{R} } \right)\,\left( {1{\minus}q_{{66,1}}^{R} } \right){\rm }...{\rm }\left( {1{\minus}q_{{65{\plus}t{\minus}1,t{\minus}1}}^{R} } \right)$$
. Then the present value of the aggregate pension plan position after taking the longevity hedge is stated as
 $$\mathop{\sum}\limits_{t{\equals}1}^{25} {{\rm }l_{{65{\plus}t,t}}^{{B{\rm }\left( i \right)}} {\rm }\left( {1{\plus}r} \right)^{{{\rm }{\minus}t}} } {\minus}w\mathop{\sum}\limits_{t{\equals}1}^{25} {\left( {{\rm }{}_{{t{\rm }}}p_{{65}}^{{R{\rm }\left( i \right)}} {\minus}{}_{{t{\rm }}}p_{{65}}^{{R{\rm \,;\, forward}}} } \right)\,\left( {1{\plus}r} \right)^{{{\minus}t}} } ,$$
and the cash outflow of the net position at each time t=1, 2, … , 25 is given by
 $$l_{{65{\plus}t,t}}^{{B{\rm }\left( i \right)}} {\minus}w\left( {{\rm }{}_{{t{\rm }}}p_{{65}}^{{R{\rm }\left( i \right)}} {\minus}{}_{{t{\rm }}}p_{{65}}^{{R{\rm \,;\, forward}}} } \right)$$
. The weight w is the notional amount of the longevity swap required to minimise the 99.5% VaR (minus the mean) of the present value of the aggregate position.
For the IMD quintile groups, the portfolio’s initial longevity risk levels before hedging, with regard to the standard deviation, 99.5% VaR (minus the man), and 99.5% expected shortfall (minus the mean), are roughly about 1.5%, 3%, and 4% of the portfolio’s expected present value. Table 4 provides the estimated levels of longevity risk reduction under different initial portfolio sizes. The longevity risk reduction estimates using the standard deviation, 99.5% VaR, and 99.5% expected shortfall (conditional VaR) vary from about 60% to 95% for the three largest portfolio sizes. These estimates are quite close between the three risk measures in general. On the other hand, the estimates using the variance, which has a different scale to the others, are usually larger at 90% or over for the bigger portfolios. Moreover, as the initial portfolio size becomes smaller, sampling basis risk in the future simulations grows in significance, and consequently the risk reduction level decreases. But this decline in risk reduction looks a little uneven, and is not too significant until the portfolio size drops to 25,000 and below. For a small portfolio size of 1,000, the risk reduction levels decrease to around 30%–40% only. (Those reductions smaller than 50% are shaded in all the tables.) These results suggest that sampling basis risk is negligible when the portfolio has more than, say, around 20,000 lives, but the effect can be significant when the portfolio size is down to just a few thousand.
Level of longevity risk reduction (in % of initial longevity risk) in a hypothetical scenario of England index of multiple deprivation quintile groups of a single male cohort.

Note: VaR, value-at-risk; ES, expected shortfall.
Furthermore, for the bigger portfolios, the third most deprived areas have greater risk reductions than the others. It implies that the simulated
 ${}_{{t{\rm }}}p_{{65}}^{{B{\rm }\left( i \right)}} $
and
 $${}_{{t{\rm }}}p_{{65}}^{{R{\rm }\left( i \right)}} $$
have higher dependence for the third most deprived areas. The people living in these areas have medium income, employment, education, and so on, and they can potentially be matched more closely by the overall reference population. In contrast, the most deprived areas have the smallest risk reduction estimates for the larger portfolio sizes, ranging from around 60%–70%. This observation suggests that the simulated
 ${}_{{t{\rm }}}p_{{65}}^{{B{\rm }\left( i \right)}} $
of the most deprived groups may deviate more significantly from the simulated
 $${}_{{t{\rm }}}p_{{65}}^{{R{\rm }\left( i \right)}} $$
of the general population when compared to the other groups.
Besides the overall present value, we also investigate the individual cash flows and compute their risk reduction levels specifically in each future year. Figure 4 shows the risk reduction effect (in terms of 99.5% VaR) of the cash flows in each year for a portfolio size of 100,000 males under the CAE+Cohorts model. It can be seen that the risk reduction estimates of the individual cash flows are actually very small in the early years, but they increase progressively over time to reach a high level in the later years. This effect appears to arise from the fact that the RWD in the reference component produces unbounded future variability whereas the AR(1) in the book component yields bounded future variability. The variability in the latter would reduce in significance relatively across time, meaning that the simulated differences between the two populations would become less important comparatively, resulting in a lower level of demographic basis risk being modelled for the longer term. This model implication is in line with the usual view that two related populations’ mortality improvements may diverge temporarily but would likely move back in line as time goes by. Its significance will further be tested in section 6.
Level of longevity risk reduction (in % of initial longevity risk; in terms of 99.5% value-at-risk) of individual cash flows in a hypothetical scenario of England index of multiple deprivation quintile groups of a single cohort of 100,000 males under CAE+Cohorts model.

We now study a more realistic hypothetical scenario of a pension plan with multiple cohorts. Suppose there are currently 30,000 pensioners in the plan, and their demographic structure, from ages 60 to 89, is displayed in Figure 5. We consider two cases of an open pension plan and a closed plan. For the open pension plan, 1,400 new members join the plan at age 60 every year, and an index-based longevity swap for the cohort aged 60 now and with a maturity of 30 years is used to construct the hedge. On the other hand, for the closed pension plan, there are no new members, and two index-based longevity swaps for the two cohorts aged 60 and 70 now, with maturities of 30 and 20 years, respectively, are used for the hedge. Each pension pays $1 per year on survival from ages 61 to 90. The duration of the hedging scheme is 30 years from the current date, and we only consider the portfolio cash flows during this period. All the other previous settings are kept equal.
Initial demographic structure of a hypothetical pension plan with multiple cohorts.

Note that for the open pension plan, those aged 31–59 now will join the plan later in the future, while the current pensioners are aged 60–89. For demonstration purposes, we use a single longevity swap for the cohort aged 60 now, which is in the middle of the age range under consideration. For the closed pension plan, we use two longevity swaps for the two cohorts aged 60 and 70 now, in which the first one covers the entire duration and the second one refers roughly to the weighted average age of the current pensioners. Table 5 shows that the longevity risk reduction estimates regarding the standard deviation and the extreme risk measures range largely from about 40% to 60% for the open pension plan, and from around 60%–80% for the closed pension plan. These estimates are generally smaller than those in Table 4, because the earlier scenario involves one swap to match one cohort exactly, while the two portfolios here use only one or two swaps to hedge multiple cohorts approximately. Consequently, the extent of demographic basis risk, in terms of age or cohort differences, is greater in these cases. Moreover, the closed pension plan has larger risk reduction estimates than the open pension plan, as the closed plan uses two swaps to hedge only the current pensioners with no new members.
Level of longevity risk reduction (in % of initial longevity risk) in a hypothetical scenario of England index of multiple deprivation quintile groups of 30,000 males of multiple cohorts.

Note: VaR, value-at-risk; ES, expected shortfall.
When the life market is immature, the index-based swap transactions available may be restricted to a few major cohorts due to liquidity issues (e.g. Coughlan et al., Reference Coughlan, Khalaf-Allah, Ye, Kumar, Cairns, Blake and Dowd2011), and an “approximate” hedge can be constructed like the demonstration above. If longevity swaps for multiple cohorts and with varying maturities become available in the market, they may be exploited to reduce the extent of demographic basis risk and improve the overall hedge effectiveness. However, the number of pensioners at each age in the example here is only around a thousand or less, and calibrating one unique swap to each single cohort separately would induce much sampling basis risk. An alternative approach is to calibrate multiple swaps altogether as a group to the whole plan, instead of mapping specifically one swap on each cohort. The overall hedge effectiveness could then be improved, although implicitly there would be some offsetting effects between the swaps of different cohorts. We now test eleven index-based longevity swaps for the cohorts aged 35, 40, 45, … , 85 at present on the open pension plan, with a (delayed) maturity of 5, 10, 15, 20, 25 years for those who have not joined the plan as yet and maturities of 30, 25, 20, 15, 10, 5 years for the current pensioners. We also try six index-based longevity swaps for the cohorts aged 60, 65, 70, … , 85 now on the closed pension plan, with maturities 30, 25, 20, … , 5 years, respectively. Table 6 illustrates that this alternative approach of using “aggregate calibration”’ with 5-year age buckets increases the risk reduction estimates in many of the cases. The effect is more obvious for the open pension plan, which comprises both existing pensioners and new members but has involved only one swap in the previous setting. Though there would be intricate subsidising effects across the swaps of different cohorts, it appears that the aggregate amount of demographic basis risk is decreased and the overall hedge effectiveness is improved. Comparatively, the effect of including more swaps is mild for the closed pension plan, which suggest that the two swaps in the previous setting with 10-year age buckets would already be adequate to cover the lives of multiple cohorts in that case and more precise hedging would not lead to much improvement.
Level of longevity risk reduction (in % of initial longevity risk) in a hypothetical scenario of England index of multiple deprivation quintile groups of 30,000 males of multiple cohorts (with swaps of 5-year age buckets).

Note: VaR, value-at-risk; ES, expected shortfall.
For the CMI pensioners, the initial longevity risk levels before hedging, with regard to the standard deviation and the tail risk measures, are approximately around 1.5%, 3.5%, and 4.5% of the expected present value. Tables 7–9 present the risk reduction results for the CMI pensioners, which have similar patterns to those of the IMD quintile groups. For instance, the longevity risk reduction estimates regarding the standard deviation and the tail risk measures are mostly in the range of around 50%–80% for a portfolio size of 100,000. When the portfolio size is just 1,000, the estimates decrease to about 30%–40% only. Also, more precise hedging often leads to better hedge effectiveness. On the other hand, for the bigger portfolios, the CMI pensioners generally have smaller risk reduction estimates than the IMD quintile groups. Note that the IMD groups are significant sectors of the entire population and so they can be matched more closely by the reference population. But for the smaller portfolios, the differences in the hedging results between the CMI pensioners and the IMD groups are less clear, which again highlight the importance of sampling basis risk. In addition, the two models produce more different results between them for the CMI pensioners, which may be due to the smaller data sizes of the CMI data set. The noisy patterns in a smaller data sample may have been captured somewhat differently under the unique properties of each model.
Level of longevity risk reduction (in % of initial longevity risk) in a hypothetical scenario of Continuous Mortality Investigation pensioners of a single male cohort.

Note: VaR, value-at-risk; ES, expected shortfall.
Level of longevity risk reduction (in % of initial longevity risk) in a hypothetical scenario of Continuous Mortality Investigation pensioners of 30,000 males of multiple cohorts.

Note: VaR, value-at-risk; ES, expected shortfall.
Level of longevity risk reduction (in % of initial longevity risk) in a hypothetical scenario of Continuous Mortality Investigation pensioners of 30,000 males of multiple cohorts (with swaps of 5-year age buckets).

Note: VaR, value-at-risk; ES, expected shortfall.
In the CMI data set, the financials and technology industries have only around 10,000 lives or less per year in their data. The high sampling variability in a small dataset may flow through to the temporal parameters computed, leading to an overestimation of demographic basis risk. The characterisation approach in Haberman et al. (Reference Haberman, Kaishev, Millossovich, Villegas, Baxter, Gaches, Gunnlaugsson and Sison2014) may then be adopted, in which the book data (with a small size) are not modelled directly but a combination of some alternative proxy data (with large sizes) is modelled instead. For instance, comparing the average mortality levels and improvement rates between Tables 1 and 2, the lower (higher) pension group in financials may be proxied by the fourth most (least) deprived IMD group. For a pension plan with 100,000 lives all aged 65, assuming half of the lives have a low pension and the other half have a high pension, the risk reduction estimates regarding the standard deviation and the tail risk measures are 85%, 86%, and 82%, respectively, using the M7-M5 model, and are 82%, 78%, and 76% using the CAE+Cohorts model, via the characterisation approach. For the former case, the VAR(1) process in the book components of the two characterising groups has four dimensions in total, while for the latter case, it has only two dimensions. We find that it is practically difficult for the VAR(1) process in the first case to possess the convergence property. So we adopt a reduced version of the time series process, which is to fit a bivariate VAR(1) process to each characterising group and assumes that the error terms of the two bivariate processes are correlated. Finally, it should be noted that the mapping in the example above is not precise at all and better proxies can be sought if book data with more details on categorising pensioners or policyholders are available.
6. Sensitivity Analysis
In this section, we carry out a sensitivity analysis on the hedging results by making a series of changes to the initial model settings and assumptions. The tested items include the interest rate, swap weight, older ages, data fitting period, simulation method, other mortality projection models, and additional model features. When a change is made, other things are kept equal unless otherwise specified. This analysis allows us to have a better understanding of the robustness of the hedging results under different conditions. Table 10 shows that in general, as the interest rate increases, the risk reduction estimates for the present value decreases. The later individual cash flows have greater risk reduction and are affected more by a higher interest rate than the earlier cash flows. As such, the aggregate risk reduction decreases as the interest rate rises. But from an interest rate of 1%–5% p.a., the changes in the estimates shown in the table are only 9% or less in magnitude. Furthermore, the hedging results under a variable interest rate environment simulated from the discretised Cox–Ingersoll–Ross (CIR) modelFootnote 3 are also given in the table. The model is fitted to the most recent few years of historically low interest rates. The risk reduction estimates are clearly smaller under variable interest rates than under constant interest rates, reflecting the influence of interest rate risk. Although it is difficult to foresee how long the current low interest rates would last, it can be perceived that higher interest rates with more fluctuations would reduce the hedge effectiveness further. Interest rate swaps and government bonds may then be incorporated into the hedging scheme to reduce the impact of interest rate risk (Tsai et al., Reference Tsai, Tzeng and Wang2011).
Levels of longevity risk reduction (in % of initial longevity risk; M7-M5 (left figure) versus CAE+Cohorts (right figure)) under different interest rate assumptions.

Note: CMI, Continuous Mortality Investigation; IMD, index of multiple deprivation; VaR, value-at-risk; ES, expected shortfall; CIR, Cox–Ingersoll–Ross.
So far, the estimation of the optimal positions and hedging results has been based on simulated scenarios from the fitted M7-M5 model or CAE+Cohorts model and numerical optimisation with regard to the 99.5% VaR. If the standard deviation or the 99.5% expected shortfall (conditional VaR) is taken as the risk measure instead in the optimisation process, it can be seen from Table 11 that the resulting differences are minimal. This observation is probably a result of the simulated distribution of the portfolio present value, which looks largely symmetric without much skewness. Moreover, when the swap size is simply set as the initial portfolio size (i.e. a hedge ratio of one), the corresponding differences in risk reduction are also very small, because the original, numerically optimised hedge ratio is actually quite close to one. Furthermore, when the swap weight is computed from a “wrong” model which is different to the one being used to generate the simulations, there is still not much change in the risk reduction estimates.
Levels of longevity risk reduction (in % of initial longevity risk; M7-M5 (left figure) versus CAE+Cohorts (right figure)) using different swap weights.

Note: CMI, Continuous Mortality Investigation; IMD, index of multiple deprivation; VaR, value-at-risk; ES, expected shortfall.
We also test a wider age range from 60 to 99. The ONS population data are not split by single age for ages 90+ and the corresponding HMD old-age proportions are used as a proxy here. The two models are re-fitted to the new age range. Suppose that there are four different pensions, in which one pays £1 per year on survival from ages 66 to 90 for those pensioners aged 65 at present (as in the original settings), one from ages 66 to 100 for those aged 65 now, one from ages 76 to 100 for those aged 75 now, and one from ages 86 to 100 for those aged 85 presently. Assume that index-based longevity swaps for the same birth cohorts as the pensioners are available with maturities of 25, 35, 25, and 15 years, respectively. The figures in the first two rows of Table 12 suggest that the models are fairly robust to incorporating advanced ages into the modelling process, except for some estimates of the IMD quintile group, which may be caused by the use of approximate population data for ages 90+. Also, it is observed that the risk reduction levels are higher for those pensions with longer durations, as the later individual cash flows have greater risk reduction effect than the earlier cash flows.
Levels of longevity risk reduction (in % of initial longevity risk; M7-M5 (left figure) versus CAE+Cohorts (right figure)) using older ages in modelling.

Note: CMI, Continuous Mortality Investigation; IMD, index of multiple deprivation; VaR, value-at-risk; ES, expected shortfall.
Table 13 demonstrates that the differences in risk reduction between two fitting periods for the reference population starting from years 1980 and 1990 are within 5%. Using a slightly shorter data period (starting from 1 or 2 years later) for the book population, the risk reduction levels change by 6% or less. It seems that the two models are quite robust to different data fitting periods, but book data of a longer period are needed to carry out a more thorough testing.
Levels of longevity risk reduction (in % of initial longevity risk; M7-M5 (left figure) versus CAE+Cohorts (right figure)) using different data fitting periods.

Note: CMI, Continuous Mortality Investigation; IMD, index of multiple deprivation; VaR, value-at-risk; ES, expected shortfall.
Besides residuals bootstrapping, a simpler parametric method is to simulate the errors of the fitted time series processes directly to generate random future mortality rates. This method, however, allows for only process error but not parameter error, and may understate longevity basis risk. The figures in Table 14 reveal that the parametric method does underestimate demographic basis risk and so overestimates the level of longevity risk reduction by around 8%–20% in magnitude. Proper allowance for parameter error is important, though the parametric method is generally much faster than the residuals bootstrapping process.
Levels of longevity risk reduction (in % of initial longevity risk; M7-M5 (left figure) versus CAE+Cohorts (right figure)) using different simulation methods.

Note: CMI, Continuous Mortality Investigation; IMD, index of multiple deprivation; VaR, value-at-risk; ES, expected shortfall.
Based on the previous simulations, the differences in the risk reduction estimates between the M7-M5 and CAE+Cohorts models become more obvious when the data size is small or when the hedging scheme is not precise enough. Since model error is not negligible under certain conditions, three extra models are considered here for further comparison. The first model is a cohort extension of the first approach in Carter & Lee (1992), which applies the Lee & Carter (Reference Lee and Carter1992) model to each population and then co-models the two mortality indices:
 $${\rm logit}\,q_{{x,t}}^{R} {\equals}\alpha _{x}^{R} {\plus}\beta _{x}^{R} {\rm }\kappa _{t}^{R} {\plus}\gamma _{{t{\minus}x}}^{R} $$
(reference population)
 $$\hskip-96pt {\rm logit}\,q_{{x,t}}^{B} {\equals}\alpha _{x}^{B} {\plus}\beta _{x}^{B} {\rm }\kappa _{t}^{B} {\plus}\gamma _{{t{\minus}x}}^{R} $$
(book population)
 $$\hskip 22pt {\rm K}_{t} {\equals}\Theta {\plus}{\rm K}_{t {{{\minus}1}}} {\plus}\Delta _{t} $$
(bivariate random walk with drift`)
The notation
 $${\rm K}_{t} {\equals}\left( {\kappa _{t}^{R} {\rm },{\rm }\kappa _{t}^{B} } \right){\rm }'$$
, Θ is the vector drift term, and Δ
t
is the bivariate normal error term. The second model is a cohort extension of the third approach in Carter & Lee (1992), which assumes that the two mortality indices follow a co-integrated process (Li & Hardy, Reference Li and Hardy2011):
 $${\rm logit }\,q_{{x,t}}^{R} {\equals}\alpha _{x}^{R} {\plus}\beta _{x}^{R} {\rm }\kappa _{t}^{R} {\plus}\gamma _{{t{\minus}x}}^{R} $$
(reference population)
 $$\hskip-96pt {\rm logit}\,q_{{x,t}}^{B} {\equals}\alpha _{x}^{B} {\plus}\beta _{x}^{B} {\rm }\kappa _{t}^{B} {\plus}\gamma _{{t{\minus}x}}^{R} $$
(book population)
 $$\hskip-140pt \kappa _{t}^{R} {\equals}\theta {\plus}\kappa _{{t{\minus}1}}^{R} {\plus}\delta _{t} $$
(RWD)
 $$\hskip-132pt \kappa _{t}^{B} {\equals}a_{0} {\plus}a_{1} {\rm }\kappa _{t}^{R} {\plus}\omega _{t} $$
(co-integrated process)
The parameters θ, a 0, and a 1 define the co-integrated process, and δ t and ω t are independent normal error terms. The final one is a cohort extension of the model proposed by Zhou et al. (Reference Zhou, Li and Tan2013), which uses a common age-specific sensitivity measure between the two populations and a weakly stationary AR(1) process for the difference between the two mortality indices:
 $${\rm logit}\,q_{{x,t}}^{R} {\equals}\alpha _{x}^{R} {\plus}\beta _{x}^{R} {\rm }\kappa _{t}^{R} {\plus}\gamma _{{t{\minus}x}}^{R} $$
(reference population)
 $$\hskip-96pt {\rm logit}\,q_{{x,t}}^{B} {\equals}\alpha _{x}^{B} {\plus}\beta _{x}^{R} {\rm }\kappa _{t}^{B} {\plus}\gamma _{{t{\minus}x}}^{R} $$
(book population)
 $$\hskip-139pt \kappa _{t}^{R} {\equals}\theta {\plus}\kappa _{{t{\minus}1}}^{R} {\plus}\delta _{t} $$
(RWD)
 $$\hskip-72pt \kappa _{t}^{R} {\minus}\kappa _{t}^{B} {\equals}b_{0} {\plus}b_{1} \left( {\kappa _{{t{\minus}1}}^{R} {\minus}\kappa _{{t{\minus}1}}^{B} } \right){\plus}\omega _{t} $$
(AR(1) process)
The notation θ, b 0, and b 1 are the parameters of the time series processes, and δ t and ω t are independent normal error terms.
The first two extra models above are “non-coherent” while the last model is “coherent” (Li & Lee, Reference Li and Lee2005). When a two-population mortality projection model is coherent, the projected (central estimate) ratio of future mortality rates between the two populations at each age tends to a constant in the long term. The common view in the literature is that two related populations’ future mortality trends may deviate in the short term but would move more consistently over the long term. A lack of this long-term coherence in the modelling may result in an overestimation of longevity basis risk. Apart from the coherence of the central estimates, the simulated future variability is also an important factor. Under the first two models, both kappa parameters of the two populations have unbounded future variability. But under the last model, while the kappa parameter of the reference population also has unbounded future variability, the difference between the kappa parameters of the two populations has bounded future variability. The major implication is that the two populations’ future mortality movements could diverge more freely under the first two models, especially in the long term, but they would become more consistent over time under the last model.
Table 15 provides the risk reduction estimates computed from the M7-M5 and CAE+Cohorts models and also the three extra models discussed above. The first two extra models, which are non-coherent and have unbounded future variability, produce very small risk reduction estimates. It appears that there is a significant overestimation of demographic basis risk. By contrast, the M7-M5 model, the CAE+Cohorts model, and the last extra model are all coherent and have bounded future variability between the two populations. Their risk reduction estimates are broadly in agreement with one another and reflect a more proper allowance for demographic basis riskFootnote 4 . In spite of the differences in the structures between the various types of two-population mortality projection models, the coherence property and the behaviour of simulated future variability, which depend largely on the assumed time series processes, are the major factors in determining the calculated level of longevity risk reduction.
Levels of longevity risk reduction (in % of initial longevity risk) under different two-population mortality projection models.

Note: CMI, Continuous Mortality Investigation; IMD, index of multiple deprivation; VaR, value-at-risk; ES, expected shortfall.
In the past century, mortality improvement trends have not always been so smooth over time. There could be one-off events such as wars, epidemics, and catastrophes, leading to temporary, sharp changes in mortality levels (i.e. mortality jumps). There could also be long-term effects like medical developments and climate changes, resulting in permanent shifts in mortality improvement rates (i.e. structural changes). Figure 6 displays the mortality index of the English and Welsh male population, in which there are a few “mortality spikes” (red) before 1950 and a shift in the improvement trend (blue) during around 1970. It is difficult to allow for them in the modelling process as these events are either rare or hard to detect precisely. Based on the HMD data of several developed countries, we examine three additional scenarios here using some arbitrary assumptions. The first scenario involves structural changes, the second one involves mortality jumps, and the final one has both. We adjust the last extra model in Table 15 to incorporate these effects, which are implicitly assumed to have the same kind of impact on the two populations:
 $$\hskip 4pc\kappa _{t}^{{R{\asterisk}}} {\equals}\theta _{t} {\plus}\kappa _{{t{\minus}1}}^{{R{\asterisk}}} {\plus}\delta _{t} \,\hskip 4pc({\rm RWD}\,{\rm modified}\,{\rm with}\,{\rm variable}\,{\rm drift}\,\theta _{t} ,\,{\rm i}{\rm .e}{\rm .}\,{\rm structural}\,{\rm changes})$$
 $$\hskip 4pc\kappa _{t}^{R} {\equals}\kappa _{t}^{{R{\asterisk}}} {\plus}N_{t} \,Y_{t} \, \hskip 8pc\left({{\rm RWD}\,{\rm further}\,{\rm modified}\,{\rm with}\,{\rm mortality}\,{\rm jumps}\,N_{t} \,Y_{t} } \right)$$
 $$\hskip 3pc\theta _{t} {\equals}(2\theta ,\theta ,\theta {\rm /}2)^{'} \hskip 5pc\,({\rm structural}\,{\rm changes}’ \,{\rm transition}\,{\rm matrix}\,\left( {\matrix{ {0.99} & {0.01} & 0 \cr {0.01} & {0.98} & {0.01} \cr 0 & {0.01} & {0.99} \cr } } \right))$$
 $${\rm Pr}\left( {N_{t} {\equals}0} \right){\equals}0.99,\,{\rm Pr}\left( {N_{t} {\equals}1} \right){\equals}0.01$$
(frequency of a mortality jump)
 $$Y_{t} \sim {\rm Normal}\left( {30,10^{2} } \right)$$
(severity of a mortality jump)
Mortality index of English and Welsh male population under CAE+Cohorts model.

in which the parameter values are very approximately deduced from the frequencies and severities of such historical incidents as the World Wars, Spanish Flu, and past structural changes in mortality improvement. These additional features can be switched off by simply setting θ t as a constant and N t as zero.
Table 16 illustrates that the inclusion of structural changes increases the risk reduction estimates with regard to the tail risk measures by more than 10% in magnitude, but the integration of mortality jumps produces very little changes in risk reduction. As structural changes are assumed to have an ongoing impact on both populations in the model, the two populations’ mortality levels would move more consistently over the long term, and so demographic basis risk would reduce. In contrast, the temporary effects of mortality jumps do not have much influence on the risk reduction levels. Considering the importance of structural changes, we further consider two more scenarios: (a) θ
t
=(3θ, θ, θ/2)'; and (b)
 $$\kappa _{t}^{R} {\minus}\kappa _{t}^{{B{\asterisk}}} {\equals}b_{0} {\plus}b_{1} \left( {\kappa _{{t{\minus}1}}^{R} {\minus}\kappa _{{t{\minus}1}}^{{B{\asterisk}}} } \right){\plus}\omega _{t} $$
, η
t
=(0.2θ, 0, 0)', ι
t
=ι
t−1+η
t
,
 $$\kappa _{t}^{B} {\equals}\kappa _{t}^{{B{\asterisk}}} {\plus}\iota _{t} $$
, in which η
t
and θ
t
are independent. The first one has a bigger drop in mortality than the previous cases when there is a structural change, and the second one involves a possibility of a greater structural impact on the book population than on the reference population, where the model becomes non-coherent. In the first case, the risk reduction estimates are larger than previously, because the impact of structural changes on both populations are bigger at the same time. In the second case, the risk reduction levels are lower, as there is a possibility of long-term deviations between the two populations which lead to higher demographic basis risk.
Levels of longevity risk reduction (in % of initial longevity risk) using models with additional features deduced from historical incidents.

Note: CMI, Continuous Mortality Investigation; IMD, index of multiple deprivation; VaR, value-at-risk; ES, expected shortfall.
As mentioned earlier, the M7-M5 and CAE+Cohorts models are coherent, under which the projected book-to-reference ratio of future mortality rates at each age converges to a constant in the long term. But in the short term, the two projected trends could deviate from each other, the extent to which depends on how quickly the fitted time series process in the book component converges in the projections. For instance, under the CAE+Cohorts model, the projected values of
 $$\kappa _{t}^{B} $$
reach the constant φ
0/(1−φ
1) faster if φ
1 is closer to zero. Moreover, under the two models, the fitted time series processes in the reference component generate unbounded future variability, while those in the book component produce bounded future variability. The former variability would dominate gradually while the latter would reduce in its influence. Consequently, the extent of demographic basis risk would decrease over time in the future simulations.
To further investigate the significance of times series modelling assumptions, we now consider five possible variations. The first one is to use univariate RWD processes in the reference component under the M7-M5 model. The second alternative is to remove the independence assumption between the time series error terms of the two components. The third one is to use integrated autoregressive processes in the reference component. The fourth is to select a higher order of two for the autoregressive processes in the book component. The final alternative is to apply random walk without drift processes in the book component.
Table 17 gives the level of longevity risk reduction for each set of time series processes. When univariate RWD processes rather than the MRWD are used in the reference component under the M7-M5 model, the risk reduction levels are slightly lower, though the differences seem to be immaterial. When the time series error terms of the two components are treated as correlated instead of independent, the changes in the risk reduction estimates are mostly negligible. It appears that both of these correlation assumptions do not have a significant impact on the computation of hedge effectiveness.
Levels of longevity risk reduction (in % of initial longevity risk) using different sets of time series processes.

Note: CMI, Continuous Mortality Investigation; IMD, index of multiple deprivation; VaR, value-at-risk; ES, expected shortfall; MRWD, multivariate random walk with drift; VAR, vector autoregressive process; RWD, random walk with drift; AR, autoregressive; VARIMA, vector autoregressive integrated moving average; ARIMA, autoregressive integrated moving average; BRW, bivariate random walk without drift; RW, random walk without drift.
If the MRWD (RWD) in the reference component under the M7-M5 (CAE+Cohorts) model is replaced by the vector autoregressive integrated moving average VARIMA(1,1,0) process (ARIMA(1,1,0)), the risk reduction estimates drop by about 10% (5%) in magnitude. Though the integrated autoregressive processes, like the random walk processes, generate unbounded future variability, the precise levels of their variability across time would be different to those of the random walk processes, leading to different risk reduction levels. Moreover, the projected paths of the integrated autoregressive processes would take some time to converge to the ultimate linear trends and the speed of convergence depends on the values of the autoregressive parameters computed.
When a higher order of two is used for the VAR process in the book component under the M7-M5 model, the risk reduction estimates are much smaller. Though the VAR(2) is still weakly stationary, its speed of convergence is slower than that of the original VAR(1), because of the longer lag and greater autoregressive effects. Thus the projected trends of the two populations would deviate for a longer period before the final convergence, resulting in lower risk reduction levels. On the other hand, the AR(2) in the book component under the CAE+Cohorts model still coverages quickly, so there is not much change in risk reduction.
When the autoregressive processes in the book component are replaced by the random walk without drift processes (bivariate BRW or univariate RW), the two mortality projection models are still coherent because of the flat projected trends of the book component. But Table 17 shows that the risk reduction estimates then become very small. The random walk processes produce unbounded future variability, and so the two populations’ mortality movements could diverge significantly in the future simulations, especially in the long term. It can be seen again that the assumed behaviour of simulated future variability of the book component is critical in the calculation of longevity risk reduction.
7. Concluding Remarks
In this paper, we have conducted an extensive study on modelling longevity basis risk and measuring longevity risk reduction in index-based swap hedging. We first examine the past mortality rates and improvements based on the CMI, ONS, and HMD data sets. Then we derive in detail the fitting procedures of the M7-M5 and CAE+Cohorts models and the bootstrapping method. After defining the level of longevity risk reduction, we investigate a range of hedging scenarios including open or closed pension plans of a single cohort or multiple cohorts with different portfolio sizes. In particular, we use index-based longevity swaps to construct the longevity hedge. The major finding is that the risk reduction levels are often around 50%–80% for a large portfolio, whereas the risk reduction estimates are usually smaller than 50% for a small portfolio. While the precise level of risk reduction depends on the specific hedging scenario being considered, index-based longevity hedging looks more effective for a larger pension plan and under a more tailored hedging scheme.
Finally, we carry out a thorough sensitivity testing on the hedging results by making a variety of changes to the original model settings and assumptions, and also the time series processes. The most significant modelling assumptions and settings include the behaviour of simulated future variability of the book component, portfolio size, speed of reaching coherence between the two populations, data size and characteristics, simulation method, and mortality structural changes. Relatively, the other conditions tested have limited influence on the calculated hedging results. In building an index-based longevity hedge for a pension plan or annuity portfolio, one should contemplate these factors and perform adequate testing on their potential impact on hedge effectiveness. Further research is needed when more data of longer periods and for different types of pension plans can be collected in the future.
Acknowledgements
Much of this work forms part of the longevity basis risk research project (Phase 2) completed by Macquarie University and sponsored by the Institute and Faculty of Actuaries and the Life and Longevity Markets Association. The authors would like to thank the editor and the referees for their valuable comments and suggestions which enhance the presentation of this paper. The authors thank the CMI and the ONS for their support in providing their data sets. The authors also thank Kam Kuen (Kenny) Mok, Sixian (Alice) Tang, Kenneth Wong, and Jia (Jacie) Liu for their excellent research assistance.
Appendix
The parameters in the reference component of the M7-M5 model are first computed using the updating equation
 $$\theta ^{{\asterisk}} {\equals}\theta {\minus}{{{\textstyle{{\partial l} \over {\partial \theta }}}} \mathord{\left/ {\vphantom {{{\textstyle{{\partial l} \over {\partial \theta }}}} {{\textstyle{{\partial ^{2} l} \over {\partial \theta ^{2} }}}}}} \right. \kern-\nulldelimiterspace} {{\textstyle{{\partial ^{2} l} \over {\partial \theta ^{2} }}}}}$$
(Brouhns et al., Reference Brouhns, Denuit and Vermunt2002) and the following iterative updating scheme:
(a) Set the initial parameter values of
$$\kappa _{{t,1}}^{R} $$
,
$$\kappa _{{t,2}}^{R} $$
,
$$\kappa _{{t,3}}^{R} $$
, and
$$\gamma _{c}^{R} $$
to zero and calculate
$$\hat{\eta }_{{x,t}}^{R} $$
and
$$\hat{m}_{{x,t}}^{R} $$
for all x and t, which are the fitted values of
$$\eta _{{x,t}}^{R} $$
and
$$m_{{x,t}}^{R} $$
.(b) Update
$$\kappa _{{t,1}}^{R} $$
for all t.(c) Recalculate
$$\hat{\eta }_{{x,t}}^{R} $$
and
$$\hat{m}_{{x,t}}^{R} $$
for all x and t and then update
$$\kappa _{{t,2}}^{R} $$
for all t.(d) Recalculate
$$\hat{\eta }_{{x,t}}^{R} $$
and
$$\hat{m}_{{x,t}}^{R} $$
for all x and t and then update
$$\kappa _{{t,3}}^{R} $$
for all t.(e) Recalculate
$$\hat{\eta }_{{x,t}}^{R} $$
and
$$\hat{m}_{{x,t}}^{R} $$
for all x and t and then update
$$\gamma _{c}^{R} $$
for all c.(f) Adjust
$$\kappa _{{t,1}}^{R} $$
,
$$\kappa _{{t,2}}^{R} $$
,
$$\kappa _{{t,3}}^{R} $$
, and
$$\gamma _{c}^{R} $$
for all t and c to incorporate the three identifiability constraints.(g) Recalculate
$$\hat{\eta }_{{x,t}}^{R} $$
and
$$\hat{m}_{{x,t}}^{R} $$
for all x and t and then calculate l
R
.(h) Repeat steps (b) to (g) until the increase in l R is less than 10−11.


Table A.1 lists the various equations we have derived for implementing this updating scheme.
Equations derived for iterative updating scheme under M7-M5 model.

Taking the computed parameters
 $$\hat{\kappa }_{{t,1}}^{R} $$
,
 $$\hat{\kappa }_{{t,2}}^{R} $$
,
 $$\hat{\kappa }_{{t,3}}^{R} $$
, and
 $$\hat{\gamma }_{c}^{R} $$
from above as given (i.e. conditional likelihood), the parameters in the book component of the M7-M5 model are estimated via the updating equation again and the iterative updating scheme below:
(a) Set the initial parameter values of
$$\kappa _{{t,1}}^{B} $$
and
$$\kappa _{{t,2}}^{B} $$
to zero and calculate the fitted values
$$\hat{\eta }_{{x,t}}^{B} $$
and
$$\hat{m}_{{x,t}}^{B} $$
for all x and t.(b) Update
$$\kappa _{{t,1}}^{B} $$
for all t.(c) Recalculate
$$\hat{\eta }_{{x,t}}^{B} $$
and
$$\hat{m}_{{x,t}}^{B} $$
for all x and t and then update
$$\kappa _{{t,2}}^{B} $$
for all t.(d) Recalculate
$$\hat{\eta }_{{x,t}}^{B} $$
and
$$\hat{m}_{{x,t}}^{B} $$
for all x and t and then calculate l
B
.(e) Repeat steps (b) to (d) until the increase in l B is less than 10−11.


Empirically, we find that the tolerance level of 10−11 is often sufficient to ensure the parameters converge in the iterative estimation process.
The parameters in the reference component of the CAE+Cohorts model are calculated by the same updating equation and the iterative updating scheme below:
(a) Set the initial parameter values of
$$\alpha _{x}^{R} $$
as the average (over time) logit mortality rate of the reference population observed at age x,
$$\beta _{x}^{R} $$
as
$${\textstyle{{\rm 1} \over {{\rm no}{\rm .}\,{\rm of}\,{\rm ages}}}}$$
, and
$$\kappa _{t}^{R} $$
and
$$\gamma _{c}^{R} $$
as zero. Then calculate the fitted values
$$\hat{\eta }_{{x,t}}^{R} $$
and
$$\hat{m}_{{x,t}}^{R} $$
for all x and t.(b) Update
$$\alpha _{x}^{R} $$
for all x.(c) Recalculate
$$\hat{\eta }_{{x,t}}^{R} $$
and
$$\hat{m}_{{x,t}}^{R} $$
for all x and t and then update
$$\kappa _{t}^{R} $$
for all t.(d) Recalculate
$$\hat{\eta }_{{x,t}}^{R} $$
and
$$\hat{m}_{{x,t}}^{R} $$
for all x and t and then update
$$\beta _{x}^{R} $$
for all x.(e) Recalculate
$$\hat{\eta }_{{x,t}}^{R} $$
and
$$\hat{m}_{{x,t}}^{R} $$
for all x and t and then update
$$\gamma _{c}^{R} $$
for all c.(f) Adjust
$$\alpha _{x}^{R} $$
,
$$\beta _{x}^{R} $$
,
$$\kappa _{t}^{R} $$
, and
$$\gamma _{c}^{R} $$
for all x, t, and c to incorporate the first four identifiability constraints.(g) Recalculate
$$\hat{\eta }_{{x,t}}^{R} $$
and
$$\hat{m}_{{x,t}}^{R} $$
for all x and t and then calculate l
R
.(h) Repeat steps (b) to (g) until the increase in l R is less than 10−11.


Table Reference TsayA.2 provides the equations we have deduced for running the updating scheme.
Equations derived for iterative updating scheme under CAE+Cohorts model.

Conditioning on the calculated
 $$\hat{\alpha }_{x}^{R} $$
,
 $$\hat{\beta }_{x}^{R} $$
,
 $$\hat{\kappa }_{t}^{R} $$
, and
 $$\hat{\gamma }_{c}^{R} $$
, the parameters in the book component of the CAE+Cohorts model are estimated by the updating equation and the iterative updating scheme as follows:
(a) Set the initial parameter values of
$$\alpha _{x}^{B} $$
as the average (over time) logit mortality rate of the book population observed at age x minus
$$\hat{\alpha }_{x}^{R} $$
, and
$$\kappa _{t}^{B} $$
as zero. Then calculate the fitted values
$$\hat{\eta }_{{x,t}}^{B} $$
and
$$\hat{m}_{{x,t}}^{B} $$
for all x and t.(b) Update
$$\alpha _{x}^{B} $$
for all x.(c) Recalculate
$$\hat{\eta }_{{x,t}}^{B} $$
and
$$\hat{m}_{{x,t}}^{B} $$
for all x and t and then update
$$\kappa _{t}^{B} $$
for all t.(d) Adjust
$$\alpha _{x}^{B} $$
and
$$\kappa _{t}^{B} $$
for all x and t to incorporate the last identifiability constraint.(e) Recalculate
$$\hat{\eta }_{{x,t}}^{B} $$
and
$$\hat{m}_{{x,t}}^{B} $$
for all x and t and then calculate l
B
.(f) Repeat steps (b) to (e) until the increase in l B is less than 10−11.


Table A.3 gives the BIC values of fitting the M7-M5 and CAE+Cohorts models to the various data sets. In each cell, the left figure is the BIC value for the reference component, and the right figure is the BIC value for the book component. For all the data sets (except the book component of the least deprived areas), the M7-M5 model produces the lowest BIC values, but the differences are rather small. We have also examined the residuals by age, year, and cohort, and overall there are no significant patterns in the residuals. Note that the BIC and the residuals examination provide a useful way to assess how well the models are fitted to the data, but the fitted models do not necessarily produce accurate forecasts. Table A.4 lists the parameter estimates of the different time series processes. As expected, all the drift terms are negative, representing overall mortality improvements. Moreover, all the values of φ 1 are smaller than one in magnitude, which means that the fitted AR(1) processes are weakly stationary.
Bayesian information criterion values of fitting M7-M5 and CAE+Cohorts models to different data sets.

Estimated parameters of various time series processes.