1. INTRODUCTION
Product flexibility has been considered as a crucial characteristic and has gained increased attention due to its vital role in responding faster to future changes, enabling rapid updates in the products, and achieving higher levels of performance in a short time (Rajan et al., Reference Rajan, Van Wie, Campbell, Wood and Otto2005). The fast-changing customer requirements, rapid spreading new technologies, and increasing market competition force the companies to frequently develop new products or upgrade old products with shorter time, lower cost, and higher quality (Jarratt et al., Reference Jarratt, Eckert, Caldwell and Clarkson2011; Rao, Reference Rao2012). However, new product development activities involve uncertainties and changes, which are difficult to predict due to the lack of knowledge in the early design phases. To develop a product with higher flexibility to adapt to future changes is an everlasting pursuit of the designers (Keese et al., Reference Keese, Takawale, Seepersad and Wood2006). Various techniques have been presented in flexible product development, such as product family design, flexible product platform, mass customization, and transformation design (Suh et al., Reference Suh, De Weck and Chang2007; Weaver et al., Reference Weaver, Wood, Crawford and Jensen2010; Li et al., Reference Li, Cheng, Feng and Yang2013; Tseng & Hu, Reference Tseng and Hu2014). In different approaches, product flexibility measurement is a critical procedure in the whole development process.
However, measuring product flexibility is challenging, and few methods exist for addressing such a difficult task (Bischof, Reference Bischof2010). Inspired by failure mode and effects analysis (FMEA; Ben-Daya, Reference Ben-Daya2009), Rajan et al. (Reference Rajan, Van Wie, Campbell, Otto and Wood2003, Reference Rajan, Van Wie, Campbell, Wood and Otto2005) proposed a comprehensive approach known as change mode and effects analysis (CMEA) to handle the product flexibility measurement toward future changes. Generally, change mode and effects analysis takes change potential number (CPN) as an index for flexibility measures, which is determined by the calculation of design flexibility (F), occurrence (O), and readiness (R). Although CMEA provides an in-depth view toward flexibility measurement, it suffers from serious issues. First of all, the relative importance of risk factors including F, O, and R is not taken into consideration. The criteria weights are assumed as the same, which are not true in practical applications. Second, the precise evaluation of the risk factors is unanticipated due to the uncertainty and subjectivity involved in the evaluation process. Most of the evaluation information comes from subjective judgments. Third, the calculation of CPN is sensitive to variations in risk factors evaluation. Different groups of F, O, and R values may produce the same CPN, but the indication may be totally different. How to effectively and objectively evaluate the product change mode becomes a critical issue to resolve (Keese et al., Reference Keese, Seepersad and Wood2009).
Change mode evaluation is actually a multicriteria decision-making (MCDM) problem. The F, O, and R are taken as evaluation criteria, while change modes are considered as evaluation alternatives. Therefore, the CMEA can be transformed into the problem of risk ranking of various change modes considering the three risk factors. Based on such an assumption, this paper proposes a novel CMEA model by combining with the entropy weight method, rough number theory, and grey relational analysis approach. The entropy weight method is put forward to calculate the relative importance of evaluation criteria. Rough number is introduced to aggregate individual weights and judgments, and to resolve the subjectivity and vagueness in the evaluation process. A rough number enhanced grey relational analysis algorithm is presented to evaluate potential change modes. To our knowledge, there is no literature to discuss such decision-making models in CMEA.
The rest of this paper is organized as follows. Section 2 outlines the brief review and background. The enhanced grey relational analysis algorithm is discussed in Section 3. A case study is put forward to evaluate the proposed approach in Section 4. Section 5 presents the conclusion.
2. BRIEF REVIEW AND BACKGROUND
2.1. CMEA
Product flexibility has been defined as the ability to adapt to changes quickly and economically (Rajan et al., Reference Rajan, Van Wie, Campbell, Otto and Wood2003; Keese et al., Reference Keese, Seepersad and Wood2009; Bischof, Reference Bischof2010). However, product flexibility measurement is a difficult task and has put forward an obstacle for flexible product development. The precise form of potential changes is difficult to predict, especially at the early stage of new product development. To resolve this dilemma, CMEA has been proposed by Rajan et al. (Reference Rajan, Van Wie, Campbell, Otto and Wood2003, Reference Rajan, Van Wie, Campbell, Wood and Otto2005) for the purpose of measuring product flexibility toward potential changes and evaluating the cost of changes and their propagation. Analogous to FMEA, a generic table is established in CMEA that contains potential change modes, potential effects of change, design flexibility, potential causes of change, occurrence, readiness, and change potential number.
In CMEA, each of the product potential change modes is evaluated considering three factors: F, O, and R. Change potential number is taken as a metric index to denote the overall flexibility, which is calculated by these three ratings:
 $$\hbox{CPN} = \displaystyle{1 \over N}\mathop \sum \limits_{i = 1}^N \displaystyle{{\lsqb {\lpar {R_i + F_i} \rpar - O_i + 8} \rsqb } \over {27}}\comma\,$$
where F i , O i , and R i correspond to design flexibility, occurrence, and readiness for the ith change mode, respectively; N is the maximum of the number of potential change modes, potential effects of change, or potential causes of change (Rajan et al., Reference Rajan, Van Wie, Campbell, Otto and Wood2003, Reference Rajan, Van Wie, Campbell, Wood and Otto2005). The values of F, O, and R are identified according to their corresponding generic metrics.
The CMEA provides designers not only the CPN value but also the overall flexibility of the product, which includes the readiness of the enterprise, the designers' preparedness for changes and redesigning the product, and the design flexibility for a specific potential change. The most important is an in-depth analysis on particular changes and its effects on the entire product as well as a measure of flexibility of the entire product.
To make traditional CMEA less subjective and more consistent, Keese et al. (Reference Keese, Takawale, Seepersad and Wood2006, Reference Keese, Seepersad and Wood2009) presented an enhanced CMEA to make it more intuitive and repeatable, and applied the enhanced version to consumer products to enable flexibility. In the new model, they suggested a revised scale of design flexibility by converting from “change-to-function ratio” and provided a rubric to calculate change-to-function ratio, which indexes it more intuitively. Because the R value depends on the internal corporate information, which is not readily available, they preferred to omit R from practical case studies and to calculate the CPN by multiplying F and O ratings.
Tilstra et al. (Reference Tilstra, Backlund, Seepersad and Wood2008) further enhanced the evaluation of design flexibility by introducing the concept of percentage readily reusability. The F rating is identified by transforming from the percentage readily reusability. Furthermore, they revised the readiness metric by inverting the original one presented by Rajan et al. (Reference Rajan, Van Wie, Campbell, Wood and Otto2005). In their proposal, the final CPN is calculated by multiplying the F, O, and R ratings for each change mode. Formally, it is more similar to FMEA. The bigger the value of CPN, the less flexibility of the change mode.
Qureshi et al. (Reference Qureshi, Murphy, Kuchinsky, Seepersad, Wood and Jensen2006) put forward an adapted CMEA by using only the “design flexibility” column of the CMEA table. A brainstorm method was introduced to evaluate possible changes that might be made and the effects of these changes to the entire product. A set of formal principles is proposed for flexible product development.
However, traditional CMEA models ignore the relative importance of F, O, and R. They were considered as equally important in the CPN calculation. In contrast, with either the sum or the product, the final CPN calculation relies too much on the precisely evaluated values of F, O, and R. Different groups of F, O, and R values may lead to the same value of final CPN. Nevertheless, the risk of potential changes and effects are not equal in real applications. It fails to reflect the true implication of the change mode and effects.
In general, the evaluation of change mode is a process of MCDM in the in-depth view. In both academic and industrial areas, various decision-making methods were introduced in FMEA to conduct failure modes ranking, such as AHP, MULTIMOORA, TOPSIS, VIKOR, or their combination algorithms (Kutlu & Ekmekçioğlu, Reference Kutlu and Ekmekcioglu2012; Liu et al., Reference Liu, Liu, Liu and Mao2012; Song, Ming, Wu, et al., Reference Song, Ming, Wu and Zhu2013; Liu et al., Reference Liu, Fan, Li and Chen2014). Based on this proposal, the MCDM models were introduced in the risk evaluation of CMEA, both the process of weight determination and the final ranking of the risk priorities.
2.2. Rough number
Due to its powerful ability in dealing with vague and uncertain information, rough set theory has attracted wide attention and has been applied in many areas such as decision support, attribute reduction, rule induction, and feature selection (Pawlak, Reference Pawlak1997; Chai & Liu, Reference Chai and Liu2014; Zheng et al., Reference Zheng, Hu, Zhan, Ma and Qi2014; Zhu, Hu, Qi, Ma, et al., Reference Zhu, Hu, Qi, Gu and Peng2015). As a variant of rough set theory, rough number is first proposed by Zhai et al. (Reference Zhai, Khoo and Zhong2008) and has been used in quality function deployment, customer requirement evaluation, design concept evaluation, and FMEA to manipulate the subjective information among experts' judgments (Zhai et al., Reference Zhai, Khoo and Zhong2009; Song, Ming, Han, et al., Reference Song, Ming, Han and Wu2013, Reference Song, Ming, Wu and Zhu2014; Zhu, Hu, Qi, Gu, et al., Reference Zhu, Hu, Qi, Ma and Peng2015). Generally, a rough number consists of its lower limit, upper limit, and the rough boundary interval.
Let U be the universe, Y is an arbitrary object of U, R is a set of N classes (C 1, C 2, … , C N ) that cover all the objects in U, R = {C 1, C 2, … , C N }, and C 1 < C 2 < · · · < C N .
Given
 $\forall Y$
∈ U, C
i
∈ R, the lower approximation (Apr(C
i
)), upper approximation (
 $\overline {\hbox{Apr}} \lpar {C_i} \rpar $
), and boundary region (Bnd(C
i
)) of C
i
are defined as
 $$\underline {\hbox{Apr}} \lpar {C_i} \rpar = \mathop \cup \lcub {Y \in U/R\lpar Y \rpar \le C_i} \rcub \comma \,$$
 $$\overline {\hbox{Apr}} \lpar {C_i} \rpar = \cup \, \lcub {Y \in U/R\lpar Y \rpar \ge C_i} \rcub \comma \,$$
 $$\eqalign{{\rm Bnd}(C_i ) & = \cup \, \lcub {Y \in U/R\lpar Y \rpar \ne C_i} \rcub \comma\, \cr \quad &= \lcub {Y \in U/R\lpar Y \rpar \gt C_i} \rcub \cup \lcub {Y \in U/R\lpar Y \rpar \lt C_i} \rcub.} $$
Furthermore, the lower limit (Lim(C
i
)), upper limit (
 $\overline {\hbox{Lim}} \lpar {C_i} \rpar $
) as well as the rough number (RN(C
i
)) of C
i
are defined as (Lee et al., Reference Lee, Lee, Seol and Park2012):
 $$\underline {\hbox{Lim}} \lpar {C_i} \rpar = \root {N_L} \of {\mathop {\prod}\nolimits_{i = 1}^{N_L} Y \in \underline {\hbox{Apr}} \lpar {C_i} \rpar }\comma \, $$
 $$\overline {\hbox{Lim}} \lpar {C_i} \rpar = \root {N_U} \of {\mathop \prod \nolimits_{i = 1}^{N_U} Y \in \overline {\hbox{Apr}} \lpar {C_i} \rpar }\comma \,$$
 $$\hbox{RN}\lpar {C_i} \rpar = \lceil\underline {\hbox{Lim}} \lpar {C_i} \rpar \comma \,\overline {\hbox{Lim}} \lpar {C_i} \rpar\rfloor \comma \,$$
where N
L
and N
U
correspond to the number of objects included in Apr(C
i
) and
 $\overline {\hbox{Apr}} \lpar {C_i} \rpar $
, respectively.
Then the rough boundary interval (IRBnd(C i )) is determined as the difference between the upper limit and lower limit, where
 $$\hbox{IRBnd}\lpar {C_i} \rpar = \overline {\hbox{Lim}} \lpar {C_i} \rpar - \underline {\hbox{Lim}} \lpar {C_i} \rpar . $$
The rough boundary interval represents the vagueness of C i , where a smaller one denotes more precision while a larger one means more vagueness. Then the subjective information can be represented by rough numbers.
Suppose
 $\hbox{RN}\lpar {{\rm \alpha}_1} \rpar = \lceil\underline {\hbox{Lim}} \lpar {{\rm \alpha}_1} \rpar \comma \,\; \overline {\hbox{Lim}} \lpar {{\rm \alpha}_1} \rpar\rfloor $
and
 $\hbox{RN}\lpar {{\rm \alpha}_2} \rpar = \lceil\underline {\hbox{Lim}} \lpar {{\rm \alpha}_2} \rpar \comma \,\overline {\hbox{Lim}} \lpar {{\rm \alpha}_2} \rpar\rfloor $
are two rough numbers, μ is a nonzero constant, the arithmetic rules of rough number are defined as (Zhai et al., Reference Zhai, Khoo and Zhong2009)
 $$\matrix{ \matrix{\hbox{RN}\lpar {{\rm \alpha}_1} \rpar + \hbox{RN}\lpar {{\rm \alpha}_2} \rpar \hfill = \lceil\underline {\hbox{Lim}} \lpar {{\rm \alpha}_1} \rpar ,\overline {\hbox{Lim}} \lpar {{\rm \alpha}_1} \rpar \rfloor + \lceil\underline {\hbox{Lim}} \lpar {{\rm \alpha}_2} \rpar ,\overline {\hbox{Lim}} \lpar {{\rm \alpha}_2} \rpar \rfloor, \hfill} \quad \quad \quad \quad \quad \quad \quad \quad \cr = \lceil{\underline {\hbox{Lim}} \lpar {{\rm \alpha}_1} \rpar + \underline {\hbox{Lim}} \lpar {{\rm \alpha}_2} \rpar ,\overline {\hbox{Lim}} \lpar {{\rm \alpha}_1} \rpar + \overline {\hbox{Lim}} \lpar {{\rm \alpha}_2} \rpar \rfloor \semicolon} \cr} $$
 $$\matrix{ \matrix{\hbox{RN}\lpar {{\rm \alpha}_1} \rpar \times {\rm RN}\lpar {{\rm \alpha}_2} \rpar = \lceil\underline {\hbox{Lim}} \lpar {{\rm \alpha}_1} \rpar \comma \,\overline {\hbox{Lim}} \lpar {{\rm \alpha}_1} \rpar\rfloor \times \lceil\underline {\hbox{Lim}} \lpar {{\rm \alpha}_2} \rpar \comma \,\overline {\hbox{Lim}} \lpar {{\rm \alpha}_2} \rpar \rfloor \comma \, \hfill} \cr \quad\quad\quad\quad \quad\quad\quad\quad = {\lceil \underline {\hbox{Lim}} \lpar {{\rm \alpha}_1} \rpar \times \underline {\hbox{Lim}} \lpar {{\rm \alpha}_2} \rpar \comma \,\overline {\hbox{Lim}} \lpar {{\rm \alpha}_1} \rpar \times \overline {\hbox{Lim}} \lpar {{\rm \alpha}_2} \rpar \rfloor \semicolon \,} \cr} $$
 $$\eqalign{ \hbox{RN}\lpar {{\rm \alpha}_1} \rpar \times {\rm \mu} &= \lceil\underline {\hbox{Lim}} \lpar {{\rm \alpha}_1} \rpar \comma \;\overline {\hbox{Lim}} \lpar {{\rm \alpha}_1} \rpar\rfloor \times {\rm \mu} \cr & = \lceil {\rm \mu} \times \underline {\hbox{Lim}} \lpar {{\rm \alpha}_1} \rpar \comma \;{\rm \mu} \times \overline {\hbox{Lim}} \lpar {{\rm \alpha}_1} \rpar \rfloor.} $$
As an objective technique, rough number only depends on the original data set, without any complementary information. In view of its outstanding ability in dealing with subjective information, rough number can be used to combine with evaluation models to enhance the objectivity in decision making.
2.3. Grey relational analysis
Grey relational analysis is an effective evaluation technique that is widely used in MCDM especially under uncertain environments (Deng, Reference Deng1989; Rao, Reference Rao2012). It performs evaluation by measuring the correlation of each alternative to an ideal solution (Lee & Lin, Reference Lee and Lin2011). Normally, grey relational analysis contains the following five steps:
-
Step 1. Collect initial evaluation values and generate a decision matrix. Suppose there are m data sequences and n criteria, which correspond to m evaluation alternatives and n evaluation criteria. A decision matrix is formulated as
(12)where x ij (1 ≤ i ≤ m, 1 ≤ j ≤ n) denotes the evaluation value of the ith data sequence with respect to criterion j. $$D = \left[ {\matrix{ {\; x_{11}\quad \; \; \; x_{12}\quad \; \; \cdots\quad \; \; x_{1n}} \cr \;{x_{21}\quad \; \; \; x_{22}\quad \; \; \cdots\quad \; \; x_{2n\;}} \cr \;\;{\vdots\; \;\;\;\;\;\;\; \; \vdots \; \;\; \;\; \;\;\;\;\ddots\; \;\;\;\;\;\; \vdots\;\; } \cr {x_{m1}\quad \; \; x_{m2}\quad \; \; \cdots\quad \; x_{mn}} \cr}} \right]\comma $$
-
Step 2. Criteria normalization and reference sequence definition.

For the benefit criterion, which belongs to the “larger-the-better”:
 $$r_{ij} = \displaystyle{{x_{ij} - {\min}_i \lcub {x_{ij}} \rcub } \over {{\max}_i \lcub {x_{ij}} \rcub - {\min}_i \lcub {x_{ij}} \rcub }}.$$
For the cost criterion, which belongs to the “smaller-the-better”:
 $$r_{ij} = \displaystyle{{{\max}_i \lcub {x_{ij}} \rcub - x_{ij}} \over {{\max}_i \lcub {x_{ij}} \rcub - {\min}_i \lcub {x_{ij}} \rcub }}. $$
After a normalization operation, all the criteria have been converted to the category of the “larger-the-better.” Then the normalized matrix is developed as
 $$R = \left[\matrix{r_{11} & r_{12} &\cdots & r_{1n\;}\cr r_{21}&r_{22} &\cdots &r_{2n} \cr \vdots &\vdots&\ddots&\vdots\cr r_{m1} & r_{m2} &\cdots & r_{mn}\cr}\right] .$$
Furthermore, the reference sequence is defined as
 $$V_0 = \lcub {r_{01}\comma\, r_{02}\comma {\cdots\,}\comma\, r_{0n}} \rcub \comma $$
where r
0j
is the reference value for criterion j, and r
0j
is identified as its largest normalized value:
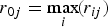 $r_{0j} = \mathop {\max} \limits_i \!\lpar {r_{ij}} \rpar $
.
-
Step 3. Determine the difference value and develop the difference matrix. The difference value between a normalized value and its reference value is determined as
(17)
$$\Delta _{ij} = \vert {r_{0j} - r_{ij}} \vert . $$

Then the difference matrix is constructed as
 $$\Delta = \left[\matrix{\Delta_{11} & \Delta_{12} & \cdots & \Delta_{1n} \cr \Delta_{21} & \Delta_{22} &\cdots & \Delta_{2n} \cr \vdots & \vdots & \ddots & \vdots & \cr \Delta_{m1} &\Delta_{m2} & \cdots &\Delta_{mn} \cr} \right]. $$
-
Step 4. Calculate the grey relational coefficient:
(19)where ξ (0 ≤ ξ ≤ 1) is the distinguishing coefficient that is used to control the range of the grey relational coefficient; usually ξ = 0.5 (Chang & Lin, Reference Chang and Lin1999). Smaller ξ corresponds to higher distinguishability.
$${\rm \gamma} _{ij} = \displaystyle{{\mathop {\min} \nolimits_i \! \mathop {\min} \nolimits_j \!\lcub {\Delta_{ij}} \rcub + \mathop {{\rm \xi} \times \max} \nolimits_{i}\! \mathop {\max} \nolimits_j\! \lcub {\Delta_{ij}} \rcub } \over {\Delta _{ij} + \mathop {{\rm \xi} \times \max} \nolimits_{i} \!\mathop {\max} \nolimits_j \!\lcub {\Delta_{ij}} \rcub }}\comma$$
-
Step 5. Calculate the grey relational degree and rank the alternatives.
(20)where w j is the weight of the jth criterion.
$$\eqalign{{\rm \Gamma} _i &= \mathop \sum \limits_{\,j = 1}^n \lsqb {w_j \times {\rm \gamma}_{ij}} \rsqb \comma \cr \quad\quad\mathop \sum \limits_{\,j = 1}^n w_j &= 1\comma \,}$$


The grey relational degree represents the grade of correlation between the compared sequence and the reference sequence. Therefore, the priority ranking of candidate evaluation alternatives can be obtained based on the grey relational degree. The one with the highest grade of relation is identified as the best solution.
With respect to the outstanding ability of rough number in dealing with subjective information, the excellent performance of the entropy weight method in objective criteria weighting as well as the remarkable competence of grey relational analysis in alternative evaluation, this paper integrates the rough number, entropy weigh method, and grey relational analysis to tackle the issues of CMEA.
3. ROUGH NUMBER ENHANCED GREY RELATIONAL ANALYSIS FOR CMEA
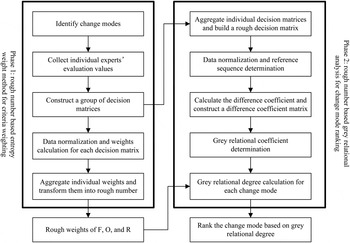
Generally, the rough number enhanced CMEA contains three parts: the identification of potential change modes; the determination of relative importance of criteria F, O, and R; and the risk ranking of potential change modes. Potential changes are identified according to the surveys of: customer needs, performance goals for the company, trends of technical evolution, and market pressure to improve the variety. After determination of the potential change modes and the evaluation values of F, O, and R, a CMEA table is created. Then the evaluation of change modes can be conducted based on the proposed decision-making model, which combines with the entropy weight method, rough number theory, and grey relational analysis. The entropy weight method is adopted to calculate the relative importance of the evaluation criteria F, O, and R. Rough number is introduced to aggregate individual criteria weights and to handle the vagueness among subjective judgments. A rough number enhanced grey relational analysis algorithm is utilized to rank the final priorities for potential change modes. By combining with the rough number based entropy weight method and rough number based grey relational analysis, both the criteria weighting of evaluation criteria and the final alternative ranking of potential change modes are properly addressed. Thus, the proposed CMEA technique based on enhanced grey relational analysis can effectively resolve the deficiencies of traditional CMEA models. The framework of the proposed rough number enhanced CMEA is shown in Figure 1.
Framework of the proposed change mode and effects analysis based on rough number enhanced grey relational analysis.

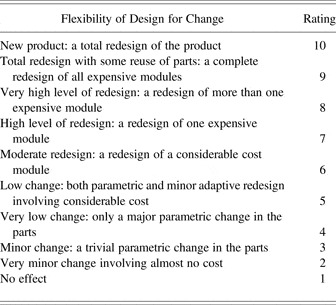
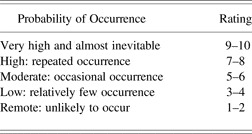
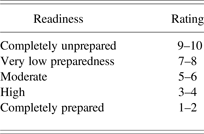
Furthermore, the generic metrics for F, O, and R calculation are listed in Table 1, Table 2, and Table 3, respectively. The generic metric in Table 1 is inverted by the one presented by Rajan et al. (Reference Rajan, Van Wie, Campbell, Wood and Otto2005) so that a smaller number is more desirable. Formally, the revised generic metrics are more similar to FMEA.
A generic metric for design flexibility determination

Note: The data are according to Rajan et al. (Reference Rajan, Van Wie, Campbell, Wood and Otto2005).
A generic metric for occurrence determination

Note: The data are according to Rajan et al. (Reference Rajan, Van Wie, Campbell, Wood and Otto2005).
A generic metric for readiness determination

Note: The data are according to Tilstra et al. (Reference Tilstra, Backlund, Seepersad and Wood2008).
3.1. Rough number based entropy weight method for criteria weighting
Typically, entropy is a metric of uncertainty in the information using probability theory (Shannon & Weaver, Reference Shannon and Weaver2015). It is established on the original data set, without any supplementary information. Therefore, it is an objective evaluation method that can avoid the subjectivity to the most extent. Due to its objective characteristic, the entropy weight method has been widely applied in various decision-making areas to decide criteria weights (Ye, Reference Ye2010; Liu & Zhang, Reference Liu and Zhang2011; Singh & Benyoucef, Reference Singh and Benyoucef2011; Xia & Xu, Reference Xia and Xu2012). It is especially helpful in such a situation where the weighting information is completely unknown. However, the initial evaluation values are given by individual experts under group decision-making environments. To eliminate the subjectivity and vagueness in criteria weighting under such situations, rough number is introduced to aggregate individual criteria weights. The procedure of the rough number based entropy weight method is described as follows:
-
Step 1. Collect individual evaluation values and construct a set of decision matrices. The decision matrix of the eth expert is formed as
(21)where
$$D_e = \left[\matrix{x_{1F}^{e} & x_{1O}^{e} &x_{1R}^{e} \cr x_{2F}^{e} & x_{2O}^{e} & x_{2R}^{e} \cr \vdots & \vdots & \vdots \cr x_{mF}^{e} & x_{mO}^{e} & x_{mR}^{e} \cr} \right]\comma$$
$x_{ij}^{e} \lpar {1 \le i \le m\semicolon \ j = F\comma \,O\comma \,R\semicolon \,1 \le e \le n_e} \rpar $
is the evaluation value of criterion j for the ith change mode given by expert e, m is the number of change modes, and n
e
is the number of experts involved.
-
Step 2. Normalization. Conduct data normalization for all the decision matrices independently. Take D e , for example, for the benefit criterion:
(22)
$$f_{ij}^e = \displaystyle{{x_{ij}^{e} - \mathop {\min} \nolimits_i \!\big\{ {x_{ij}^{e}} \big\} } \over {\mathop {\max} \nolimits_i \!\big\{ {x_{ij}^{e}} \big\} - \mathop {\min} \nolimits_i \!\big\{ {x_{ij}^{e}} \big\} }}. $$


For the cost criterion:
 $$f_{ij}^e = \displaystyle{{\mathop {\max} \nolimits_i \!\big\{ {x_{ij}^{e}} \big\} - x_{ij}^{e}} \over {\mathop {\max} \nolimits_i \! \big\{ {x_{ij}^{e}} \big\} - \mathop {\min} \nolimits_i \! \big\{ {x_{ij}^{e}} \big\} }}. $$
After normalization, a normalized decision matrix
 $F_e = \lsqb {\,f_{ij}^e} \rsqb _{m \times 3} $
is obtained.
-
Step 3. Calculate the entropy of F e :
(24)where
$$E_j^e = - k\mathop \sum \limits_{i = 1}^m p_{ij}^e \hbox{ln}\lpar {\,p_{ij}^e} \rpar \comma$$
$p_{ij}^e = f_{ij}^e /\mathop \sum \nolimits_{i = 1}^m f_{ij}^e $
, k = 1/ln3, supposing
$p_{ij}^e = 0$
,
$p_{ij}^e {\rm ln}\lpar {\,p_{ij}^e} \rpar = 0$
.


The weight for the jth criterion is determined as
 $$w_j^e = \displaystyle{{1 - E_j^e} \over {\sum\nolimits_{\,j = 1}^3 {\lpar {1 - E_j^e} \rpar }}}. $$
-
Step 4. Integrate individual criteria weights and translate them into rough numbers. According to the criteria weights calculated by individual decision matrices, the integrated weight sequence is generated as
(26)
$$\tilde w_j = \Big \{ {w_j^1\comma\, w_j^2\comma \ldots\comma\, w_j^{n_e}} \Big\} \comma\; \quad j = F\comma\, O\comma \,R .$$

Translate the element
 $w_j^e $
in
 $\tilde w_j $
into a rough number
 $\hbox{RN}\lpar {w_j^e} \rpar $
using Eqs. (2)–(7):
 $$\hbox{RN}\,\lpar {w_j^e} \rpar = \lceil w_j^{e{\rm L}}\comma \;w_j^{e{\rm U}} \rfloor \comma $$
where
 $w_j^{e{\rm L}} $
,
 $w_j^{e{\rm U}} $
correspond to the lower, and upper limit of
 $\hbox{RN}\lpar {w_j^e} \rpar $
, respectively.
Then the rough sequence
 $\hbox{RN}\lpar {\tilde w_j} \rpar $
is denoted as
 $$\hbox{RN}\lpar {\tilde w_j} \rpar = \Big\{{\Big\lceil w_j^{1{\rm L}}\comma \;w_j^{1{\rm U}}\Big\rfloor\comma \Big\lceil w_j^{2{\rm L}}\comma \;w_j^{2{\rm U}}\Big\rfloor\comma \;. \;. \;. \;\comma \Big\lceil w_j^{n_e {\rm L}}\comma \;w_j^{n_e {\rm U}}}\Big\rfloor\Big\}. $$
The rough number RN(w j ) is further generated based on rough arithmetic Eqs. (9)–(11):
 $$\hbox{RN}\lpar {w_j} \rpar = \lceil w_j^{\rm L}\comma \,w_j^{\rm U}\rfloor\comma $$
 $$w_j^{\rm L} = \root {n_{\rm e}} \of {\mathop {\prod} \limits_{i = 1}^{n_{\rm e}} w_j^{e{\rm L}}}\comma $$
 $$w_j^{\rm U} = \root {n_{\rm e}} \of {\mathop {\prod} \limits_{i = 1}^{n_{\rm e}} w_j^{e{\rm U}}}\comma $$
where
 $w_j^{\rm L} $
and
 $w_j^{\rm U} $
are the lower and upper limit of RN(w
j
), respectively.
Consequently, the rough weight w is calculated as
 $$w = \Big\{ \Big\lceil{w_F^{\rm L}\comma\ w_F^{\rm U}\Big\rfloor\comma\, \Big\lceil w_O^{\rm L}\comma\ w_O^{\rm U}\Big\rfloor\comma \Big\lceil w_R^{\rm L}\comma\ w_R^{\rm U}\Big\rfloor} \Big\}\comma $$
 $$w^{\prime} = w/\hbox{max}\big\{ {w_j^{\rm U}} \big\}\comma $$
where w′ is the normalization form.
Finally, the criteria weights in rough number forms are obtained.
3.2. Rough number enhanced grey relational analysis for change mode ranking
After determination of the relative importance of evaluation criteria by rough number based entropy weight method, the rough number enhanced grey relational analysis is carried out as follows:
-
Step 1. Integrate the decision matrices and change them into a rough decision matrix. The rough decision matrix is formed as
(34)where
$$\hat D = \left[ {\matrix{\lceil {x_{1F}^{\rm L}\comma \;x_{1F}^{\rm U}}\rfloor & \lceil{x_{1O}^{\rm L}\comma \;x_{1O}^{\rm U}}\rfloor & {\; \lceil x_{1R}^{\rm L}\comma \;x_{1R}^{\rm U}\rfloor} \cr \lceil {x_{2F}^{\rm L}\comma \;x_{2F}^{\rm U}}\rfloor & \lceil {x_{2O}^{\rm L}\comma \;x_{2O}^{\rm U}}\rfloor & \lceil{x_{2R}^{\rm L}\comma \;x_{2R}^{\rm U}}\rfloor \cr \vdots & \vdots & \vdots \cr \lceil{x_{mF}^{\rm L}\comma \;x_{mF}^{\rm U}}\rfloor & \lceil{x_{mO}^{\rm L}\comma \;x_{mO}^{\rm U}}\rfloor & \lceil{x_{mR}^{\rm L}\comma \;x_{mR}^{\rm U}}\rfloor \cr}} \right]\comma $$
$\lceil x_{ij}^{\rm L}\comma \, x_{ij}^{\rm U}\rfloor $
represents a rough number, and
$x_{ij}^{\rm L} $
and
$x_{ij}^{\rm U} $
are the lower and upper limits, respectively.
-
Step 2. Normalization and reference sequence determination.
For the benefit criterion,


 $$r_{ij}^{\rm L} = \displaystyle{{x_{ij}^{\rm L} - \mathop {\min} \nolimits_i \!\big\{ {x_{ij}^{\rm L}} \big\} } \over {\mathop {\max} \nolimits_i \!\big\{ {x_{ij}^{\rm U}} \big\} - \mathop {\min} \nolimits_i \!\big\{ {x_{ij}^{\rm L}} \big\} }}\comma$$
 $$r_{ij}^{\rm U} = \displaystyle{{x_{ij}^{\rm U} - \mathop {\min} \nolimits_i \!\big\{ {x_{ij}^{\rm L}} \big\} } \over {\mathop {\max} \nolimits_i \!\big\{ {x_{ij}^{\rm U}} \big\} - \mathop {\min} \nolimits_i \!\big\{ {x_{ij}^{\rm L}} \big\} }}. $$
For the cost criterion,
 $$r_{ij}^{\rm L} = \displaystyle{{\mathop {\max} \nolimits_i \!\big\{ {x_{ij}^{\rm U}} \big\} - x_{ij}^{\rm U}} \over {\mathop {\max} \nolimits_i \!\big\{ {x_{ij}^{\rm U}} \big\} - \mathop {\min} \nolimits_i \!\big\{ {x_{ij}^{\rm L}} \big\} }}\comma$$
 $$r_{ij}^{\rm U} = \displaystyle{{\mathop {\max} \nolimits_i \!\big\{ {x_{ij}^{\rm U}} \big\} - x_{ij}^{\rm L}} \over {\mathop {\max} \nolimits_i \!\big\{ {x_{ij}^{\rm U}} \big\} - \mathop {\min} \nolimits_i \!\big\{ {x_{ij}^{\rm L}} \big\} }}. $$
Then a normalized decision matrix R = [r ij ] m×3 is generated. Furthermore, the reference sequence is determined as
 $$V_0 = \big\{ {r_{01}\comma\; r_{02}\comma\; r_{03}} \big\}\comma $$
where
 $r_{0j} = \mathop {\max} \nolimits_i \lpar {r_{ij}^{\rm U}} \rpar $
.
-
Step 3. Calculate the difference coefficient and construct a difference coefficient matrix. As all the criteria have been transformed into the category of the “larger-the-better” after normalization, the difference coefficient value is determined as the distance between the rough number and its reference value, which is shown as
(40)
$$\Delta _{ij}^{\rm L} = r_{0j} - r_{ij}^{\rm U} = \mathop {\max} \nolimits_i \!\big\{ {r_{ij}^{\rm U}} \big\} - r_{ij}^{\rm U}\comma $$
(41)
$$\Delta _{ij}^U = r_{0j} - r_{ij}^L = \mathop {\max} \nolimits_i \lcub {r_{ij}^U} \rcub - r_{ij}^L .$$


Then the difference coefficient matrix is built as
 $$\Delta = \left[ {\matrix{ \lceil{\Delta _{11}^{\rm L} \comma \;\Delta _{11}^{\rm U} }\rfloor & \lceil{\Delta _{12}^{\rm L} \comma \; \Delta _{12}^{\rm U} }\rfloor & \lceil{\Delta _{13}^{\rm L} \comma \;\Delta _{13}^{\rm U} }\rfloor \cr \lceil{\Delta _{21}^{\rm L} \comma \;\Delta _{21}^{\rm U} }\rfloor & \lceil{\Delta _{22}^{\rm L} \comma \;\Delta _{22}^{\rm U} }\rfloor & \lceil{\Delta _{23}^{\rm L} \comma \; \Delta _{23}^{\rm U} }\rfloor \cr \vdots & \vdots & \vdots \cr \lceil{\Delta _{m1}^{\rm L} \comma \;\Delta _{m1}^{\rm U} }\rfloor & \lceil{\Delta _{m2}^{\rm L} \comma \;\Delta _{m2}^{\rm U} }\rfloor & \lceil{\Delta _{m3}^{\rm L} \comma \;\Delta _{m3}^{\rm U} }\rfloor \cr } } \right]. $$
-
Step 4. Calculate the grey relational coefficient
$\lceil{\rm \gamma} _{ij}^{\rm L}\comma \, {\rm\gamma} _{ij}^{\rm U}\rfloor $
:
(43)
$${\rm \gamma} _{ij}^{\rm L} = \displaystyle{{\mathop {\min} \nolimits_i \!\mathop {\min} \nolimits_j \!\big\{ {\Delta_{ij}^{\rm L}} \big\} + \mathop {{\rm \xi} \times \mathop{\max}\nolimits_i} \!\mathop {\max} \nolimits_j \!\big\{ {\Delta_{ij}^{\rm U}} \big\} } \over {\Delta _{ij}^{\rm U} + \mathop {{\rm \xi} \times \mathop{\max}\nolimits_i} \mathop {\max} \nolimits_j \!\big\{ {\Delta_{ij}^{\rm U}} \big\} }}\comma $$
(44)
$${\rm \gamma} _{ij}^{\rm U} = \displaystyle{{\mathop {\min} \nolimits_i \!\mathop {\min} \nolimits_j \!\big\{ {\Delta_{ij}^{\rm L}} \big\} + \mathop {{\rm \xi} \times \mathop{\max}\nolimits_i} \!\mathop {\max} \nolimits_j \!\big\{ {\Delta_{ij}^{\rm U}} \big\} } \over {\Delta _{ij}^{\rm L} + \mathop {{\rm \xi} \times \mathop{\max}\nolimits_i} \!\mathop {\max} \nolimits_j \!\big\{ {\Delta_{ij}^{\rm U}} \big\} }}. $$
-
Step 5. Calculate the grey relational degree
$\lceil {\rm \Gamma} _i^{\rm L}\comma \, {\rm \Gamma} _i^{\rm U} \rfloor$
:
(45)
$${\rm \Gamma} _i^{\rm L} = \mathop \sum \limits_{\,j = 1}^3 \lsqb {w_i^{\rm L} \times {\rm \gamma}_{ij}^{\rm L}} \rsqb \comma$$
(46)where
$${\rm \Gamma} _i^{\rm U} = \mathop \sum \limits_{j = 1}^3 \lsqb {w_i^{\rm U} \times {\rm \gamma}_{ij}^{\rm U}} \rsqb\comma $$
$\lceil w_j^{\rm L}\comma \, w_j^{\rm U}\rfloor $
is the weight of the jth criterion calculated by rough entropy weight method in Section 3.1.
-
Step 6. Rank the candidate change modes based on the grey relational degree
$\lceil {\rm \Gamma} _i^{\rm L}\comma \, {\rm \Gamma} _i^{\rm U}\rfloor $
. A change mode with a smaller grey relational degree is thought to be closer to the ideal solution. Given two rough numbers RN(α1) and RN(α2), suppose M(α1) and M(α2) are the middle values of RN (α1) and RN(α2), the ranking rules of the rough number are defined as (Zhai et al., Reference Zhai, Khoo and Zhong2008)
-
a. If Lim(α1) > Lim(α2) and
$\overline {\hbox{Lim}} \lpar {{\rm \alpha}_1} \rpar $
≥
$\overline {\hbox{Lim}} \lpar {{\rm \alpha}_2} \rpar $
, or Lim(α1) ≥ Lim(α2) and
$\overline {\hbox{Lim}} \lpar {{\rm \alpha}_1} \rpar$
>
$\overline {\hbox{Lim}} \lpar {{\rm \alpha}_2} \rpar $
, then RN(α1) > RN(α2); -
b. If Lim(α1) = Lim(α2) and
$\overline {\hbox{Lim}} \lpar {{\rm \alpha}_1} \rpar$
=
$\overline {\hbox{Lim}} \lpar {{\rm \alpha}_2} \rpar $
, then RN(α1) = RN(α2); -
c. If Lim(α2) > Lim(α1) and
$\overline {\hbox{Lim}} \lpar {{\rm \alpha}_2} \rpar$
<
$\overline {\hbox{Lim}} \lpar {{\rm \alpha}_1} \rpar $
, or Lim(α1) > Lim(α2) and
$\overline {\hbox{Lim}} \lpar {{\rm \alpha}_1} \rpar$
<
$\overline {\hbox{Lim}} \lpar {{\rm \alpha}_2} \rpar $
: if M(α1) ≤ M(α2), then RN(α1) < RN(α2); if M(α1) > M(α2), then RN(α1) > RN(α2);
-


Based on the rough number enhanced grey relational analysis, the risk ranking of candidate change modes is accomplished.
4. CASE STUDY
In this section, the proposed rough number enhanced grey relational analysis approach is used in an automatic digital microscope development to identify and evaluate potential changes for future product evolutions. Generally, an automatic digital microscope is a critical piece of equipment that has been widely applied in many areas, such as pathological diagnosis, drug development, biological research, and environmental monitoring (Daims & Wagner, Reference Daims and Wagner2007; Jara-Lazaro et al., Reference Jara-Lazaro, Thamboo, Teh and Tan2010; Zimic et al., Reference Zimic, Velazco, Comina, Coronel, Fuentes, Luna, Sheen, Gilman and Moore2010; Dykstra & Reuss, Reference Dykstra and Reuss2011). Meanwhile, the automatic digital microscope has fast changes due to various customer requirements and universal applications. To achieve the customer demands of high performance of throughput, resolution, and accuracy for microscopic imaging, the automatic digital microscope should have the ability of automatic loading and slice scanning, autofocus, and other highly automated functions. Therefore, the evaluation of change modes is a crucial issue in the automatic digital microscope development as its instructive signification for future changes and technical evolutions.
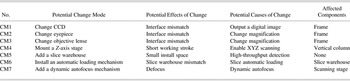
Because of the important role of change mode evaluation in the automatic digital microscope development, several major potential change modes (CM) are identified by experts surveys as: change charge-coupled device (CM1), change eyepiece (CM2), change objective lens (CM3), mount a Z-axis stage (CM4), add a slice warehouse (CM5), provide an automatic loading mechanism (CM6), and add a dynamic autofocus mechanism (CM7). The CMEA table for the automatic digital microscope is listed in Table 4, which contains the potential change modes, potential effects of change, affected components, and potential causes of change.
CMEA for the automatic digital microscope

After the identification of potential change modes, the evaluation process can be divided into two steps: criteria weighting determined by the rough number based entropy weight method and change mode ranking calculated by rough number enhanced grey relational analysis. Five experts were invited to give their judgments in the evaluation of potential change modes. According to the rating rules, all three criteria are cost ones. Therefore, the change mode evaluation is to identify the worst change mode from the seven candidates for potential adaptions considering the evaluation criteria as F, O, and R.
4.1. Criteria weighting by rough number based entropy weight method
For change mode evaluation of the automatic digital microscope, the determination of relative importance of criteria F, O, and R is described as
-
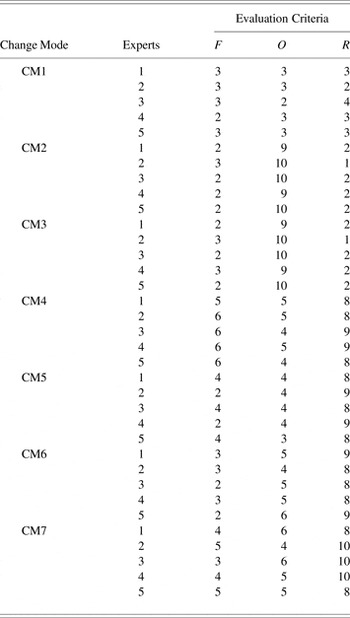
Step 1. Collect individual preferences of each expert and generate individual decision matrices. The risk ratings for potential change modes given by each expert are shown in Table 5. According to the evaluation values in Table 5, the individual decision matrices of the five experts are formed as
$$\eqalign{& D_1 = \left[ {\matrix{ {3\; \; \; 3\; \; \; 3\;} \cr {2\; \; \; 9\; \; \; 2} \cr {2\; \; \; 9\; \; \; 2} \cr {5\; \; \; 5\; \; \; 8} \cr {4\; \; \; 4\; \; \; 8} \cr {3\; \; \; 5\; \; \; 9} \cr {4\; \; \; 6\; \; \; 8} \cr}} \right]\comma \,D_2 = \left[ {\matrix{ {3\; \; \; \; 3\; \; \; \; 2\;} \cr {3\; \; \; 10\; \; \; 1} \cr {3\; \; \; 10\; \; \; 1} \cr {6\; \; \; \; 5\; \; \; \; 8} \cr {2\; \; \; \; 4\; \; \; \; 9} \cr {3\; \; \; \; 4\; \; \; \; 8} \cr {5\; \; \; \; 4\; \; \; 10} \cr}} \right]\comma \,D_3 = \left[ {\matrix{ {3\; \; \; \; 2\; \; \; \; 4\;} \cr {2\; \; \; 10\; \; \; 2\;} \cr {2\; \; \; 10\; \; \; 2\;} \cr {6\; \; \; \; 4\; \; \; \; 9\;} \cr {4\; \; \; \; 4\; \; \; \; 8\;} \cr {2\; \; \; \; 5\; \; \; \; 8\;} \cr {3\; \; \; \; 6\; \; \; 10} \cr}} \right]\comma \, \cr & D_4 = \left[ {\matrix{ {2\; \; \; 3\; \; \; \; 3\;} \cr {2\; \; \; 9\; \; \; \; 2\;} \cr {3\; \; \; 9\; \; \; \; 2\;} \cr {6\; \; \; 5\; \; \; \; 9\;} \cr {2\; \; \; 4\; \; \; \; 9\;} \cr {3\; \; \; 5\; \; \; \; 8\;} \cr {4\; \; \; 5\; \; \; 10} \cr}} \right]\comma \,D_5 = \left[ {\matrix{ {3\; \; \; \; 3\; \; \; \; 3\;} \cr {2\; \; \; 10\; \; \; 2} \cr {2\; \; \; 10\; \; \; 2} \cr {6\; \; \; \; 4\; \; \; \; 8} \cr {4\; \; \; \; 3\; \; \; \; 8} \cr {2\; \; \; \; 6\; \; \; \; 9} \cr {5\; \; \; \; 5\; \; \; \; 8} \cr}} \right].} $$
Table 5.Risk ratings for potential change modes
-
Step 2. Normalization. As all the criteria belong to the cost category, the individual normalized decision matrices are generated according to Eq. (23):
$$\eqalign{& F_1 = \left[ {\matrix{ {0.667\; \; \; \; \; 1\; \; \; \; \; 0.857} \cr {1\; \; \; \; \; \; \; \; \; \; 0\; \; \; \; \; \; \; \; \; \; 1\; \;} \cr {1\; \; \; \; \; \; \; \; \; \; 0\; \; \; \; \; \; \; \; \; \; 1\; \;} \cr {\; \; \; 0\; \; \; \; 0.667\; \; \; \; 0.143} \cr {\; \; 0.333\; \; \; \; \; \; \; 0.8333\; \; \; \; \; \; \; 0.143} \cr {\; \; \; 0.667\; \; \; \; \; \; 0.667\; \; \; \; \; \; 0\; \; \; \;} \cr {0.333\; \; \; 0.5\; \; \; 0.143} \cr}} \right]\comma \,. . . \comma \, \cr & F_5 = \left[ {\matrix{ {0.75\; \; \; \; \; 0\; \; \; \; \; 0.857} \cr {1\; \; \; \; \; \; \; \; \; \; 0\; \; \; \; \; \; \; \; \; \; 1\; \;} \cr {1\; \; \; \; \; \; \; \; \; \; 0\; \; \; \; \; \; \; \; \; \; 1\; \;} \cr {\; \; \; 0\; \; \; \; 0.857\; \; \; \; 0.143} \cr {\; \; 0.5\; \; \; \; \; \; \; 1\; \; \; \; \; \; \; 0.143} \cr {\; \; \; 1\; \; \; \; \; \; 0.571\; \; \; \; \; \; 0\; \; \; \;} \cr {0.25\; \; \; 0.714\; \; \; 0.143} \cr}} \right].} $$
-
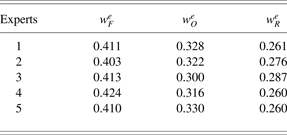
Step 3. On the basis of the individual normalized decision matrices, the individual weights of the criteria are determined as listed in Table 6.
Table 6.The individual weights,
$w_j^e $
, of F, O, and R -
Step 4. Integrate individual criteria weights and transform them into rough numbers. Based on the individual criteria weights, the integrated weight sequence is formed as
$$\eqalign{& {\tilde {w }}= \left\{ 0.411,0.403,0.413,0.424,0.410;0.328,0.322,0.300,0.316, \right. \cr & \left. \quad \quad\quad\quad\quad\quad \quad\quad\quad \quad\quad 0.330; 0.261,0.276,0.287,0.260,0.260 \right\}. }$$


Convert the elements in
 $\tilde w$
into rough numbers and finally the integrated weight sequence is translated into a rough number according to Eqs. (27)–(33):
 $$w = \big\{ {w_1\comma \,w_2\comma \,w_3} \big\} = \big\{ {\lceil 0.408\comma\,0.417\rfloor\comma\,\lceil 0.311\comma\,0.326\rfloor\comma\,\lceil0.263\comma\,0.276\rfloor} \big\}. $$
Then its normalization form w′ is obtained:
 $$w^{\prime} = \big\{ {\lceil0.978\comma\,1\rfloor\comma \,\lceil0.746,\,0.782\rfloor\comma \,\lceil0.631\comma \,0.662\rfloor} \big\}. $$
4.2. Change mode ranking by rough number enhanced grey relational analysis
When the criteria weights are determined, the rough number enhanced grey relational analysis is presented to carry out the final change modes priority ranking.
-
Step 1. Integrate individual decision matrices and transform them into an integrated decision matrix. According to the individual decision matrices in Section 4.1, the integrated decision matrix is constructed as follows:
$$\tilde D=\left[ {\matrix{ {3\comma3\comma3\comma2\comma3} & {3\comma3\comma2\comma3\comma3} & {3\comma2\comma4\comma3\comma3} \cr {2\comma3\comma2\comma2\comma2} & {9\comma10\comma10\comma9\comma10} & {2\comma1\comma2\comma2\comma2} \cr {2\comma3\comma2\comma3\comma2} & {9\comma10\comma10\comma9\comma10} & {2\comma1\comma2\comma2\comma2} \cr {5\comma6\comma6\comma6\comma6} & {5\comma5\comma4\comma5\comma4\; } & {8\comma8\comma9\comma9\comma8} \cr {4\comma2\comma4\comma2\comma4} & {4\comma4\comma4\comma4\comma3\; \; } & {8\comma9\comma8\comma9\comma8} \cr {3\comma3\comma2\comma3\comma2} & {5\comma4\comma5\comma5\comma6} & {9\comma8\comma8\comma8\comma9} \cr {4\comma5\comma3\comma4\comma5} & {6\comma4\comma6\comma5\comma5} & {8\comma10\comma10\comma10\comma8} \cr } } \right].$$

Based on the rough number arithmetic operation, the rough decision matrix is established corresponding to the integrated decision matrix.
 $$\hat D = \left[ {\matrix{ \lceil{2.59\comma\;2.95}\rfloor & \lceil{2.59\comma\;2.95} \rfloor & \lceil { 2.59\comma\;3.30} \rfloor \cr \lceil {2.03\comma\;2.31} \rfloor & \lceil {9.35\comma\;9.83} \rfloor & \lceil {1.56\comma\;1.95} \rfloor \cr \lceil {2.13\comma\;2.59} \rfloor & \lceil {9.35\comma\;9.83} \rfloor & \lceil {1.56\comma\;1.95} \rfloor \cr \lceil {5.62\comma\;5.96} \rfloor & \lceil {4.33\comma\;4.82} \rfloor & \lceil {8.15\comma\;8.63} \rfloor \cr \lceil {2.57\comma\;3.58} \rfloor & \lceil {3.61\comma\;3.95} \rfloor & \lceil {8.15\comma\;8.63} \rfloor \cr \lceil {2.31\comma\;2.81} \rfloor & \lceil {4.62\comma\;5.32} \rfloor & \lceil {8.15\comma\;8.63} \rfloor \cr \lceil {3.68\comma\;4.60} \rfloor & \lceil {4.69\comma\;5.61} \rfloor & \lceil {8.67\comma\;9.65}\rfloor \cr}} \right].$$
-
Step 2. Normalization of the rough decision matrix and identification of the reference sequence. As all the evaluation criteria are cost ones, the normalized rough decision matrix is generated according to Eqs. (37)–(38):
$$\tilde D = \left[ {\matrix{ {\lceil0.766\comma \,0.858\rfloor} & {\lceil 0.950\comma \,1\rfloor} & {\lceil0.785\comma \,0.873\rfloor} \cr {\lceil0.929\comma \,1\rfloor} & {\lceil0\comma \,0.066\rfloor} & {\lceil0.952\comma \,1\rfloor} \cr {\lceil0.858\comma \,0.975\rfloor} & {\lceil0\comma \,0.066\rfloor} & {\lceil\; 0.952\comma \,1\rfloor} \cr {\lceil0\comma \,0.087\rfloor} & {\lceil0.692\comma \,0.760\rfloor} & {\lceil0.126\comma \,0.185\rfloor} \cr {\lceil0.606\comma \,0.863\rfloor} & {\lceil0.812\comma \,0.859\rfloor} & {\lceil0.126\comma \,0.185\rfloor} \cr {\lceil0.802\comma \,0.929\rfloor} & {\lceil0.623\comma \,0.720\rfloor} & {\lceil0.126\comma \,0.185\rfloor} \cr {\lceil0.346\comma \,0.580\rfloor} & {\lceil0.583\comma \,0.710\rfloor} & {\lceil0\comma \,0.121\rfloor} \cr}} \right].$$

Then the reference sequence is determined as
 $$V_0 = \left\{ {1\comma\; 1\comma\; 1} \right\}.$$
-
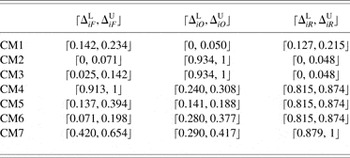
Step 3. Calculate difference coefficients, which are shown in Table 7.
-
Step 4. Calculate the grey relational coefficient
$\lceil{\rm\gamma} _{ij}^{\rm L}\comma \, {\rm\gamma} _{ij}^{\rm U} \rfloor$
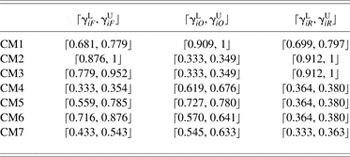
, which are listed in Table 8. -
Step 5. Calculate the grey relational degree
$\lceil{\rm \Gamma} _i^{\rm L}\comma \, {\rm \Gamma} _i^{\rm U}\rfloor $
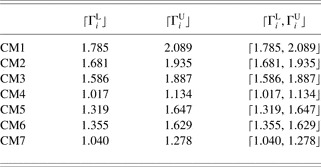
, which are shown in Table 9. -
Step 6. Rank the candidate change modes based on the grey relational degree.


The difference coefficient
 $\lceil\Delta _{ij}^{\rm L}\comma \, \Delta _{ij}^{\rm U} \rfloor$

The grey relational coefficient
 $\lceil{\rm \gamma} _{ij}^{\rm L}\comma \, {\rm \gamma} _{ij}^{\rm U} \rfloor$

The grey relational degree
 $\lceil{\rm \Gamma} _i^{\rm L}\comma \, {\rm \Gamma} _i^{\rm U} \rfloor$

According to the interval values of the grey relational degree and the arithmetic rules of the rough number, the final ranking is arranged as CM4 > CM7 > CM6 > CM5 > CM3 > CM2 > CM1. The change mode with the smallest grey relational degree is the best one, while the one with the biggest value is the worst one. Obviously, CM1 is the best, while CM4 is the worst, among all the change modes. In other words, CM4 has the worst flexibility toward potential changes, while CM1 has the best flexibility. The worse the flexibility of the change mode indicates that more attention should be paid to strengthen the flexibility, and the potential changes may have worse influence on the adaption and redesign of the product.
4.3. Comparison and discussion
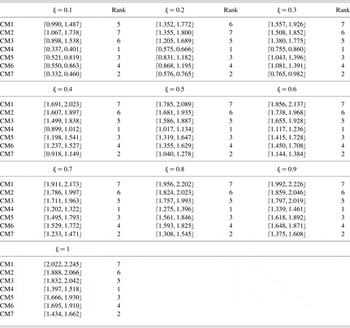
To investigate the influence of the distinguishing coefficient on candidate change modes ranking, sensitivity analysis is conducted, which is shown in Table 10.
Sensitivity analysis of the distinguishing coefficient on change mode ranking

From Table 10, it can be concluded that all the change modes share the same ranking at any values of ξ except ξ = 0.1 and ξ = 0.2. CM4, CM5, CM6, and CM7 rank the same order at any situations, while CM1, CM2, and CM3 vary at ξ = 0.1 and ξ = 0.2. That means CM4, CM5, CM6, and CM7 are independent of the selection of distinguishing coefficient. CM4 outperforms other change modes in grey relational degree at any situations, which corresponds to the worst flexibility.
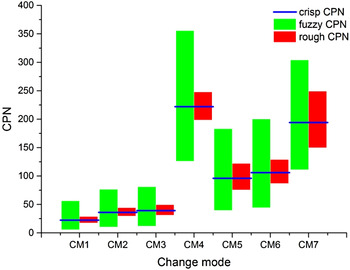
To evaluate the effectiveness of the proposed grey relational analysis based CMEA methodology, traditional CPN based CMEA approaches are carried out for comparison. CPN is taken as an index for product flexibility. The initial evaluation data are based on the risk ratings in Table 5. The final crisp, fuzzy, and rough CPN are shown in Figure 2.
Change potential number in the crisp, fuzzy, and rough method.

From Figure 2, the final alternative ranking of change modes is arranged as CM4 > CM7 > CM6 > CM5 > CM3 > CM2 > CM1. The ranking order is identical as the grey relational analysis based approach. However, the crisp CPN, fuzzy CPN, and rough CPN based CMEA ignore the weights of the evaluation criteria. It is established on the assumption that all the criteria share the same importance.
To evaluate the performance of the proposed decision-making method, traditional crisp and fuzzy decision-making methods are taken for comparison. Correspondingly, the evaluation procedure is divided into two phases: comparison of criteria weighting method and comparison of alternative ranking technique.
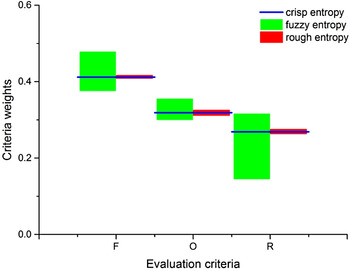
In criteria weighting, the traditional crisp entropy weight method (crisp entropy), the fuzzy entropy weight method (fuzzy entropy), and the proposed rough entropy method (rough entropy) are conducted for comparison. All the weights take the original form rather than the normalized one. The relative importance of the evaluation criteria is shown in Figure 3.
Criteria weights in the crisp, fuzzy, and rough entropy weight method.

From Figure 3, it can be concluded that the fuzzy entropy weight method and the rough entropy weight method illustrate the relative importance in interval numbers while the traditional crisp entropy weight method describes the weights in a crisp number. The interval boundary of the fuzzy number is larger than the rough number. The difference interval boundary reflects different manipulation mechanisms provided by fuzzy numbers and rough numbers. The fuzzy number introduces a membership function, and the interval of a fuzzy number is fixed after the determination of the membership function. Nevertheless, the selection of membership function also involves subjectivity. The rough number uses a flexible interval boundary, which is completely determined by the original data set, without any subjectivity involved. The interval type of value denotes the uncertainty of the numbers, where a larger one means more vagueness and a smaller one denotes more precision. The crisp weight fails to reveal the internal vagueness of the data set. The interval values of criteria weights represent the subjectivity among individual values given by each expert. All the crisp weights are within the category of the corresponding rough interval and the fuzzy number.
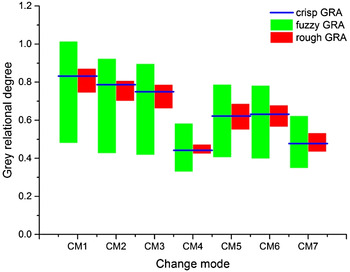
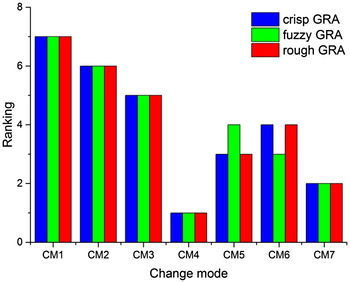
In alternative ranking, traditional crisp grey relational analysis (GRA) combining with crisp weights (crisp GRA), fuzzy grey relational analysis integrating with fuzzy weights (fuzzy GRA), and the proposed rough grey relational analysis combing with rough weights (rough GRA) are carried out for comparison. All the criteria weights in crisp, fuzzy, and rough forms are based on the data in Figure 3. The final grey relational degrees calculated at ξ = 0.5 are illustrated in Figure 4 and the final risk rankings are shown in Figure 5.
Grey relational degree in crisp, fuzzy, and rough grey relational analysis.

Change mode ranks in crisp, fuzzy, and rough grey relational analysis.

From Figure 4, all the crisp numbers fall into the category of the rough numbers and fuzzy numbers. The interval boundary of the fuzzy number is bigger than the rough number. It indicates more vagueness due to the subjectivity in the membership function selection. According to Figure 5, the final change mode ranking order is CM4 > CM7 > CM5 > CM6 > CM3 > CM2 > CM1 in the crisp and rough number based grey relational analysis, while CM4 > CM7 > CM6 > CM5 > CM3 > CM2 > CM in the fuzzy grey relational analysis. Actually, the priority difference between CM5 and CM6 is subtle.
Furthermore, the rough number enhanced entropy weight method and the grey relational analysis algorithm can not only deal with the problem of criteria weighting but also tackle the issue of risk ranking. It only depends on the original evaluation values, without any auxiliary information. Rough number is an effective tool to aggregate crisp evaluation values and to convert them into interval values. Moreover, it uses a flexible interval boundary instead of a fixed predefined one. A smaller interval boundary indicates a more precision while a larger one represents more vagueness. Comparing with crisp and fuzzy techniques, the rough number enhanced decision-making method calculates the relative importance only based on the original evaluation values. It not only affords a novel way to aggregate individual weights and judgments but also provides the ability of reflecting the vagueness without any predetermination information (i.e., the membership function selection in fuzzy methods) in group decision-making environments. Therefore, the rough number enhanced grey relational analysis can effectively reflect the subjectivity in change mode evaluation and strengthen the objectivity of CMEA.
5. CONCLUSION
To enhance the process of CMEA in product flexibility measurement, this paper proposes a rough number based grey relational analysis method to handle the final risk ranking of potential change modes. By combining with the rough number based entropy weight method and the rough number based grey relational analysis approach, the issue of CMEA is transformed into a MCDM problem. Rough number is introduced to aggregate individual weights and priorities, and to manipulate the subjectivity and vagueness in the decision-making process. Entropy weight method and rough number are integrated to calculate the relative importance of evaluation criteria F, O, and R. A rough number enhanced grey relational analysis algorithm is presented to conduct final change mode ranking. By combining with the rough entropy weight method and rough grey relational analysis, the whole processes of criteria weighting and final alternative ranking are properly manipulated. With the help of the rough number, the subjectivity in CMEA is well addressed.
The proposed grey relational analysis based CMEA approach can be generalized into many different models, such as TOPSIS and VIKOR. In the future, we will pay more attention to product flexibility measurement under complex uncertain environments. Design techniques for flexible product development are also the focus of our future research. The product flexibility measurement approaches should be combined with flexibility guidelines to assist flexible product development and future product evolutions. The industrial applications of flexible product development is also an important area that deserves more attention.
ACKNOWLEDGMENTS
This research is supported by the National Natural Science Foundation of China (No. 51475288, 51675329, and 51605302), the Special Program for Innovation Method of Ministry of Science and Technology of China (No. 2015IM010100), the National Key Scientific Instruments and Equipment Development Program of China (No. 2013YQ03065105 and 2016YFF0101602), and the Shanghai Committee of Science and Technology (No. 15142200800, 16441906000, and 16XD1425000).
Guo-Niu Zhu is a PhD candidate in the State Key Laboratory of Mechanical System and Vibration, School of Mechanical Engineering, Shanghai Jiao Tong University. He has participated in two research projects funded by the National Natural Science Foundation of China. His research interest lies in artificial intelligence in engineering design, especially in the domain of biologically inspired design.
Jie Hu is a Professor and Vice Dean of the State Key Laboratory of Mechanical System and Vibration, School of Mechanical Engineering, Shanghai Jiao Tong University. He previously received his PhD degree from Zhejiang University and worked at Tsinghua University for postdoctoral research. Dr. Hu is leading several research projects funded by the National Natural Science Foundation of China and the National Basic Research Program of China. His research focuses on artificial intelligence in engineering design, such as conceptual design, knowledge-based design, and biologically inspired design.
Jin Qi is an Assistant Professor in the School of Mechanical Engineering, Shanghai Jiao Tong University. His research interests include case-based design and knowledge-based design. Dr. Qi is in charge of several research projects funded by the National Natural Science Foundation of China and the Natural Science Foundation of Shanghai.
Tao He is a PhD candidate in the State Key Laboratory of Mechanical System and Vibration, School of Mechanical Engineering, Shanghai Jiao Tong University. His research interest lies in artificial intelligence in engineering applications.
Ying-Hong Peng is a Professor in the School of Mechanical Engineering, Shanghai Jiao Tong University. He received his PhD degree from Central South University and then worked at Shanghai Jiao Tong University for postdoctoral research. Dr. Peng is the Director of the Institute of Knowledge-Based Engineering, Shanghai Jiao Tong University. His research interests include knowledge-based engineering, plastic forming theory, and simulation technology. He has authored more than 200 journal articles and conference papers.