I. INTRODUCTION
Graphene as a nanomaterial is considered for a variety of applications, including electronics, sensors, supercapacitors, composites, and others. Reference Choi and Lee1–Reference Rümmeli, Rocha, Ortmann, Ibrahim, Sevincli, Börrnert, Kuntsmann, Backmatiuk, Potschke, Shiraishi, Meyyappan, Buchner, Roche and Cuniberti3 Besides chemical synthesis, chemical vapor deposition (CVD) has emerged as a viable technique to prepare graphene on various substrates including silicon and copper. Reference Choi and Lee1–Reference Rummeli, Bachmatiuk, Scott, Bornett, Warner, Hoffman, Lin, Cunibert and Buckner7 Successful demonstration of single, bi-, and multilayer graphene has been reported by many groups. Recently, plasma-enhanced CVD (PECVD) has also been used in the preparation of graphene. Reference Hiramatsu, Shiji, Amano and Hori8–Reference Yuan, Zhang, Yang, Yang, Li, Wang, Meng, He, Wu, Belloy, Lee and Lee17 Growth has been reported on a wide range of substrates, including silicon, copper, nickel, tungsten, tantalum, Mo, Zr, SiO2, Al2O3, and stainless steel. Reference Wang, Zhu, Outlaw, Zhao, Manos, Holloway and Mammana10,Reference Wang, Zhu, Outlaw, Zhao, Manos and Holloway11 There are several unique features about PECVD of graphene. First, it is possible to grow vertically aligned graphene, sometimes also referred to as carbon nanosheets or carbon nanowalls (CNWs). Reference Hiramatsu, Shiji, Amano and Hori8–Reference Meyyappan, Lee and Sankaran19 These structures may be useful in applications involving chemical sensors, biosensors, supercapacitors, batteries, and others. Second, growth is reported without the aid of a catalyst. Hori and coworkers Reference Hiramatsu, Shiji, Amano and Hori8,Reference Hiramatsu and Hori9 showed that injection of hydrogen atoms to a hydrocarbon plasma enables growth of CNWs without a catalyst. No growth was reported for their conditions in the absence of H radical injection. Wang et al. Reference Wang, Zhu, Outlaw, Zhao, Manos, Holloway and Mammana10–Reference Zhu, Wang, Holloway, Outlaw, Zhao, Hou, Shutthanandan and Manos12 reported CNW growth on twelve different substrates using inductively coupled plasma with methane diluted in H2 at a concentration of 5–100%; CNWs ranging from one to three layers were grown independent of the substrate used. PECVD of vertically aligned graphene has also been reported without hydrogen injection Reference Hiramatsu, Kihashi, Kondo and Hori20 ; therefore, the role of plasma species, such as hydrogen, on the PECVD of vertically aligned graphene remains a subject of controversy.
For example, in CVD growth without plasma, hydrogen has been shown to act as a kinetic inhibitor for the CH4 dehydrogenation on copper by blocking reactive sites on the surface. Reference Losurdo, Giangregorio, Capezzuto and Bruno21 Furthermore, hydrogen has been reported to have a deleterious effect on the quality of graphene grown on Cu; however, most studies on PECVD of vertical graphene use a CH4/H2 precursor gas mixture as mentioned earlier. Reference Hiramatsu, Shiji, Amano and Hori8–Reference Malesevic, Vitchev, Schouteden, Volodin, Zhang and Tendeloo13,Reference Meyyappan18,Reference Meyyappan, Lee and Sankaran19 As a result, a recent study by Kim et al. Reference Kim, Lee, Kim, Jerng, Joo, Kim, Jung, Yoon, Park, Seo and Chun22 investigated the effect of hydrogen during PECVD of graphene by only using CH4 and measuring plasma species with mass spectrometry during growth. They successfully grew high-quality single-layer graphene on Cu and correlated the increase of hydrogen species to reduced grain sizes due to an etching effect by hydrogen. Their work demonstrated methane alone can result in high-quality graphene growth, although their PECVD did not result in vertically aligned graphene. The contradictory observations in the literature indicate the need to monitor plasma conditions during PECVD of graphene especially since the exact nature of hydrogen's role is still uncertain.
Adding to the complexity with PECVD synthesis are the unknown effects from plasma conditions due to the myriad of radicals and fractional species generated in hydrocarbon plasma used in carbon nanostructure growth. Reference Levchenko, Ostrikov, Rider, Tam, Vladimirov and Xu23–Reference Cruden and Meyyappan27 This effect can be exacerbated from variations in one lab to another because of differences in growth variables, such as chamber geometry, pressure, flow rates, plasma power coupling, etc. Reference Cruden, Cassell, Hash and Meyyappan25–Reference Oye, Bank, Ptak, Reedy, Goorsky and Holmes29 ; such variations can have different effects on the amount of defects that get incorporated into graphene. Although the plasma research community had dealt with plasma variability issues in the past by implementing standardized GEC cells Reference Miller, Hebner, Greenberg, Pochan and Aragon30 for plasma characterization, this type of standardization has not been adopted for reports on the PECVD of graphene or carbon nanotubes. Given the utility of low temperature plasmas for the growth of a variety of carbon and other nanostructures, Reference Ostrikov, Neyts and Meyyappan31 such coordinated efforts in plasma nanoscience would be highly valuable. The key plasma effects at nanoscales on the surfaces may be quite similar from the conceptual point of view and even in different plasma sources. Reference Ostrikov, Neyts and Meyyappan31 This is why a combination of the plasma radical production, surface interactions, and nanoscale reactive plasma chemistry, nanoscale plasma–surface interactions, etc., is a viable approach toward deterministic control of a broad class of nanomaterials produced or processed using plasmas. As a small step toward plasma diagnostics for the understanding of graphene growth, the purpose of this article is 2-fold. First, we present results from optical emission spectroscopy (OES) during PECVD and correlate to the properties of vertically aligned graphene. Second, we provide insight into the plasma species responsible for the growth. This is the first experimental report on using OES to track atomic carbon species responsible for vertically aligned graphene growth using pure CH4 precursor and provide correlations of atomic C to other plasma species with subsequent probing of their influence on material properties using Raman spectroscopy.
II. EXPERIMENTAL WORK
Vertically aligned graphene was grown on the Cu substrate at 550 °C by PECVD using a reactor described previously. Reference Delzeit, McAninch, Cruden, Hash, Chen, Han and Meyyappan32 CH4 gas flow was maintained at 10, 15, and 20 sccm with 200, 250, and 300 W using 13.56 MHz radiofrequency (RF) applied power in an inductively coupled plasma reactor. As a result, nine power flow combinations were studied in this work. OES in the range of 200–800 nm was performed for each growth to monitor the plasma species in the brightest spot within the plasma. OES provides insight into the dissociated plasma species in the reactor Reference Cruden and Meyyappan27,Reference Delzeit, McAninch, Cruden, Hash, Chen, Han and Meyyappan32 ; and as such, we tracked CH, Hβ, C, and C2 optical emission peaks corresponding to the electronic transitions involving A2Δ → X2Π (431 nm), n = 4 → 2 (486 nm), 1P0 → 1S (248 nm), and A3Πg → X3Πu (516 nm), respectively. Reference Vizireanu, Stoica, Luculescu, Nistor, Mitu and Dinescu33–Reference Al-Shboul, Harilal, Hassanein and Polek35 Although OES peak intensities are related to the amount of each respective species in the plasma, Reference Gottscho and Donnelly36 no actinometry was performed to measure the absolute amount of each species, but rather the relative amounts of species with respect to each other are obtained. Accordingly, the peak ratio of a particular species with respect to another can give further insight into the effects that each species has and therefore ratios involving C/C2, H/CH, C/CH, and C/H are also presented in this work.
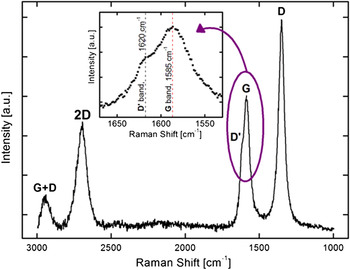
The as-grown vertical graphene was analyzed by Raman Spectroscopy using a Renishaw Raman Spectrometer (Hoffman Estates, IL) with 514-nm Ar ion laser. Five peaks were observed in the Raman shift at approximately: 1350, 1585, 1620, 2700, and 2950 cm−1, which correspond to the D, G, D′, 2D, and G + D bands, respectively. Reference Ferrari, Meyer, Scardaci, Casiraghi, Lazzeri, Mauri, Piscanec, Jiang, Novoselov, Roth and Geim37 Specifically, the ratio of the D and G peaks (I D/I G ratio) gives insight into the disorder state in the microcrystalline graphitic structure of the vertically aligned graphene, Reference Vizireanu, Ionita, Dinescu, Enculescu, Baibarac and Baltog38 which results from disorder due to edges, charge puddles, ripples, or any other defects. Reference Rao, Sood, Subrahmanyam and Govindaraj39 The I G/I 2D peak ratio gives insight into the number of graphene layers (single or multilayer), and I D′/I G relates to the amount of graphene edges that are present. These ratios were measured for each of the nine power flow combinations and correlated to the OES data. The vertical nature of the graphene was visualized using a Hitachi S-4800 scanning electron microscope (SEM; Pleasonton, CA).
III. RESULTS AND DISCUSSION
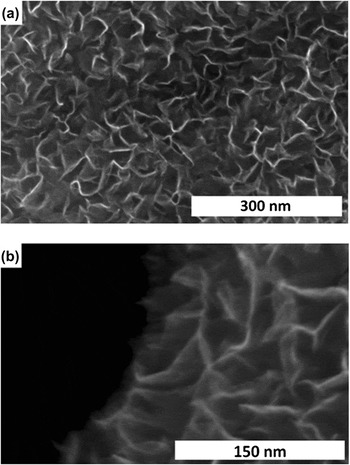
Figure 1 shows representative images of the vertically aligned graphene grown by PECVD on Cu substrates, and Fig. 2 shows a representative Raman spectrum of the vertically aligned graphene. The D′ band manifests as a shoulder peak at 1620 cm−1. The inset of Fig. 2 shows an expanded view near the D′ and G bands. The D′ and G band ratio here was determined by taking the intensity value of the D′ band at 1620 cm−1 with respect to the G band peak measured at around 1585 cm−1. Since there is a superposition of the D′ and G band peaks, the full width at half maximum width of the peak would be quantitatively related to the peak intensity. Other researchers have obtained this ratio by fitting multiple Lorentizan curves under the superposition of D′ and G peaks, Reference Lv, Li, Botello-Mendez, Hayashi, Wang, Berkdemir, Hao, Elıas, Cruz-Silva, Gutierrez, Kim, Muramatsu, Zhu, Endo, Terrones, Charlier, Pan and Terrones40 but for the purpose of correlating OES results to graphene quality, the estimated quantitative approach presented herein is sufficient.
Representative SEM images of vertical graphene grown by PECVD at magnifications of: (a) 180 k and (b) 400 k.

Representative Raman spectra of vertical graphene produced by PECVD, showing peaks of 2D, D′, G, and D bands.

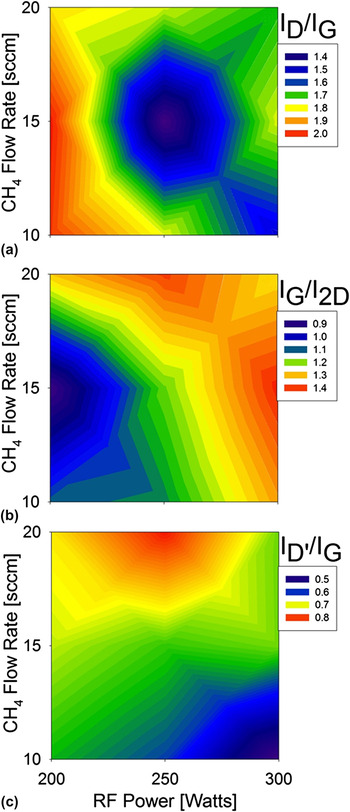
The Raman peak ratios of interest are plotted in Fig. 3: (a) D versus G, (b) G versus 2D, and (c) D′ versus G bands. The intensity of the D band versus G band gives indication on the relative extent of overall defects present in the material (I D/I G) and represents an in-plane stretching in graphene of the carbon–carbon bonds, which can occur due to defects such as vacancies and edges. Reference Lv, Li, Botello-Mendez, Hayashi, Wang, Berkdemir, Hao, Elıas, Cruz-Silva, Gutierrez, Kim, Muramatsu, Zhu, Endo, Terrones, Charlier, Pan and Terrones40 The level of defects in the vertical graphene grown by PECVD is expected to be higher than graphene synthesized without plasma due to an increased amount of plasma damage. Reference Cancado, Jorio, Martins Ferreira, Stavale, Achete, Capaz, Moutinho, Lombardo, Kulmala and Ferrari41 The lowest amount of defects was observed for 250 W and 15 sccm of CH4, which is the base growth condition determined to be the optimal plasma condition for minimizing defects in this work. For lower power [200 W with 10–15 sccm at the lower left in Fig. 3(a)], there was a greater effect on the amount of defects compared with higher power [300 W with higher 15–20 sccm flow rates at the upper right in Fig. 3(a)]. At the optimal power of 250 W, the effect of higher or lower flow rate (10 or 20 sccm) was not much of a factor. The smallest change from the optimal 250 W and 15 sccm condition was observed by moving to higher power and low flow (300 W and 10 sccm).
Peak intensity ratios of Raman (a) D versus G peaks, (b) G versus 2D, and (c) D′ versus G.

The peak intensity ratio (I G/I 2D) in Fig. 3(b) shows that the least amount of graphene layers were obtained at the lower power and flow conditions (200 W and 10–15 sccm), whereas higher power and flow resulted in an increased number of graphene layers. The I D′/I G Raman peak ratio in Fig. 3(c) gives insight into the amount of graphene edges that are present, which was the lowest in our high power and low flow combination (300 W and 10 sccm). Although the minimum in the amount of overall defects (I D/I G ratio) occurred at the middle power and flow combination, the number of graphene layers (I G/I 2D) and the amount of graphene edges (I D′/I G) occurred on nearly opposite sides of the defect minimum centered around the 250 W and 15 sccm growth condition. The effects of the PECVD conditions on the material properties are orthogonal: Fig. 3(b) gets larger going from lower left to upper right, whereas Fig. 3(c) gets larger going from lower right to upper left, with the minimum in defects at the center for 250 W and 15 sccm.
For the highest power and lowest flow condition of 300 W and 10 sccm, the plasma will be most energetic due to two effects: (i) the higher applied RF power will increase the electric field within the plasma that will subsequently increase the acceleration of charged species to give them more energy, and (ii) lower flow rates will lead to lower pressures that correspond to larger mean free paths by which charged species can accelerate under the applied electric field to gain more energy. The most energetic plasma condition (300 W and 10 sccm) correlated to the least amount of graphene edges being grown [Fig. 3(c)]. The trends in the I D′/I G exhibits a strong correlation to the behavior of the energetics associated with the plasma species. Although it would be expected that higher power and lower gas flow combinations would also generate more energetic plasma ions, this would be for future study and the current work only correlates the neutral plasma species experimentally measured from OES to that of graphene properties measured from Raman Spectroscopy. Characterization of ions, characterization of energies, and Langmuir probe studies to obtain plasma conditions would aid in the understanding of the correlation between the ion bombardment and material quality.
In vertically aligned graphene growth, the electric field resulting from the plasma aligns the graphene sheets vertically in a direction parallel to the electric field (direction normal to the substrate surface). Therefore, the amount of graphene edges being observed from the Raman spectroscopy [Fig. 3(c)] suggests that a field-assisted growth of graphene similar to that of carbon nanotube growth Reference Ostrikov, Neyts and Meyyappan31,Reference Meyyappan, Delzeit, Cassell and Hash42 resulted in more complete vertically aligned graphene sheets with fewer edges for the most energetic plasma condition, as indicated from the strong correlation between the material properties and the expected energetic behavior from the plasma. The limitation with graphene growing at the edges is not species limited, but rather reaction limited, because the trends in the plasma conditions for the species identified in the plasma correlate directly to the amount of edges observed; this means that the species generated by the plasma get consumed during the graphene growth.
However, the number of graphene layers correlated with the I G/I 2D ratio in Fig. 3(b) suggests that there may have been a combination of limitations due to the energetics of the plasma and a chemical reaction limitation. The number of graphene layers increased with higher power and higher flow rate, suggesting that more energetic plasma facilitates the growth [i.e., moving to the right to higher powers in Fig. 3(b) led to more graphene] and a species-limited growth effect [i.e., move upward to higher flow rates in Fig. 3(b) also led to more graphene]. Although increasing RF power provides more energy to the plasma species, the chemical reaction is also limited by the amount of precursor available. In all cases, there was a dependency on both RF power and the amount of CH4 precursor (i.e., CH4 flow rate) that resulted in increased amount of graphene, and therefore suggests that the number of layers is dependent on both the plasma energetics limitation and the species-limited effect.
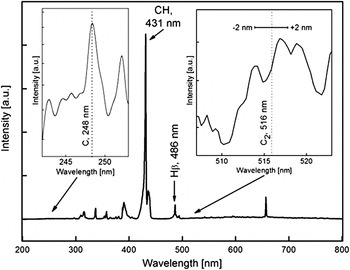
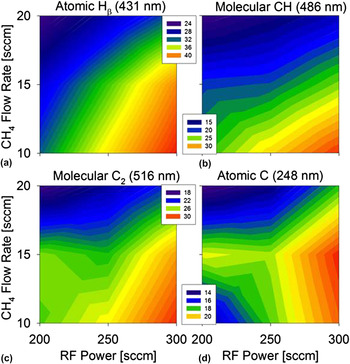
The minimum in the defects (I D/I G ratio) in Fig. 3(a) cannot be rationalized by the expected plasma energetics behavior alone. Therefore, we look to OES to further correlate plasma species responsible for observed growth characteristics. There is evidence from numerical simulations for the impact of plasma species on the formation and growth kinetics of nanowalls. Reference Levchenko, Ostrikov, Rider, Tam, Vladimirov and Xu23 Figure 4 shows a representative OES plasma spectrum showing peaks from atomic C and Hβ, and molecular CH and C2. The insets show enlarged regions of the spectrum around 248 nm and 516 nm for atomic C and C2, respectively. The molecular C2 Swan bands are observed around 516 ± 2 nm, and the maximum value within this range was used in Fig. 5 for reporting OES peak intensities at various power and flow combinations. The trends in atomic H, molecular CH, and C2 [Figs. 5(a)–5(c), respectively] exhibit the same general correlations to the energetics of the plasma (i.e., higher power and lower flow rate lead to a more energetic plasma for increasing dissociative plasma reactions to generate more species).
Representative optical emission plasma spectrum under growth conditions of 300 W and 10 sccm CH4, showing peaks of interest for C, CH, H, and C2.

Optical emission peaks for (a) atomic H, (b) molecular CH, (c) molecular C2, and (d) atomic C. Scale is in arbitrary linear units.

There is a strong correlation between the expected plasma energetics and the number of graphene layers [Fig. 3(c)], suggesting that either the energetics of the plasma and/or increased amount of H, CH, and/or C2 species are responsible. Hydrogen removes amorphous carbon deposited during graphene growth and thereby facilitates graphitic graphene growth, which supports the strong relationship of the H concentration to the amount of graphene edges [comparing Fig. 5(a) with Fig. 3(c)]. The hydrogen therefore allows graphene to grow more complete layers, thereby minimizing the amount of “ungrown” edges left exposed after growth. This would be in accordance with the correlated trend in Fig. 3(c) in which the least amount of graphene edges were measured for plasma conditions that also led to the most amount of atomic H; however, an excess of hydrogen has also been considered to have an etching effect of the graphene. Therefore, looking at a combination of both hydrogen and carbon [CH in Fig. 5(b)], a correlated trend to the plasma energetics is noticed (i.e., more energetic plasma at higher power and lower flow), but the trend is not as strongly correlated for the lower power and flow (200 W and 10 sccm). The lower left of Fig. 5(b) exhibits a minimal effect of CH for a higher flow rate at the same power (200 W and 15 sccm). As shown previously in Figs. 3(b) and 3(c), there was an orthogonal correlation between the measured number of graphene layers and the amount of edges for various power and flow combinations. There is likely an equilibrium between reaction-limited and species-limited growth as well as a balance between the amount of species that could be generated due to the expected energetics from the plasma. Therefore, the bottom left corner in Fig. 5(c) for 200 W and 10 sccm may have been from not having enough energy from the plasma at the lower 200 W to allow reactions to progress and, therefore, may have caused a higher concentration of CH to be detected in the chamber for 10–15 sccm at the low power (200 W) condition in Fig. 5(b). When considering the carbon-only species (C2), there is an even lesser dependence of flow rate at the lower power and flow rates of (200 W with 10–15 sccm). The amount of C2 measured in the chamber resulting from the CH4-only precursor is of interest because it provides insight into the amount of active carbon species that would have reacted to form molecular carbon, but not necessarily contributing to the growth of graphene on the substrate. As such, the less energetic plasma due to 200 W led to a reaction-limited condition, whereby less carbon was able to get incorporated into the graphene. A balance was struck between 10 and 15 sccm flow conditions in which the reduced amount of carbon incorporated into the graphene at 15 sccm was offset by a higher amount of carbon flowing into the chamber, and as a result led to constant amount of measured C2 species between 10 and 15 sccm at 200 W in Fig. 5(c).
The minimum in the amount of measured defects [Fig. 3(a)] occurred at 250 W with 15 sccm and there is also a pivot point circling the 250 W and 15 sccm base condition in Fig. 5(c). Therefore, the atomic C concentration in Fig. 5(d) shows a saddle point around this base condition of 250 W and 15 sccm plasma condition. A higher power (300 W) from the base condition of 250 W and 15 sccm led to increased generation of atomic C, whereas lower power (200 W) with either higher or lower flow rate (20 or 10 sccm) led to reduced atomic C. There was minimal impact on the atomic C at 15 sccm for powers of 200 and 250 W. For all powers with flow rates less than 15 sccm in both Figs. 5(d) and 3(b), there was a comparable trend between the atomic C and the number of graphene layers [as shown in the bottom half of Figs. 5(d) and 3(b)]. This suggests that atomic C is strongly correlated to the number of graphene layers for lower flow rates in this regime and hence species limited.
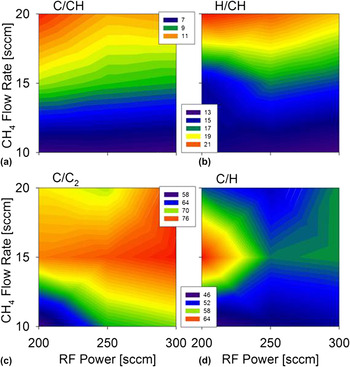
To further confirm the effect of atomic C, identifying individual plasma species alone is not enough to correlate the effects of plasma conditions on graphene growth. Therefore, comparing ratios of OES peaks, as shown in Fig. 6, can further elucidate the effects of plasma species with respect to other(s). The measured ratios for C/CH and H/CH species shown in Figs. 6(a) and 6(b) further support the minimal impact of power on the plasma species when compared with the greater dependence on flow rate [i.e., greater vertical dependency in Figs. 6(a) and 6(b) than on a horizontal dependency]. Since CH4 was the only precursor used in this work, all H and C species can only be derived from the feedstock CH4; as such, the C/CH and H/CH ratios show the effect of flow rate leading to a drastic correlation for lower power and higher flow rate [200 W at 20 sccm in the upper left of Figs. 6(a) and 6(b)]. If the graphene growth on the substrate were reaction limited, then additional species generated in the chamber would not have been able to react and form graphene. Therefore, looking at the amount of C/CH, it is maximum at 20 sccm with 200 W but decreases for higher power at the same 20 sccm flow rate because the increased energy from the plasma is able to overcome the reaction limitation and cause more atomic C to get consumed with respect to CH, thereby decreasing the C/CH ratio. The effect of H/CH is not as drastic for higher powers at 20 sccm, which would be expected, since H does not get incorporated into graphene, and the increased generation of H could be from more dissociation of the CH4. However, looking at a species-dependent case for the lower flow rate of 10 sccm of C/CH and H/CH in Figs. 6(a) and 6(b), they show no dependency due to higher power since the limitation in the lower half is species dependent. In other words, there is enough energetics of the plasma (because of the lower flow rate leading to increased mean free paths) to cause the graphene growth reaction to progress; so any amount of C or H with respect CH was able to immediately get incorporated or consumed during graphene growth.
Peak intensity ratios for (a) C/CH, (b) H/CH, (c) C/C2, and (d) C/H. Scale is in arbitrary linear units.

Investigating effects from both flow and carbon-only species, Fig. 6(c) also shows a stronger dependence on flow rate than on power, with the 15 sccm exhibiting a higher ratio of C/C2 than with 10 or 20 sccm; however, the maximum C/C2 ratio trends toward the upper right of the graph for higher power and flow (toward 300 W and 20 sccm), with the minimum C/C2 ratio occurring for lower power and flow (200 W and 10 sccm). The observed trend of increasing from lower left to upper right in Fig. 6(c) is identical to that of the number of graphene layers [Fig. 3(b)], which would support the hypothesis that atomic C facilitates the growth of multilayer graphene in a species-limited growth regime. However, the effect of atomic H on the graphene growth in terms of number of graphene layers, edges, and defects is still uncertain. Hydrogen has been known to etch away amorphous carbon, which would be more dominant in a reaction-limited graphene growth regime. Therefore, the competing effects of atomic C and H are plotted in Fig. 6(d), which show the saddle point at the base growth condition of 250 W and 15 sccm where the optimal growth occurs to minimize overall defects arising from disorders due to vacancies, edges, charge puddles, ripples, or others. Reference Ferrari, Meyer, Scardaci, Casiraghi, Lazzeri, Mauri, Piscanec, Jiang, Novoselov, Roth and Geim37 The saddle point in Fig. 6(d) demonstrates the balance between species limitation of the growth and limitations from the energetics of the plasma, and manifests as an optimal C/H ratio that occurs at 250 W and 15 sccm. If the ratio goes up too high for different powers or drops too low for various flow rates, then it disrupts the balance from the optimal growth condition between the competing effects of the graphene growth.
IV. CONCLUSION
We have used OES analysis of the plasma to correlate C, C2, CH, and H plasma species to the material properties of vertically aligned graphene grown on copper by PECVD. Data from Raman spectroscopy show a minimum in defect concentration at 250 W and 15 sccm of CH4 flow rate, which corresponds to a crossover saddle point in the C/H ratio. The results indicate that tracking atomic C species using OES is useful for optimizing growth characteristics of the material. OES is one of the most basic plasma diagnostics tool and much richer information about ions, excited species, radicals, and other neutrals may be obtained from UV-vis-IR spectroscopy, mass spectroscopy, and other diagnostics techniques and plasma modeling. In addition, the photons in the plasma may have an effect on the properties of the as-grown material, which warrants consideration.
ACKNOWLEDGMENTS
The authors acknowledge technical assistance and insightful discussions with Brett Cruden. Work by E.S.-R. was made possible through a Jenkins/NASA Fellowship. A NASA grant NNX09AQ44A to the University of California Santa Cruz is acknowledged for instruments in the UCSC MACS Facility within the UCSC/NASA-ARC ASL. W.P., D.O., J.P., D.M., B.W., S.T., and T-T.N-D. are student interns. M.W. now with University of Kentucky. T-T.N-D., J.G., and M.O. are employed by ELORET Corporation at NASA Ames.