Introduction
Polymer composites with tunable thermal stability and surface morphology are attracting increasing attention due to their critical role in next-generation materials for high-performance engineering applications. Such materials are particularly promising for heat-resistant packaging, lightweight insulation systems, structural components in aerospace and automotive sectors, flame-retardant formulations, electronic and electrical enclosures, and multi-functional surface coatings. In barrier and nanostructured polymer systems, precise control over degradation pathways and surface roughness is especially crucial as these parameters influence directly gas and moisture permeability, mechanical integrity, and interfacial transport phenomena. Furthermore, engineered surface topography at the micro- and nanoscale can impart advanced functionalities such as anti-fouling, self-cleaning, enhanced adhesion, and tunable optical or electrical properties. Therefore, the rational design of polymer composite architectures with controllable thermal and morphological characteristics represents a key strategy for developing high-performance, multi-functional materials for emerging industrial and technological applications.
Polystyrene (PS) is a widely used thermoplastic in packaging, electronics, and construction due to its low density, ease of processing, and cost effectiveness (Schlemmer et al., Reference Schlemmer, De Oliveira and Araújo Sales2007). Despite these advantages, PS can exhibit limited thermal robustness and durability under demanding service conditions, which restricts its use in applications involving elevated temperatures or long-term exposure to harsh environments (Birley, Reference Birley2012; Yousif and Haddad, Reference Yousif and Haddad2013; Arfin et al., Reference Arfin, Mohammad and Yusof2015; Moskalyuk et al., Reference Moskalyuk, Belashov, Beltukov, Ivan’kova, Popova, Semenova, Yelokhovsky and Yudin2020; Pielichowski et al., Reference Pielichowski, Njuguna and Majka2022). Enhancing PS performance while maintaining its processability therefore remains an important materials-design objective.
Incorporation of inorganic fillers is a common strategy to improve the thermal and mechanical response of PS-based materials, primarily through restricted chain mobility, heat-shielding/barrier effects, and reinforcement of the polymer matrix (Althues et al., Reference Althues, Henle and Kaskel2007; Leszczyńska et al., Reference Leszczyńska, Njuguna, Pielichowski and Banerjee2007; Meth et al., Reference Meth, Zane, Chi, Londono, Wood, Cotts, Keating, Guise and Weigand2011; Hong and Chen, Reference Hong and Chen2014; Liu et al., Reference Liu, Jia, Jia and Zhou2014). However, property gains are highly sensitive to the filler morphology (particle vs high-aspect-ratio), characteristic size (micro vs nano), and dispersion state, because these factors govern interfacial area, filler networking, and defect formation (e.g. agglomerates and voids). Accordingly, controlled comparisons between fillers with fundamentally different geometries and length scales are essential for establishing rational structure–property relationships in PS composites.
Silica (SiO2) and halloysite nanotubes (HNTs) represent two attractive, yet strongly contrasting, inorganic additives. Silica is typically introduced as near-spherical particulate reinforcement; its effect is commonly associated with the hard and thermally stable Si–O network and a barrier contribution that can slow down transport of degradation products within the polymer (Morrow and McFarlan, Reference Morrow and McFarlan1990; Zhuravlev, Reference Zhuravlev2000; Sanchez et al., Reference Sanchez, Julián, Belleville and Popall2005; Zou et al., Reference Zou, Wu and Shen2008; Haider et al., Reference Haider, Kausar and Muhammad2017; Pun et al., Reference Pun, Siddhartha and Singh2019; Kankala et al., Reference Kankala, Han, Na, Lee, Sun, Wang, Kimura, Ok, Yamauchi and Chen2020; Sharma et al., Reference Sharma, Sudhakara, Omran, Singh and Ilyas2021). In a study by Kandemir (Reference Kandemir2025) on nanosilica-reinforced polymer nanocomposite films, the measured mechanical response was shown to depend heavily on the reinforcement mechanism and testing/loading regime, emphasizing the role of dispersion and microstructure in the apparent performance.
In contrast, HNTs are naturally occurring aluminosilicate nanotubes with a high-aspect-ratio tubular architecture and hydroxyl-bearing surfaces (Lin et al., Reference Lin, Ng, Chan, Sun and Wu2011; Rawtani and Agrawal, Reference Rawtani and Agrawal2012; Gaaz et al., Reference Gaaz, Sulong, Kadhum, Al-Amiery, Nassir and Jaaz2017; Yang et al., Reference Yang, Chen, Leng, Huang, Wang and Tian2017; Kausar, Reference Kausar2018; Idumah et al., Reference Idumah, Hassan, Ogbu, Ndem and Nwuzor2019; Darrat, Reference Darrat2020; Donmez et al., Reference Donmez, Kandemir and Can2022; Si and Guo, Reference Si and Guo2022; Fahimizadeh et al., Reference Fahimizadeh, Wong, Baifa, Sadjadi, Auckloo, Palaniandy, Pasbakhsh, Tan, Singh and Yuan2024). Their anisotropic geometry can promote tortuous transport pathways and distinct packing behavior compared with spherical fillers, potentially influencing thermal degradation and surface texture at comparable mass fractions. In a separate study, we implemented a two-level micro/nano reinforcement strategy combining silica and halloysite within polymer composites and quantified their mechanical reinforcement contributions within a unified design framework (Kandemir et al., Reference Kandemir, Donmez, Davut and Can2022).
Despite extensive studies on silica-filled and halloysite-filled polymer composites, the specific influence of filler morphology and characteristic size on the thermal degradation behavior and surface topology of highly filled PS systems remains insufficiently understood. In particular, few direct comparisons between particulate microsilica and nanotubular HNTs under identical filler loading conditions have been done. Filler geometry and aspect ratio were hypothesized to influence the degradation pathway and surface architecture of PS composites through different transport-restriction and packing mechanisms, even without covalent polymer–filler bonding (Leszczyńska et al., Reference Leszczyńska, Njuguna, Pielichowski and Banerjee2007; Meth et al., Reference Meth, Zane, Chi, Londono, Wood, Cotts, Keating, Guise and Weigand2011; Liu et al., Reference Liu, Jia, Jia and Zhou2014). Therefore, the objective of the present study was to investigate comparatively the morphology-dependent effects of microspherical silica and halloysite nanotubes on the thermal stability and surface morphology of highly filled PS composite films prepared under comparable conditions.
Materials and methods
Materials
Styrene (C6H5CH=CH2, molecular weight: 104.15 g mol–1, purity: ≥99.9%) used in homopolymerization was obtained from Sigma-Aldrich. Benzoyl peroxide (C14H10O4, molecular weight: 242.23 g mol–1, purity: ≥97.0%) used in homopolymerization was purchased from Fluka. Benzene (C6H6, molecular weight: 78.11 g mol–1, purity: ≥99.7%) used in homopolymerization was supplied by ISOLAB. Petroleum ether (C6H14, molecular weight: 86.178 g mol–1, bp minimum 75% at 40–60°C) used in homopolymerization was acquired from Sigma-Aldrich. Toluene (C7H8, molecular weight: 92.14 g mol–1, purity: ≥99.9%) used in nanocomposite production was sourced from ISOLAB. Halloysite nanotubes (HNTs) with a particle size below 100 nm (minimum 35% Al2O3, maximum 0.7% Fe2O3, maximum 1.2% SO3) used in nanocomposite production were supplied by ESAN Eczacıbaşı. Silicon dioxide (SiO2, molecular weight: 60.08 g mol–1, purity: ~99%) used in nanocomposite production was obtained from Sigma-Aldrich.
Styrene homopolymerization
In a reaction tube, 50 mL of styrene was mixed with 0.25 g of benzoyl peroxide initiator (2 wt.% relative to the monomer), which had been dissolved previously. Subsequently, 12.5 mL of benzene was added. The tube was sealed and wrapped in aluminum foil. It was then placed in an oil bath at 70°C under magnetic stirring at 300 rpm for 4 h to facilitate the polymerization reaction (Fig. 1a).
(a) Schematic representation of polystyrene preparation; (b) schematic representation of polystyrene–HNT composite preparation by the solvent-casting method.

Figure 1. Long description
Panel a shows the preparation of P S. It begins with styrene being poured from a beaker into a test tube, followed by the addition of benzoyl peroxide. An arrow labeled dissolving points to a pipette adding benzene to the mixture. The test tube is then placed in a beaker on a magnetic stirrer. Conditions are noted as 70 degrees Celsius, 300 r p m, for 4 h. The liquid is poured into a petri dish and labeled drying, resulting in a photo of solid white P S in a container.
Panel b shows the preparation of the composite. Two parallel paths start on the left. The top path shows polystyrene in a beaker with toluene added via pipette, stirred at room temperature and 400 r p m for 2 h. The bottom path shows H N T in a beaker with toluene added via pipette, also stirred at room temperature and 400 r p m for 2 h. Arrows from both paths converge as the H N T mixture is poured into the polystyrene beaker. This combined mixture is stirred at room temperature and 400 r p m for 2 h. Finally, the mixture is poured into a petri dish, labeled drying, resulting in a photo of a yellowish-brown composite film.
After completion of the polymerization, the tube was opened, and the precipitated polymer was collected in a glass Petri dish using petroleum ether. The collected material was dried in an oven at 60°C, and the resulting solid was subsequently scraped from the Petri dish to obtain polystyrene.
Film productions via solvent casting
Polystyrene films were produced as follows: in a beaker, 5.0108 g of polystyrene was dissolved in 10 mL of toluene at room temperature for 2 h under magnetic stirring (300 rpm). Although aqueous systems and alternative solvents were also reported in the literature for certain polymer/HNT composite formulations (Bianco et al., Reference Bianco, Calvino, Lazzara, Milioto and Cavallaro2025), toluene was selected in the present study because of its good solvating ability for polystyrene and its suitability for homogeneous PS film preparation via solvent casting. The solution was poured into a glass Petri dish and dried in an oven at 45°C. After solvent evaporation, the resulting film was peeled/scraped from the dish using a spatula.
Polystyrene–halloysite composite films were produced as follows: in a beaker, 5.0014 g of polystyrene was dissolved in 30 mL of toluene at room temperature for 2 h under magnetic stirring (400 rpm). The higher solvent volume used for composite formulations reduced solution viscosity and facilitated filler dispersion. Separately, 2.0107 g of halloysite nanotubes (HNTs), corresponding to 40 wt.% relative to PS, was dispersed in 20 mL of toluene at room temperature for 2 h under magnetic stirring (400 rpm). The HNT dispersion was then added to the PS solution, and the mixture was stirred at 400 rpm for an additional 2 h. The resulting PS–HNT suspension was cast into a glass Petri dish and dried in an oven at 45°C. The dried film was removed from the dish using a spatula (Fig. 1b).
Polystyrene–silica composite films were produced as follows: in a beaker, 5.0015 g of polystyrene was dissolved in 30 mL of toluene at room temperature for 2 h under magnetic stirring (400 rpm). Separately, 2.0043 g of silica (SiO2), corresponding to 40 wt.% relative to PS, was dispersed in 20 mL of toluene at room temperature for 2 h under magnetic stirring (400 rpm). The silica dispersion was then added to the PS solution, and the mixture was stirred at 400 rpm for an additional 2 h to obtain a homogeneous PS–SiO2 suspension. The resulting PS–SiO2 suspension was cast into a glass Petri dish and dried in an oven at 45°C. The dried film was removed from the dish using a spatula (Fig. 2).
Schematic representation of polystyrene–silica composite preparation by the solvent-casting method.

Figure 2. Long description
The flowchart consists of four main stages.
1. Initial Preparation (Left): Two separate magnetic stirrers are shown. The top stirrer shows polystyrene being poured from a beaker and toluene added via a pipette into a beaker of blue liquid. The bottom stirrer shows silica being poured and toluene added into a separate beaker. Both are labeled with room temperature, 400 r p m, and 2 h.
2. Mixing (Top Right): Arrows from the first two steps point to a single magnetic stirrer where the two solutions are combined. This stage is also labeled room temperature, 400 r p m, and 2 h.
3. Casting (Bottom Center): A vertical arrow points down to a beaker pouring the combined mixture into a shallow petri dish. This step is labeled room temperature, 400 r p m, and 2 h.
4. Final Product (Bottom Right): An arrow labeled drying points from the petri dish to a photograph of a small plastic cup containing a white, solid material. The cup is hand-labeled P S plus silica.
Fourier transform infrared (FTIR) spectroscopy
The FTIR spectra of pure PS, PS–SiO2, and PS–HNT films were collected using a PerkinElmer Spectrum 400 spectrophotometer in the 4000–400 cm–1 range at 4 cm–1 resolution (16 scans).
Thermogravimetric analysis (TGA) measurements
Thermogravimetric analysis (TGA/DTG) was used to evaluate the thermal degradation behavior of pure PS, PS–SiO2, and PS–HNT films and to quantify the effect of silica and HNT additives on thermal stability. Measurements were performed on a Discovery SDT650 under nitrogen, heating from 25 to 600°C at 10°C min–1.
Atomic force microscope (AFM) analysis measurements
In this study, the NaioAFM device manufactured by Nanosurf was utilized. Measurements were conducted under atmospheric conditions using a silicon AFM probe produced by BudgetSensors, featuring a force constant of 48 N m–1 and a resonance frequency of 190 kHz. This probe consists of a rectangular cantilever with dimensions of 225 μm in length and 38 μm in width, with a sharp tip (probe tip) of 10 nm radius located at the end of the cantilever. Topographic images using AFM were obtained in dynamic force mode.
AFM topography measurements were acquired using a NaioAFM system under atmospheric conditions in dynamic force mode. The original NaioAFM height data were used for topographical evaluation. For the 3D surface representations, the AFM height data were processed and visualized using Gwyddion software. Standard background/plane correction and levelling were applied in Gwyddion to reduce sample tilt and improve the visualization of surface topography. The PS–HNT topography image presented separately was obtained from the original NaioAFM data. The roughness parameters, including Sa, Sp, Sv, and Sy, were extracted from the corresponding AFM height data.
Results and Discussion
FTIR analysis
Fourier transform infrared spectroscopy confirmed the successful incorporation of both fillers, as evidenced by the characteristic absorption bands. The FTIR spectra of neat polystyrene (PS) and PS composite films containing either microsilica (PS–silica) or halloysite nanotubes (PS–HNT) are shown in Fig. 3 and Table 1. Neat PS exhibited characteristic aromatic bands at 3060–3026 cm⁻1 (aromatic C–H stretching), 1601 cm⁻1 (aromatic C=C stretching), and ring-related bands at 1492 and 1451 cm⁻1. In addition, the out-of-plane aromatic C–H bending bands at ~753 and ~694 cm⁻1, typical of a monosubstituted benzene ring, were clearly observed. These PS signatures were retained in both composite spectra, indicating that the chemical structure of the PS matrix was preserved after composite preparation.
FTIR spectra of pure PS, PS-SiO2, and PS-HNT composites.

Figure 3. Long description
The x-axis represents Wavenumber in inverse centimeters, ranging from 4000 on the left to 400 on the right. The y-axis represents Transmittance in arbitrary units. Three spectral lines are stacked vertically.
Top line (Blue, P S): Shows characteristic peaks at 3060, 3026, 2920, and 2484. In the fingerprint region, sharp troughs appear at 1601, 1492, 1451, 753, and a deep primary trough at 694.
Middle line (Red, P S-H N T): Displays additional small peaks at the high end at 3693, 3621, and 3446. It shares the P S peaks at 3060, 3025, 2919, and 2847. A broad, deep trough is visible at 1030, followed by peaks at 908, 753, and 694.
Bottom line (Black, P S-Silica): Shows peaks at 3059, 3025, 2918, and 2848. It features unique peaks at 1108, 970, and 470, while maintaining the standard P S troughs at 1601, 1492, 1451, 752, and 694.
FTIR vibrational band assignments and structural analysis of PS and PS-based composite films containing silica and HNT

Table 1. Long description
The table consists of four columns: Wavenumber in cm super minus 1, Sample(s), Assignment (bond/vibration), and Structural and chemical interpretation.
Key data points include:
* 3693 and 3621: P S-H N T samples showing -O H stretching of structural hydroxyls in aluminosilicate.
* 3446: P S-H N T showing broad -O H stretching from adsorbed moisture.
* 3060 to 3025: All samples (P S, P S-silica, P S-H N T) showing aromatic C-H stretching from the P S phenyl ring.
* 2920: All samples showing aliphatic C-H stretching from the hydrocarbon backbone.
* 1601, 1492, and 1451: All samples showing aromatic C=C stretching and ring vibrations characteristic of P S.
* 1108: P S-silica showing Si-O-Si asymmetric stretching.
* 1030: P S-H N T showing Si-O stretching from the aluminosilicate framework.
* 970: P S-silica showing Si-O H or Si-O related vibrations.
* 908: P S-H N T showing Al-O H deformation.
* 753 to 694: All samples showing aromatic C-H out-of-plane bending for monosubstituted benzene.
* 470: P S-silica showing Si-O-Si bending.
For PS–silica composites, the successful incorporation of silica was confirmed by the emergence of characteristic absorption bands centered at ~1108 cm⁻1 and 470 cm⁻1, corresponding to the asymmetric stretching and bending vibrations of the Si–O–Si siloxane network, respectively. In addition, the band observed at ~970 cm⁻1 was assigned to surface silanol-related vibrations (Si–OH) or Si–O environments associated with partially condensed silicate structures that are typical of amorphous silica surfaces. The presence of these bands clearly indicated that silica particles were embedded within the PS matrix and retained their intrinsic siloxane network structure after composite processing. Importantly, no new absorption bands corresponding to novel functional groups or interfacial chemical bonds were detected in the composite spectra beyond the expected filler-related signals. Furthermore, the characteristic aromatic C–H stretching and ring-vibration bands of PS remained at similar wavenumbers and intensities compared with neat PS, indicating that the polymer backbone was preserved chemically and not perturbed significantly by the presence of silica. The absence of peak shifts, band broadening, or new interfacial vibrational features suggested that strong chemical interactions such as covalent grafting, esterification, or silane-coupling reactions did not occur under the processing conditions employed.
These observations collectively implied that silica was incorporated primarily via physical dispersion and interfacial interactions governed by van der Waals forces and possible hydrogen bonding between surface silanol groups and the polymer matrix, rather than through covalent bonding.
For PS–HNT, additional features were detected that were consistent with the aluminosilicate nature of halloysite. The bands at 3693 and 3621 cm⁻1 corresponded to structural O–H stretching vibrations in HNT, while the broader contribution around 3446 cm⁻1 was consistent with hydrogen-bonded hydroxyls and/or adsorbed moisture, which is commonly associated with clay-based fillers. In the fingerprint region, the band near ~1030 cm⁻1 was assigned to Si–O stretching of the aluminosilicate framework, and the band at ~908 cm⁻1 was attributed to Al–OH deformation. Together, these bands confirmed the incorporation of HNT within the PS film.
Note that the spectral region around 1027–1030 cm⁻1 might contain overlapping contributions from both PS-related vibrations and inorganic filler vibrations. In neat PS, the weak band near ~1027 cm⁻1 was associated with polymer-backbone and C–H-related vibrational modes reported in the literature. However, in PS–SiO₂ and PS–HNT composites, the strong Si–O–Si and aluminosilicate framework vibrations became dominant in this region and partially masked the relatively weak PS-related contribution. Therefore, the reduced visibility of the ~1027 cm⁻1 PS band in the composite spectra was attributed primarily to spectral overlap rather than to chemical degradation or C–C bond cleavage of the PS backbone during film preparation.
Overall, FTIR spectroscopy confirmed the successful incorporation of the inorganic fillers (silica or HNT) into the PS matrix while indicating that the chemical structure of the PS backbone remained intact. The characteristic absorption bands of silica (Si–O–Si stretching vibrations) and HNT (structural O–H and aluminosilicate bands) were observed clearly, whereas no additional peaks associated with new functional groups or interfacial covalent bonding were detected. These results suggested that the fillers were incorporated into the polymer matrix predominantly through physical dispersion and non-covalent interactions, rather than chemical grafting or covalent linkage with the PS chains.
However, although FTIR spectroscopy provided detailed information regarding the presence of filler-specific functional groups and confirmed the preservation of the PS backbone structure, it exhibited limited sensitivity for detecting low-density or highly localized interfacial covalent bonds. Therefore, while the FTIR results strongly suggested predominantly physical incorporation of the fillers, they could not completely rule out the presence of weak or sparsely distributed chemical interactions at the polymer–filler interface. In this context, complementary surface-sensitive and molecular-level techniques, such as X-ray photoelectron spectroscopy (XPS) or solid-state nuclear magnetic resonance (ssNMR), would provide a more definitive elucidation of interfacial bonding configurations and interaction mechanisms between PS and the fillers.
Thermogravimetric analyses (TGA)
Thermogravimetric (TGA) profiles of neat PS and the highly filled PS composites containing either microspherical silica or halloysite nanotubes (HNT) are presented in Figs 4 and 5 and the key degradation metrics extracted from these curves are summarized in Table 2. The discussion below focuses on how filler morphology and length scale (micro-particulate silica vs nano-tubular HNT) influence: (1) the onset of mass loss; (2) the progression through the main degradation step; and (3) high-temperature residue formation.
TGA thermograms of PS and its composites.

Figure 4. Long description
The figure consists of three panels. All graphs share the same axes: the x-axis represents Temperature in degrees Celsius from 0 to 1000, and the y-axis represents Weight percentage from 0 or 20 to 110.
Top-left panel: P S-Silica (red line). The curve shows a minor weight loss around 150 degrees, followed by a plateau. A sharp degradation begins near 362 degrees. Arrows point to inflection points at 362, 414, and 443 degrees Celsius. The final residue stabilizes at approximately 30 percent weight.
Top-right panel: P S-H N T (blue line). The curve shows a gradual initial loss, followed by a steep decline. Arrows indicate critical temperatures at 287, 394, and 450 degrees Celsius. The curve levels off at a residual weight of approximately 20 percent.
Bottom panel: P S (black line). This pure polymer sample shows a stable plateau until approximately 350 degrees. A very sharp, near-vertical drop occurs between 350 and 436 degrees. Arrows mark inflection points at 350, 402, and 436 degrees Celsius. The weight drops to nearly 0 percent, indicating complete decomposition.
Differential thermogravimetric (DTG) curves of neat PS, PS–silica, and PS–HNT composite films.

Figure 5. Long description
A line graph with the y-axis labeled D T G in percent per degree Celsius, ranging from negative 6 to 10, and the x-axis labeled Temperature in degrees Celsius, ranging from 0 to 700. The graph displays three vertically offset curves.
* The top curve, in black, represents neat P S. It remains stable near 9.5 until approximately 350 degrees Celsius, where it exhibits a sharp downward degradation peak. A label indicates T sub max equals 407 degrees Celsius at the lowest point of this peak.
* The middle curve, in red, represents P S-H N T. It is offset to a baseline near 2. It shows a similar sharp downward peak starting around 350 degrees Celsius. A label indicates T sub max equals 409 degrees Celsius at the trough.
* The bottom curve, in blue, represents P S-silica. It is offset to a baseline near negative 3.5. It exhibits a broader, shallower downward peak compared to the others. A label indicates T sub max equals 402 degrees Celsius at its lowest point.
A legend in the bottom-left quadrant identifies the black line as P S, the red line as P S-H N T, and the blue line as P S-silica.
Thermoanalytical data for pure PS, PS-SiO2, and PS-HNT

Table 2. Long description
The table consists of eight columns and four rows including the header.
Header Row: Sample, T sub initial (degrees Celsius), T sub max (degrees Celsius), T sub 50 (degrees Celsius), Mass loss at 380 degrees Celsius (percent), Residue at 500 degrees Celsius (percent), D T G peak temperature (degrees Celsius), and Mass loss up to 150 degrees Celsius (percent).
Row 1: P S. T sub initial 350. T sub max 436. T sub 50 402. Mass loss at 380 degrees Celsius 17.50. Residue at 500 degrees Celsius 0.00. D T G peak temperature 407. Mass loss up to 150 degrees Celsius 4.469.
Row 2: P S-S i O sub 2. T sub initial 362. T sub max 443. T sub 50 414. Mass loss at 380 degrees Celsius 11.34. Residue at 500 degrees Celsius 30.24. D T G peak temperature 402. Mass loss up to 150 degrees Celsius 2.241.
Row 3: P S-H N T. T sub initial 287. T sub max 450. T sub 50 394. Mass loss at 380 degrees Celsius 9.90. Residue at 500 degrees Celsius 19.95. D T G peak temperature 409. Mass loss up to 150 degrees Celsius 3.541.
Neat PS exhibits a single dominant degradation step with rapid mass loss between ~350–450°C (Figs 4 and 5). The extracted parameters confirm this behavior, with T initial = 350°C, T 50 = 402°C, and T max = 436°C (Table 2). Weight loss reaches 17.5% at 380°C and proceeds to essentially complete volatilization by 500°C (0% residue), which is consistent with the expected depolymerization-driven thermal decomposition of PS (Liu et al., Reference Liu, Wang, Zou, Wei and Tong2012).
Effect of microsilica (PS–SiO2): delayed onset and delayed median conversion
Compared with neat PS, PS–SiO2 showed a consistent shift of the degradation profile towards higher temperatures (Figs 4 and 5). The onset of major mass loss was delayed, as reflected by an increase in T initial from 350 to 362°C. In addition, the temperature at 50% weight loss increased from 402 to 414°C (Table 2), demonstrating that microsilica is particularly effective in delaying degradation through the early and mid-conversion regime. This trend is also visible in Fig. 3, where the PS–SiO2 curve remained above the neat PS curve throughout the 350–420°C interval, indicating greater retained mass at a given temperature.
The reduced mass loss at 380°C (11.34% vs 17.5% for PS) further supported improved resistance to weight loss at intermediate temperatures (Table 2). From a mechanistic perspective, this behavior was consistent with the role of particulate silica as a physical barrier phase: micro-sized particles can increase the tortuosity for diffusion of volatile degradation products and locally reduce heat transfer, thereby delaying the progression of the main depolymerization step. Importantly, this explanation does not require the formation of new covalent bonds; rather, it arises from morphology-controlled transport restrictions and microstructural packing. FTIR confirms the presence of silica within the film through the appearance of silica-related Si–O–Si bands (Fig. 3), supporting the suggestion that the observed thermal behavior occurs in a silica-containing composite rather than being an artifact of processing.
At higher temperatures, PS–SiO2 retains the largest non-volatile fraction (30.24% residue at 500°C; Table 2). While a substantial part of this residue is expected to originate from the inorganic silica itself, the persistence of mass beyond the temperature range where neat PS fully volatilizes is still meaningful from an application standpoint because it indicates greater thermal persistence of the composite film under severe heating. In Fig. 5, this is reflected by the higher plateau mass level of PS–SiO2 compared with PS–HNT.
Effect of HNT (PS–HNT): early minor event but highest Tmax and improved mid-temperature stability
PS–HNT displays a more complex response than PS–SiO2 (Fig. 4). The extracted parameters show a lower T initial = 287°C, indicating that a detectable mass-loss event occurs earlier than in neat PS. However, this does not necessarily imply that the PS backbone degrades earlier. Given the hydroxyl-rich surface chemistry of halloysite and its tendency to carry adsorbed species, the early mass loss is more plausibly associated with removal of moisture and/or low-molecular-weight species bound to the filler surface. This interpretation is consistent with FTIR, where PS–HNT uniquely shows –OH-related features (structural O–H bands at ~3693 and ~3621 cm⁻1 and a broader component around ~3446 cm⁻1), which are absent in neat PS and PS–SiO2 (Fig. 4). Thus, the earlier T initial is best treated as a filler-associated pre-event rather than premature polymer scission.
Following this early event, PS–HNT exhibits enhanced resistance to degradation in the intermediate range. The mass loss at 380°C decreases to 9.9%, the lowest among all samples (Table 2), and the maximum degradation temperature shifts to the highest value, T max = 450°C. In other words, despite a lower T initial, the main degradation peak occurs at a higher temperature than both neat PS (436°C) and PS–SiO2 (443°C). This pattern suggests that the nanotubular morphology of HNT may be more effective in delaying the temperature at which the degradation rate is maximal, potentially due to confinement effects and/or more effective obstruction of volatile transport during the rapid depolymerization stage. Compared with spherical particles, high-aspect-ratio fillers can create more tortuous transport pathways and may form a more continuous barrier network at high loading levels, thereby shifting the DTG peak to higher temperatures.
In terms of residue, PS–HNT retains 19.95% at 500°C. As with PS–SiO2, this residue largely reflects the presence of an inorganic phase, but the lower residue fraction relative to PS–SiO₂ is consistent with the lower inorganic plateau observed in Fig. 4.
Silica vs HNT: thermal stability comparison
A direct comparison reveals that the ‘best’ thermal behavior depends on the chosen performance metric. If the target is delaying the onset and the median conversion temperature, microsilica performs better, yielding higher T initial (362°C) and T 50 (414°C) than HNT (T initial 287°C; T 50 394°C). If the target is shifting the maximum degradation rate to higher temperature, HNT is superior, producing the highest T max (450°C). At intermediate temperatures, both fillers reduce weight loss relative to neat PS at 380°C, with PS–HNT showing the lowest mass loss (9.9%), followed by PS–SiO2 (11.34%) (Table 2). Finally, in terms of thermal persistence at high temperature, PS–SiO2 retains the largest residue (30.24%), exceeding PS–HNT (19.95%) and neat PS (0%).
These trends underscore the distinct roles of micro-particulate versus nano-tubular morphologies in highly filled PS films. Microsilica appears to more effectively delay the onset and mid-conversion region (T initial and T 50), consistent with barrier effects arising from dense particulate packing. HNT, in contrast, introduces a filler-associated early mass-loss feature but yields the highest T max, suggesting stronger suppression of the peak degradation stage, probably through tortuosity and confinement effects associated with its tubular architecture.
To better distinguish the thermal decomposition behavior of the samples, the corresponding DTG curves were evaluated further (Fig. 5). Neat PS exhibited a single dominant degradation peak centered at 407°C, corresponding to the main decomposition stage of the polymer backbone. Upon incorporation of HNT, the DTG peak temperature shifted slightly to 409°C, suggesting a modest thermal stabilization effect associated with the presence of the inorganic filler. This behavior may be related to the partial barrier effect of HNT and its influence on restricting the diffusion of volatile degradation products during thermal decomposition. In contrast, the PS–silica composite exhibited a DTG peak temperature of 402°C, indicating that the thermal degradation pathway was affected differently in the presence of microspherical silica particles.
The DTG peak temperatures and low-temperature mass loss values up to 150°C are summarized in Table 2. The calculated mass losses up to 150°C were 4.469%, 3.541%, and 2.241% for neat PS, PS–HNT, and PS–silica, respectively. These differences indicate that the incorporation of inorganic fillers also influences the low-temperature volatilization behavior of the composite films. The relatively higher low-temperature mass loss observed for the PS–HNT composite compared with PS–silica may be associated with the hydroxyl-containing aluminosilicate structure of HNT and the presence of physically adsorbed moisture on the filler surface.
In addition to peak-temperature differences, the DTG curves also revealed variations in the degradation profiles and decomposition rates of the composite systems compared with neat PS. These observations indicate that the incorporation of inorganic fillers alters the thermal decomposition characteristics of PS depending on the filler structure, interfacial organization, and dispersion behavior within the polymer matrix. Overall, the DTG analysis provided complementary insight into the morphology-dependent thermal degradation behavior of the PS composite films.
AFM surface topography and roughness studies
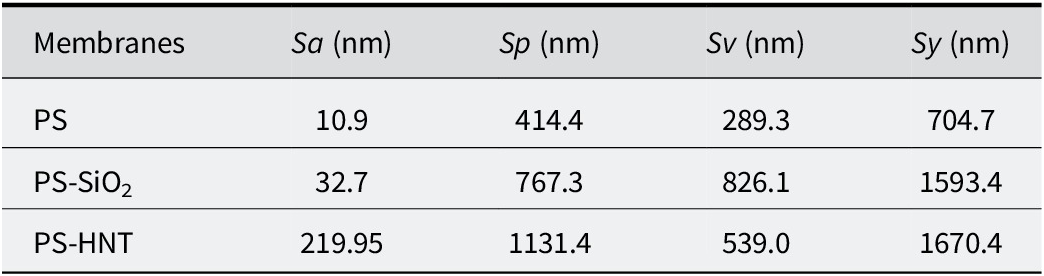
Atomic force microscopy was employed to quantify how filler morphology affects the surface texture of PS and highly filled PS composites. 3D topography maps (Fig. 6) generated using Gwyddion software (https://gwyddion.net/), where each map covers a 50 μm × 50 μm scan area (x–y) and the height information is resolved at the nanometer scale. The corresponding roughness descriptors are summarized in Table 3, including the areal average roughness (Sa), peak roughness (Sp), valley roughness (Sv), and total height range (Sy), which collectively capture both the average texture and the presence of extreme asperities/pits on the surface.
AFM 3D topography images (generated using the Gwyddion program), where each image spans 50 μm on the x- and y-axes, and the z-axis resolution is at the nanometer level.

Surface roughness analyses

Table 3. Long description
The table consists of five columns and four rows. The columns are labeled Membranes, S a (nm), S p (nm), S v (nm), and S y (nm).
Row 1: P S membrane has an S a of 10.9, S p of 414.4, S v of 289.3, and S y of 704.7.
Row 2: P S - S i O sub 2 membrane has an S a of 32.7, S p of 767.3, S v of 826.1, and S y of 1593.4.
Row 3: P S - H N T membrane has an S a of 219.95, S p of 1131.4, S v of 539.0, and S y of 1670.4.
Footnote definitions: S a equals surface area roughness, S p equals peak roughness, S v equals valley roughness, and S y equals total roughness.
Sa = surface area roughness, Sp = peak roughness, Sv = valley roughness, Sy = total roughness.
Neat PS: smooth baseline with limited peak–valley span
Neat PS exhibits the smoothest surface among all samples, with Sa = 10.9 nm (Table 3). The peak and valley metrics remain relatively low compared with the composites (Sp = 414.4 nm, Sv = 289.3 nm), yielding a total height range of Sy = 704.7 nm. The 3D map in Fig. 6 (PS) consists of a mostly flat matrix surface interrupted by sparse, small asperities, representing the baseline topography of the solution-cast film.
PS–silica: moderate increase in areal roughness, but large extremes (deep valleys)
Upon introduction of microspherical silica, the average roughness increases to Sa = 32.7 nm, indicating a moderate increase relative to neat PS (Table 3). Notably, however, the peak–valley descriptors increase substantially: Sp increases to 767.3 nm and Sv to 826.1 nm, leading to a large total height range of Sy = 1593.4 nm. This combination, moderate Sa with much higher Sy, suggests that PS–silica surfaces remain broadly similar to the PS matrix over most of the area yet contain localized extreme features (prominent peaks and/or deep depressions) that expand the peak–valley span significantly. In the 3D map (Fig. 6; PS/SiO2), these extremes are consistent with isolated protrusions and trench-like features, which can arise from particle-rich domains near the surface and/or drying-induced heterogeneities during solvent casting. In other words, silica appears to perturb the surface primarily through localized topographic outliers, rather than a uniformly roughened texture.
PS–HNT: heavily roughened surface dominated by large-amplitude height variations
A markedly different behavior is observed for PS–HNT. The areal roughness increases dramatically to Sa = 219.95 nm, almost an order of magnitude higher than PS–silica and ~20× higher than neat PS (Table 3). The peak roughness is also the highest among all samples (Sp = 1131.4 nm), while the valley roughness increases to Sv = 539.0 nm, resulting in the largest total height range (Sy = 1670.4 nm). The 3D topography in Fig. 6 (PS/HNT) shows pronounced ridge–valley features and macroscopic undulations, consistent with a surface dominated by large-amplitude height variations rather than isolated defects.
To further illustrate this morphology-driven roughening, Fig. 7 provides an additional AFM topography image of PS–HNT acquired over a smaller scan size (17.2 μm × 17.2 μm). Even at this reduced field of view, a highly corrugated landscape persists, indicating that the roughness increases in PS–HNT are not due solely to a few isolated large aggregates but reflect a more pervasive texture across multiple length scales. This behavior is consistent with the high-aspect-ratio tubular geometry of halloysite, which tends to form bundles and anisotropic networks within the polymer matrix. During solvent evaporation, such networks can generate surface-proximal filler-rich regions and aligned ridge-like structures, producing a substantial increase in Sa and Sp.
AFM topography image of PS-HNT composite: image spans 17.2 μm in both the x- and y-directions.

It should be noted that AFM topography provides height contrast rather than chemical identification of the filler phase. Therefore, the AFM images were interpreted together with FTIR evidence. While FTIR spectroscopy confirmed the incorporation of HNT through characteristic hydroxyl and aluminosilicate bands, AFM revealed the topographical consequence of HNT incorporation, namely pronounced surface roughening, ridge–valley morphology, and large-amplitude height variations.
Morphology-based interpretation and implications
The roughness trends depend clearly on filler geometry. The near-spherical microsilica produces only a moderate change in Sa (32.7 nm) but increases Sy substantially through localized extreme features, indicating mostly PS-like surface regions interrupted by deep valleys and peaks. In contrast, HNT yields a strong increase in Sa (219.95 nm) and Sp (1131.4 nm), implying a surface that is uniformly dominated by large-scale undulations and asperities. From a processing perspective, this contrast can be rationalized by differences in dispersion and packing during film formation: spherical microparticles can remain embedded and influence the surface mainly where particle-rich domains intersect the surface, whereas nanotubular fillers produce more readily continuous, anisotropic structures and bundling effects that translate into pronounced ridge–valley topography.
Overall, AFM demonstrates that, at equal high loading (40 wt.%), tubular nano-HNT induces a far more significant surface roughening response than particulate microsilica, highlighting the key role of filler morphology and length scale in controlling surface texture of PS composite films.
Conclusions
The present study compared the influence of two morphologically distinct inorganic fillers, microspherical silica and halloysite nanotubes (HNT), on the chemical signatures, thermal degradation behavior, and surface topography of highly filled PS composite films (40 wt.%). FTIR confirms filler incorporation without new PS chemistry. PS signatures remain in all samples, indicating preservation of the PS backbone. Silica-containing films show silica-network bands (Si–O–Si at ~1108 and ~470 cm⁻1, plus a silica-related contribution near ~970 cm⁻1), while HNT-containing films show halloysite-specific hydroxyl/aluminosilicate features (structural O–H at ~3693 and ~3621 cm⁻1, broad O–H near ~3446 cm⁻1, and framework-related bands near ~1030 and ~908 cm⁻1). Overall, FTIR supports physical incorporation rather than covalent PS–filler bonding. Microsilica improves early-to-mid thermal stability most strongly (T initial, T 50). Relative to neat PS (T initial = 350°C, T 50 = 402°C), PS–SiO2 increases T initial to 362°C and T 50 to 414°C and reduces mass loss at 380°C to 11.34%. The residue at 500°C is greatest (30.24%), consistent with strong inorganic persistence and a particulate barrier effect. HNT shifts the peak degradation to the highest temperature (T max) but introduces an earlier minor mass-loss event. PS–HNT shows T initial = 287°C, while T max increases to 450°C (highest among all samples). It also exhibits the lowest mass loss at 380°C (9.9%) and retains 19.95% residue at 500°C. In addition, DTG analysis revealed morphology-dependent differences in the degradation profiles and peak degradation temperatures of the composite systems. The earlier onset is consistent with HNT’s hydroxyl-rich/moisture-adsorbing character (supported by FTIR), whereas the higher T max suggests morphology-driven transport restriction/confinement effects during the main degradation stage. AFM shows a strong morphology-driven divergence in surface texture. Neat PS is smooth (Sa = 10.9 nm). PS–SiO2 remains relatively close in average roughness (Sa = 32.7 nm) but displays large peak–valley span (Sy = 1593.4 nm), indicating localized extreme features. PS–HNT shows a pronounced, pervasive roughening (Sa = 219.95 nm; Sy = 1670.4 nm), consistent with ridge–valley topographies observed across both 50 μm and 17.2 μm scan areas. Overall, the ranking depends on the selected performance metric: microsilica performs better in delaying degradation onset and increasing T 50, whereas HNT is more effective in raising T max (i.e. delaying the maximum-rate degradation stage). In terms of surface texture, microsilica yields a more PS-like, smoother surface (lower Sa), while HNT induces a pronounced increase in roughness. At equal high loading (40 wt.%), the silica vs HNT contrast is governed primarily by morphology and interfacial/dispersion behavior (particulate barrier effects vs nanotubular structuring/transport restriction), not by formation of new chemical bonding within the PS matrix.
Data availability statement
The data supporting the findings of this study are available from the corresponding author upon reasonable request.
Author contributions
Burcu Dilaver: Writing – original draft, Formal analysis, Investigation; Ayse Cagil Kandemir: Writing – review and editing, Formal analysis, Conceptualization, Visualization, Investigation; Asli Numanoglu Genc: Writing – review and editing, Formal analysis, Conceptualization; Hatice Kaplan Can: Writing – review and editing, Visualization, Investigation, Formal analysis, Conceptualization.
Financial support
The authors gratefully acknowledge the financial support provided by the Scientific and Technological Research Council of Türkiye (TUBITAK) under grant number 122M480.
Competing interests
The authors declare that they have no known competing financial interests or personal relationships that could have appeared to influence the work reported in this paper.