1. INTRODUCTION
Calculations involving global position, i.e. position relative to the Earth, are central in many fields, such as navigation, radar/sonar calculations, geodesy, and vehicle guidance and control. In these calculations, the position can be represented by different mathematical quantities, each with its own properties. There are several well-known representations for global position, such as latitude/longitude, UTM (Universal Transverse Mercator (Snyder, Reference Snyder1987)), and Cartesian 3D vector (Earth-Centred-Earth Fixed). These position representations will be discussed in Section 3, focusing on their limitations, and how their properties may induce significant errors in common calculations. Many of the problems and limitations of these alternatives are avoided if using the normal vector to the Earth ellipsoid (called n-vector) to represent the position. Although this representation has been briefly mentioned in some texts (e.g. Aeronautical Systems Div Wright-Patterson AFB OH, 1986) a thorough presentation of this alternative, including comparisons with the more well known representations is not found in the literature. This paper will present the n-vector alternative by first discussing the geometrical properties of n-vector in Section 4. Section 5 presents various n-vector calculations, illustrating the fact that calculations involving n-vector are in general remarkably simple. To simplify implementation further, two functions are presented, which turn out to cover a majority of practical position calculations. In Section 6, several examples comparing the use of latitude/longitude with n-vector for specific calculations are studied. The practical usefulness of n-vector in real-life applications is the topic of Section 7, where the experience is that research groups prefer using n-vector in many of their position calculations after becoming familiar with it.
2. NOTATION
A unified and stringent notation is of utmost importance when describing the kinematics of multiple rotating systems, and a full notation system with definitions of the central quantities has been developed by the author (to be published). A short, simplified extract from this system, with only the symbols relevant in this paper, is given below.
2.1. Coordinate frame
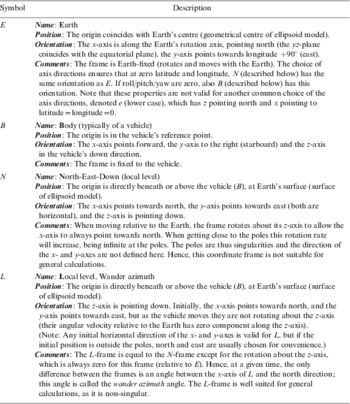
A coordinate frame is defined as a combination of a point (origin), representing position, and a set of basis vectors, representing orientation. Thus, a coordinate frame has 6 degrees of freedom and can be used to represent the position and orientation of a rigid body. A listing of the specific coordinate frames relevant in this paper is found in Appendix A.
2.2. General notation
A general vector can be represented in two different ways (McGill and King, Reference McGill and King1995), (Britting, Reference Britting1971):
•
 (Lower case letter with arrow): Coordinate free/geometrical vector (not decomposed in any coordinate frame)
• xA (Bold lower case letter with right superscript): Vector decomposed/represented in a specific frame (column matrix with three scalars)
 (Lower case letter with arrow): Coordinate free/geometrical vector (not decomposed in any coordinate frame)
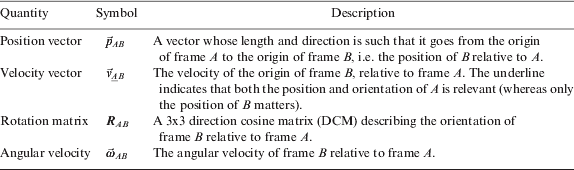
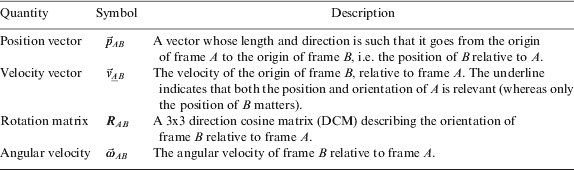
The physical world to be described by the kinematics is modelled in terms of coordinate frames. Hence, quantities such as position, angular velocity, etc. relate one coordinate frame to another. To make a quantity unique, the two frames in question are given as right subscript, as shown in Table 1. Note that in most examples in Table 1, only the position or the orientation of the frame is relevant, and the context should make it clear which of the two properties is relevant (for instance, only the orientation of a frame written as right superscript is relevant, since it denotes the frame of decomposition, where only the direction of the basis vectors matters). If both the position and the orientation of the frame are relevant, the frame is underlined to emphasize that fact. For generality, the vectors in Table 1 are written in coordinate free form, but before implementation in a computer, they must be decomposed in a selected frame (e.g. ωABC is the angular velocity  decomposed in frame C).
Symbols used to describe basic relations between two coordinate frames.
3. STANDARD POSITION REPRESENTATIONS
Before introducing n-vector, the standard position representations are discussed as a background for comparison.
3.1. Cartesian 3D vector
When representing the position of a general coordinate frame B relative to a reference coordinate frame A, the most intuitive quantity to use is the position vector from A to B, decomposed in A, pABA. This paper focuses on global positioning, and using the frames defined in Appendix A, we can represent the position of a body frame (B) relative to the Earth (E), by using pEBE. This (Cartesian) vector is often referred to as Earth Centred Earth Fixed (ECEF) vector. While this representation is non-singular and intuitive, there are many situations where other representations are more practical when positioning an object relative to the Earth reference ellipsoid.
3.2. Separating horizontal and vertical components
For many position calculations, it is desirable and most intuitive to treat horizontal and vertical positions independently. This is for instance useful in a navigation system, where horizontal and vertical position are usually measured by different sensors at different points in time, or in a vehicle autopilot, where horizontal and vertical position are often controlled independently. In such applications, we usually compare two horizontal positions, and thus we need a quantity for representing horizontal position independently of the vertical height/depth. It should thus be possible to represent horizontal position without considering the vertical position, and vice versa. If the vector pEBE is used, the horizontal and vertical positions are not separated as desired.
3.2.1. Latitude and longitude
A common solution for obtaining separate horizontal and vertical positions is the use of latitude, longitude and height/depth (related to a reference ellipsoid, discussed in Section 4.1). However, this representation has a severe limitation; the two singularities at latitudes ±90°, where longitude is undefined. In addition, when getting close to the singularities, the representation exhibits considerable non-linearities and extreme latitude dependency, leading to reduced accuracy in many algorithms, as exemplified in Section 6. Thus, these coordinates are not suitable for algorithms that should be able to calculate positions far north or far south. In addition, calculations near ±180° longitude become complicated due to the discontinuity.
3.2.2. Local Cartesian coordinate frame (flat Earth assumption)
Another common solution for separating the horizontal and vertical components is to introduce a local Earth-fixed Cartesian coordinate frame, with two axes forming a horizontal tangent plane to the reference ellipsoid at a specified tangent point. Assuming several calculations are needed in a limited area, position calculations can be performed relative to this system to get approximate horizontal and vertical components. This coordinate frame is not used as a global position representation (since the local origin (tangent point) must still be represented relative to the Earth), but is rather a way to get horizontal and vertical directions in the local position calculations.
However, the local Cartesian representation corresponds to a local flat Earth assumption and does not give exact horizontal and vertical directions for positions that are not directly above or below the tangent point. The further away from the tangent point the calculations are done, the greater the error in the horizontal and vertical directions. In an application with e.g. moving vehicles, the system typically has to be repositioned regularly in order to minimize these errors.
Finally, most local Cartesian frames are aligned with the north/east directions at the tangent point, and are often treated as a linearization of the meridians and parallels. However, when getting close to the poles the linearization is sufficiently accurate only for a very small area. Here, an error in the assumed position can give errors in the assumed north/east directions as well. At the pole points the north and east directions are undefined. Thus, calculations operating with a north/east aligned coordinate frame can generate significant errors in the polar regions.
3.2.3. UTM and UPS
Horizontal position can also be represented by defining an Earth fixed coordinate system based on a map projection (i.e., a mapping of points on a curved surface to a plane) valid in a limited geographical area. One such system is Universal Transverse Mercator (UTM), specifying 60 longitude zones, covering the globe except for the polar regions (Snyder, Reference Snyder1987). For the polar regions, a similar system, Universal Polar Stereographic (UPS), defines horizontal positions (Hager et al., Reference Hager, Behensky and Drew1989). While these systems are well-defined and the coordinate values approximately correspond to metres, they have an inherent distortion due to the projection and thus a corresponding error in many calculations (e.g. a difference vector between two UTM coordinates will give a length (in metres) and direction (relative to north) that both have errors compared to the true values). In addition, general calculations get very complex when crossing zones (Hager et al., Reference Hager, Behensky and Drew1989).
3.2.4. Rotation matrix
In a set of navigation equations, integrating measurements from an inertial measurement unit, horizontal position is often stored together with an azimuth angle in a rotation matrix (Savage, Reference Savage2000). Although it has nice properties with respect to the pole singularities (similar to n-vector), this matrix representation is not suited for pure horizontal position representation. More about this alternative is found in Section 5.5.
4. n-VECTOR
We will seek an alternative for representing horizontal position. The vertical position representation (height/depth from the reference ellipsoid) is very convenient and will still be used. It should be noted that the terms horizontal and vertical directions implicitly introduce a reference surface, and the terms are valid for a given point at the surface. The horizontal direction is given by the surface tangent plane (2D) and the vertical direction is the normal to the surface (1D). Thus, the task of finding a non-singular representation of horizontal position can in general be viewed as finding a suitable representation of 2D position on a surface.
We define a surface as associated with a coordinate frame, if the surface is fixed relative to the coordinate frame. We also define a surface as strictly convex if it is or can be extended to a closed surface whose enclosed volume is strictly convex. Realising that the 2D position on a strictly convex surface can be uniquely represented by the normal vector to the surface, leads to the idea of using this vector as a position representation.
• Definition of n-vector:
A strictly convex and differentiable surface is associated with coordinate frame A. A coordinate frame B is located at the surface. The n-vector representation of the position of B relative to A is defined as the outward pointing normal vector of the surface at the B-position, with unit length. The n-vector is denoted as
.
 .
The surface might consist of several patches/pieces, as long as they can be extended to a closed surface with a strictly convex interior. Since the surface is differentiable, the boundary of each piece is not part of the surface (the edges are open). In the definition above, B is at the surface since n-vector is a representation of horizontal position only. How to use the n-vector for 3D positions is discussed in Section 4.3.
4.1. Reference ellipsoid
Note that the alternatives for global positioning discussed in Section 3 are defined relative to a reference ellipsoid, e.g. WGS-84 (National Imagery and Mapping Agency, 2000). When using n-vector to represent global position (i.e. position relative to the Earth frame, E), it must also relate to a reference ellipsoid. The reference ellipsoid is a surface that is both strictly convex and differentiable, and for n-vector this ellipsoid is the surface associated with E. The vehicle/object to be positioned is typically denoted B (Body), and thus the n-vector for global positioning is denoted  . Hence,
 conveniently represents horizontal position at the Earth surface without singularities.
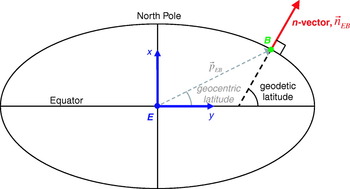
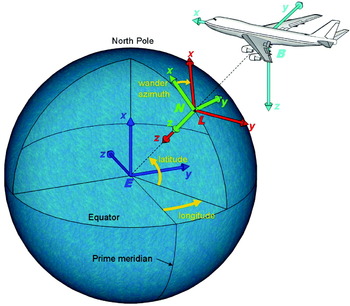
Figure 1 shows n-vector as the normal to the reference ellipsoid surface. Note also, as shown, that n-vector corresponds to geodetic latitude (Snyder, Reference Snyder1987). Geodetic latitude is the latitude most commonly used, and when using the term latitude in the rest of this document, this always means geodetic latitude.
Earth reference ellipsoid with n-vector, geodetic and geocentric latitude. Two axes and the origin of the E-frame (blue) and the origin of the B-frame (green) are also shown.

4.2. One-to-one property
n-vector is a one-to-one representation, i.e. any normal vector corresponds to one unique surface position, and any surface position corresponds to one unique n-vector. This one-to-one property is not held by various other representations, such as latitude/longitude (many-to-one), roll/pitch/yaw (many-to-one) or quaternions (Zipfel, Reference Zipfel2000) (two-to-one).
• Note 1. If the surface is closed, any unit vector will be a valid n-vector, and thus it will correspond to one unique position.
• Note 2. The one-to-one property of n-vector is due to the strict convexness and differentiability of the associated surface:
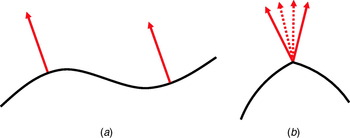
(a) If the surface had not been strictly convex, n-vector would be one-to-many. (In addition, the lack of strict convexness means that the term ‘outward pointing’ is not defined all over the surface, and in general n-vector cannot be uniquely defined for such surfaces.)
(b) If the surface had not been differentiable, n-vector would be many-to-one.
The two cases are illustrated in Figure 2.
a. The surface is differentiable, but not strictly convex: One n-vector corresponds to many positions. b. The surface is strictly convex, but not differentiable: Many n-vectors correspond to one position.

4.3. 3D positions
So far, n-vector has been used to represent a position on the reference surface, but in the same manner as for latitude/longitude, a 3D position can be represented by adding a height/depth parameter (above/below the nearest part of the reference ellipsoid surface). Mathematically, this is a very convenient combination since the n-vector defines the exact direction in space where the height/depth is valid (e.g., if we need the vector from the ellipsoid surface to a given 3D position, it is simply found as the product of n-vector and the height). When B is not at the surface, the B in  represents the horizontal position of B. As mentioned in Section 3.2, it is usually most convenient with separate horizontal and vertical position representations. However, this is not the case if working with positions nearFootnote 1 the Earth's centre, since the horizontal and vertical directions are not defined there.
5. n-VECTOR CALCULATIONS
We have seen that from a geometrical point of view  works very well as a representation of horizontal position. The overall usefulness also depends on how easy it is to work with n-vector in practical calculations. In most practical calculations, n-vector is decomposed in the E-frame, i.e. nEBE. If, for example, we want to represent the South Pole, we see from the definition of the E-frame in Appendix A that
 . It should also be noted that n-vector has approximately the same direction as the position vector pEBE (see Figure 1 where the ellipticity is exaggerated). If assuming spherical Earth, the directions are equal, i.e.

where | | denotes the vector length (vector 2-norm).
Note that for all equations in this paper that are valid only for spherical Earth, this is stated directly before the equation. All other equations in this paper are valid for both ellipsoidal and spherical Earth.
5.1. Simplified notation
For the general quantities in Table 1 there are many possible frames (such as the position of a sensor relative to a vehicle), but for global position, the frames are often E and B. If all positioning is relative to Earth (E) and only one object is positioned, the subscript is redundant and can be omitted, so we can simply use nE. This is similar to situations where it is sufficient to use only the variables latitude and longitude (without further specification).
5.2. Converting to or from latitude and longitude
The relations between latitude/longitude and n-vector are found in this section. Note that the relations are valid for any reference ellipsoid or sphere.
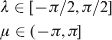
Mathematically, the longitude and latitude are the first two angles of a x-y-z Euler angle representation of the orientation of a local level frame (such as N or L, see Appendix A) relative to E. The latitude (λ) and longitude (μ) have the following dynamical intervals:
5.2.1. From latitude and longitude to n-vector
By observing simple geometry, we get the following relation:
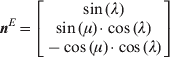
This equation has no singularities, i.e., one can always calculate a unique n-vector from a set of latitude and longitude. At the poles (λ=±π/2), a zero factor, cos(λ), in both the y and z components makes the actual value of the (undefined) longitude irrelevant. It is also clear from (3) how the discontinuity of longitude at ±π is eliminated when using n-vector, since both cos( ) and sin( ) are continuous for an angle going through this value. Note that the order and signs of the vector elements in (3) obviously depend on the choice of E-frame axes, see Appendix A.
5.2.2. From n-vector to latitude and longitude
From the geometry, we get the following relations:

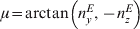
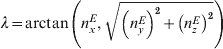
where arctan(b,a) is the four quadrant version of arctan(b/a). The x, y and z subscripts indicate the three components of n-vector. The longitude singularity at the poles is apparent in the arctan( ) expression, which is undefined for the input (0,0) (however, in practical programming languages, a default output is usually returned also in this case, making it possible to convert back to n-vector with (3) also at the poles).
• Implementation considerations. Equation (4) is not recommend for implementation, since the arcsin( ) function is numerically inaccurate near the polesFootnote 2 and also will return imaginary results if the input should be outside ±1 due to numerical inaccuracy. An equivalent alternative that is robust against numerical errors is given in (6).
(6)Note that the four quadrant arctan( , ) is used even when we know that latitude is limited to two of the quadrants (see (2)) to avoid division by zero at the poles. Because the second parameter is non-negative, this function will always return answers in the correct quadrants.
5.2.3. Quaternion comparison
Orientation (three degrees of freedom) is often represented by three Euler angles or three other parameters (Craig, Reference Craig1989). However, all three-parameter orientation representations have singularities (Stuelplnagel, 1964), and by using 4-parameter quaternions (Zipfel, Reference Zipfel2000), the singularities are avoided. The quaternion has a restriction of unit length to ensure it only has three degrees of freedom.
Similarly, a surface position has two degrees of freedom, and can be represented by two parameters with singularities, such as latitude and longitude. n-vector adds a third parameter to avoid the singularities, and also has a restriction of unit length. Converting between Euler angles and quaternions yields equations similar to (3), (4), and (5), i.e. the quaternion is found by products of sin( ) and cos( ), and the reverse equations consist of arctan( ) and arcsin( ) functions.
5.3. n-vector relations
This section includes several useful calculations involving n-vector, illustrating its properties.
5.3.1. Horizontal and vertical parts of an arbitrary vector
Using n-vector, it is easy to find the vertical and horizontal parts of an arbitrary vector kE,

The horizontal part is found by subtracting the vertical part,

5.3.2. North and east directions
Outside the poles, the (horizontal) directions of north and east are often of interest. The east direction (normal to the meridian plane) is simply given by
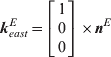
Similarly, the north direction (normal to the transverse planeFootnote 3) is given by
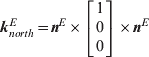
Since the triple cross product is associative when the first and last vectors are equal, no parentheses are needed to specify the order of operation.
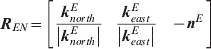
The rotation matrix relating the N and E frames is useful in many calculations, and is found from (9) and (10),
5.3.3. Angular velocity of local frame
The angular velocity of a local frame L (see Appendix A) relative to E, ωELE, is a useful quantity, for instance in a navigation system. From the linear velocity of B relative to E, vE BE, and the meridian and transverse radius of curvature at the current height (r roc,meridian, r roc,transverse), this angular velocity is given by

Equation (12) is valid for an ellipsoidal Earth model, while for a spherical model, the relation is simply
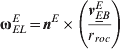
where r roc is the radius of curvature, i.e. Earth radius+height.
5.3.4. Derivative of n-vector and height/depth
The angular velocity found in (12) or (13) can be used directly to describe the derivative (with respect to time) of n-vector (also for elliptical Earth),

The vertical part of the angular velocity vector does not affect the update of n-vector, and hence the angular velocity of any local level coordinate frame could be used in (14), for instance of N (i.e. ωENE). The derivative of n-vector is useful for instance when integrating velocity to get position as n-vector (as will be done in Section 6.5).
If integrating to get 3D position, an update of the height/depth would also be needed. Updating height (h) is simple when knowing n-vector,

5.3.5. Surface distance
If assuming spherical Earth, the surface distance (length of geodesic) between two positions (given by nEAE and nEBE), is easy to find by utilizing the properties of the dot and cross products,
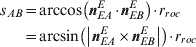
where s AB is the surface distance between A and B. For implementation, note that the arccos( ) expression is ill-conditioned for small angles, and the arcsin( ) expression is ill-conditioned for angles near π/2 (and not valid above π/2). Full numerical accuracy for all angles is achieved by combining the two expressions into an arctan( , ) expression as before (see Section 5.2.2.).
5.3.6. Horizontal geographical mean
if m horizontal positions are given as n-vectors, the geographical mean, B GM, is simply given by (assuming spherical Earth)
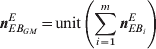
where  is the i'th position, and ‘unit( )’ makes the input vector's length/magnitude equal to one. Equation (17) gives the exact answer for any set of global positions (except in the case where the horizontal mean is undefined, i.e. for a set of antipodal positions, cancelling each other).
5.4. n-vector and Cartesian position vectors
In many practical calculations, there is a need to combine global position with position differences given as Cartesian vectors (typically relative positions within a limited area). If assuming spherical Earth, the relations are simple when using n-vector. For elliptical Earth, exact calculations have almost the same complexity as (geodetic) latitude and longitude, since n-vector is also a geodetic quantity. However, such calculations can be easily handled in practice by using two general functions:
(1) ‘A and B→delta position’: Two global positions A and B are given as n-vectors (nEAE and nEBE) with heights. The function calculates the position vector from A to B, pABE.
(2) ‘A and delta position→B’: One global position is given as nEAE with height, and a position vector to the point B is given (pABE). The function calculates nEBE with height.
The implementation of the functions is described in Appendix B. It turns out that most calculations involving global position and local position vectors can easily be solved using these two functions (e.g. calculations involving bearing/elevation/range from a sonar/radar or when an estimated error or a lever-arm should be subtracted from a global position).
5.5. Using the orientation of a local coordinate frame to represent position
In (11) we saw that REN has minus n-vector as the last column, and thus this matrix contains horizontal position information. If replacing the singular N-frame with a non-singular L-frame (given in Appendix A), REL will be a non-singular position representation (also with minus n-vector as last column). REL is the matrix mentioned in Section 3.2.4., and since this matrix is often of interest in an inertial navigation system, it is also used for horizontal position representation (Savage, Reference Savage2000). It has the same qualities as n-vector with respect to the pole singularities, but as a rotation matrix, it has six extra elements with one extra degree of freedom (the wander azimuth angle described in Appendix A) that for most position calculations are not relevant.
6. COMPARING LATITUDE/LONGITUDE AND n-VECTOR
The latitude and longitude angles are Euler angles (see Section 5.2.) and they have singularities just like any set of three Euler angles representing orientation. For orientation, if calculations near or at the singular points might be relevant, the Euler angles are usually replaced with a quaternion or a rotation matrix, see for example (Fortescue et al., Reference Fortescue, Stark and Swinerd2003), (Levine, Reference Levine2000), (Phillips, Reference Phillips2004), or (Obaidat and Papadimitriou, Reference Obaidat and Papadimitriou2003). The replacement is in these references motivated by the common knowledge that singularities give problems, and they do not study what would actually happen if trying to perform calculations using a singular representation near or at a singular point. In the following, we will demonstrate some of these problems by looking at some examples where we use latitude and longitude near or at a pole. Other important reasons for using n-vector, which are also important far away from the poles, are the ease of use, and the exact results obtained. Some examples will focus on these properties as well.
6.1. Example 1, relative position
A common calculation is to convert positions given by latitude/longitude (located within a limited area), to relative positions in a local metric grid, often with north and east axes (e.g. when an estimated position is compared with a measured position). In practice, such calculations often involve the equations
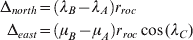
for two positions A and B, where λC typically is one of the involved latitudes, or an average.
We immediately see that the discontinuity of longitude at ±180° can lead to large errors in (18) (but this problem can be handled by adding specific code). Problems that are more serious would appear if trying to use (18) near one of the poles. If the two latitudes were at opposite sides of a pole, the north distance would be wrong. Near a pole, the east distance in (18) will be along a clearly curved line and it will also depend heavily on the latitude used. If one of the positions is at the pole, the longitude is undefined and calculating delta east is problematic. In fact, when near a pole, the north and east directions will vary considerably even within a limited area, and at the polar point, the directions are undefined.
With n-vector, the vector difference is decomposed in E, with no problems for any positions. It is found by a simple vector difference multiplied with r roc for spherical Earth, or by the function in Section 5.4 for ellipsoidal Earth. If the delta north and east components are desired (away from the poles), the difference vector is simply multiplied with (11).
6.2. Example 2, surface distance
A typical calculation for many applications is to find the surface distance (length of geodesic) between two horizontal positions. Even if assuming spherical Earth, calculating the great circle distance between two positions requires several steps to find exactly from latitudes and longitudes (an approximation is often found by square summing the deltas in (18)). The resulting expression found in many books, such as (Longley et al., Reference Longley, Goodchild, Maguire and Rhind2005), (Weisstein, Reference Weisstein2003) and (Hofmann-Wellenhof et al., Reference Hofmann-Wellenhof, Wieser and Lega2003) gives the result as an arccos expression, see first part of (19). However, as discussed in Section 5.2.2 an implementation finding an angle from arccos will give numerical problems for small angles. In (Sinnott, Reference Sinnott1984) an arcsin expression accurate for small angles is found (assuming spherical Earth). The two expressions for surface distance, s AB, are

If using n-vector rather than latitude/longitude, we saw from (16) that it is easy to find the (non-singular) n-vector versions of both the arccos and arcsin expressions in (19).
6.3. Example 3, horizontal geographical mean
In several applications, it is interesting to find the geographical mean of multiple horizontal positions. If the positions are given as latitudes/longitudes, even when assuming spherical Earth, taking the arithmetical mean will give an answer that is only approximately correct for a small area, away from the poles and the ±180°-line. Finding the exact answer is complicated when using latitudes and longitudes. On the other hand, if the positions are given as n-vectors, the geographical mean is simply given by (17).
6.4. Example 4, interpolated position
A variant of the above example is the calculation of an interpolated position. Using the standard formula for linear interpolation on the latitude/longitude coordinates will not give positions that are at the shortest path (geodesic) between the two original positions. Errors will increase near the poles and at larger distances. In addition, positions at each side of μ=±180° will give wrong answers. With n-vector, the standard formula for interpolation gives the correct result for all positions.
6.5. Example 5, integrating velocity
In several applications, such as dead-reckoning systems and simulators, the velocity of a vehicle/object is typically integrated to give global position. We shall investigate the error build-up in the integration process when using latitude/longitude or n-vector as the position representation.
The velocity vector to be integrated is  , and when the vehicle position is represented by latitude/longitude, it is updated using north and east velocity. These are achieved by decomposing the velocity vector in the N frame, i.e. vE BN, and the derivatives of latitude and longitude can be found by (assuming spherical Earth)
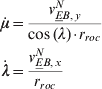
We assume correct initial position and velocity input, and thus we only study the errors arising from the integration process itself.
6.5.1. Part 1 – Demonstrating the error effects
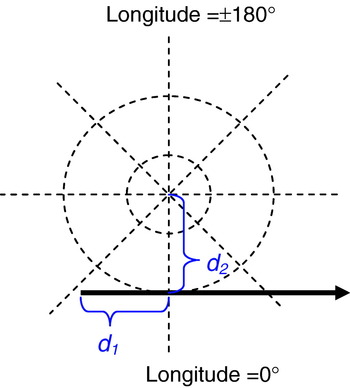
To visualise the error effects appearing when integrating latitude/longitude close to a pole, we will use an example where much error arises during few time steps. A ship such as an LCC (large crude carrier) has low dynamics, and we assume that 1 Hz forward or backward Euler integration is sufficiently accurate to integrate its position. We use spherical Earth model in this example and first assume that the ship follows a great circle with a speed of 7·5 m/s and zero height. It passes the North Pole with a minimum distance of 10 metres, as illustrated with d 2 in Figure 3, and we will look at a 50 seconds interval, where there are 20 seconds (corresponding to d 1) before passing at the closest distance.
View from directly above the North Pole. The trajectory (passing the pole at d 2 metres distance) is shown in solid (with an arrowhead showing the direction). Dotted straight lines: constant longitudes. Dotted circles: constant latitudes.

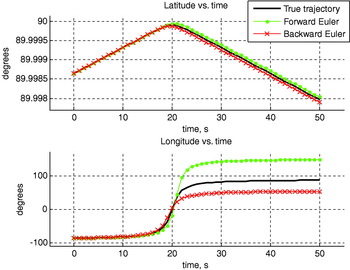
To investigate the drift in an algorithm, a true trajectory is needed as a reference. With spherical Earth and no vehicle turning, it is easy to calculate the true trajectory analytically i.e. to directly calculate an exact true position and velocity for any point in time (we use the fact that seen from the E frame, the trajectory follows a great circle (geodesic) that is tilted relative to the meridians). The true trajectory is shown together with the results from the Euler algorithms in Figure 4.
Latitude and longitude versus time. The true longitude and latitude are calculated directly from an exact function.

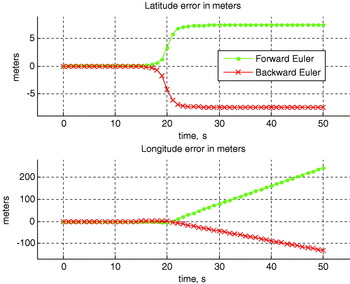
Looking at the upper part of Figure 4, we see that the Euler algorithms follow the true latitude relatively well until the pole passing. Due to the high curvature in latitude during the pole passing, the algorithms get an error of about ±7·5 metres as shown in Figure 5 (which shows the errors converted to metres).
Error from the forward and backward Euler methods when using the latitude and longitude representation (calculated trajectory minus true trajectory).

For longitude (Figure 4, lower part), the Euler algorithms also get problems when the graph starts curving, but far more serious is the error from the latitude dependency, see (20). The too large value in the forward Euler latitude in the last half of the pole passing causes the longitude to be increased far too much based on the velocity in (20). The opposite is true for the backward Euler method. Another weakness of the latitude/longitude representation is the high rate of change of longitude when close to the pole. A longitudinal error of only 0·01 metres at the closest point in the example corresponds to an error of about 6400 metres at the equator. Thus, small insignificant position errors generated close to the poles are magnified by many orders of magnitude when moving away from the pole. In the above example, the errors that arose during the pole-passing are magnified as shown in part 2 of Figure 5. Even without these effects, small errors in the initial position, in the velocity or in the timing (such errors are not included in the example), would be scaled to significant levels when increasing the distance from the pole.
6.5.1.1. Higher order integration method
Looking at the errors from forward or backward Euler, it is tempting to try a second order integration method like the trapezoid method. As expected, this reduces the error significantly (down to 56 metres/14° in longitude), but the error is probably still too large for most applications. Using a higher rate than 1 Hz also improves the result (as studied in Section 6.5.2) but for any rate, we could pass the pole at a shorter distance, and the error would again be unacceptable. This illustrates that the fundamental problem is the singularity of the latitude/longitude representation, and as we will see in the next section, replacing latitude/longitude with the non-singular n-vector is a far better solution than using a more complex integration method or a higher rate.
6.5.1.2. Calculating position using n-vector
Updating n-vector is done using the velocity decomposed in the E-frame, vEBE. Note that this is a more realistic and better suited velocity input than vEBN. vE BE can be obtained by measuring Doppler shift from GPS or from underwater transponders with known position. While vE BE has no error due to own position error, vE BN is decomposed in the north and east directions, and in the polar regions these directions themselves will have errors given directly by the error in our assumed position. Combining (13) and (14) we find that the derivative of n-vector is calculated by (assuming spherical Earth)
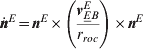
Note that even if the full 3D vector vE BE is used, only the horizontal component will contribute due to the cross product with nE.
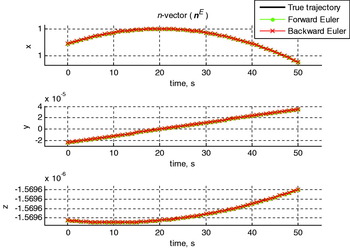
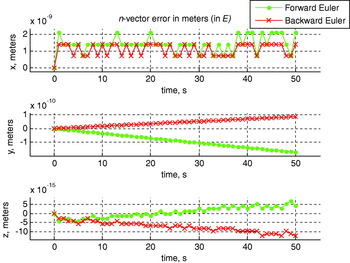
Using the derivative as input, updating n-vector with the forward and backward Euler methods gives the result shown in Figure 6. The difference from the true trajectory is too small to be visible in this figure, but as we did for latitude and longitude, we can calculate the error in metres, shown in Figure 7. This is done using the calculated and true n-vector in (16) or by multiplying the difference vector with r roc, which gives the same result for small angles. By comparing with Figure 5, we see that replacing latitude and longitude with n-vector has reduced the accumulated error from ca. 228 metres (great circle error, found by using (3) and (16)) to only 2·1×10−9 metres (both numbers are the largest error from either the forward or backward Euler method). The latter is at the level of errors from the computer's numerical precision used in the test, i.e. IEEE 754 double precision, which near the surface of the Earth gives a precision of r roc/252 ≈ 1·4×10−9 metres.
The components of n-vector versus time. The true n-vector is calculated directly from an exact function. (The errors of the Euler methods are too small to be visible in this plot.)

Error from the forward and backward Euler methods when using the n-vector representation.

6.5.2. Part 2 – Sensitivity analysis
The trajectory used in Part 1 was practically straight (only curving due to the Earth's curvature), and thus errors arising in the Euler methods when the vehicle is turning were not included. The LCC in the example typically makes a heading change at 0·3°/s, and a 60° turn (simplified to follow a circle segment) will generate an error of ±3·75 metres for 2D Cartesian coordinates with the 1 Hz Euler methods. The error is not dependent on the turning rate, but on the speed and the net number of degrees turned.
We will now expand the scenario to start 10 minutes before the Pole passing (corresponding to d 1 in Figure 3), include two 30° starboard turns and last for 1 hour, where the turns start at 15 and 30 minutes. The distance to the Pole (d 2 in Figure 3) will be varied, and we will look at the final error as a function of this distance. The results from similar straight trajectories (i.e. no vehicle turning) are also included for comparison. For the straight trajectories, the true trajectory is found analytically as in Part 1, while for the curved trajectories the truth is found using NavLab (Gade, Reference Gade2004) running at 100 Hz (NavLab uses the trapezoid method and has no pole singularities).
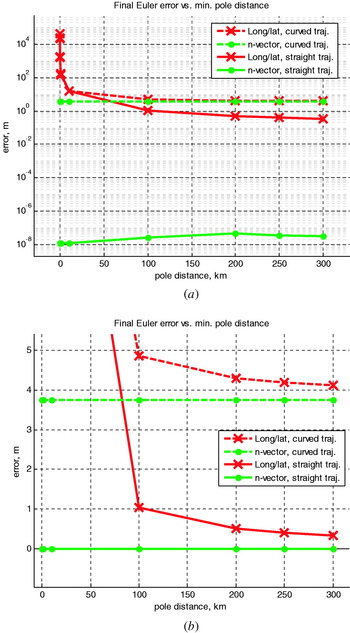
Figure 8 shows the result, and for the curved trajectory, the error in latitude/longitude is 4·1 metres when passing the Pole at 300 km distance, while passing at 5 metres distance gives an error of about 42 km. For n-vector, the only visible error is the expected 3·75 metres arising from the turning, independent of the distance to the Pole. For the straight trajectory, we get similar results, but the error of 3·75 metres from the turning is removed (and the small changes in n-vector error visible in Figure 8a is because the computer's numerical precision gives different error accumulation at different locations).
Final error in the Euler methods (the method with the largest error is plotted) at different distances to the pole (d 2). In part a, the magnitude of the spike is compressed by using a logarithmic scale at the y-axis. Part b is zoomed in without including the large spike and has a linear y-axis.

A common rule of thumb when considering error sources is to ignore an error source if it is below 10% of a known error. To reduce the extra error generated from the use of the latitude/longitude representation to this level, compared to the error from the turning, requires a distance of about 250 km from the pole in this example. Note that in a practical application, there will be other error sources, other integration periods and other dynamics, and thus the distance where the extra error from the latitude/longitude representation could be neglected will vary from application to application.
6.5.2.1. Sensitivity of integration period
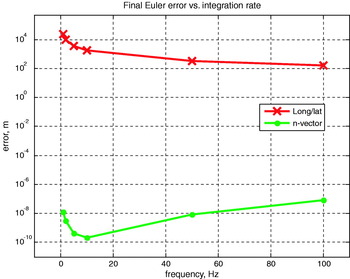
We could also do a sensitivity analysis by reducing the integration period to see if this would give acceptable performance for the 10 metres Pole distance scenario. To be able to use the analytical true trajectory, the straight trajectory from above is used. The result is shown in Figure 9 where increasing the rate to 100 Hz reduces the latitude/longitude error to 170 metres. For n-vector, the higher rate first reduces the error in a similar manner, but for very high rates, the total number of iterations is considerably increased, and thus the accumulation of round-off errors increases the total error.
Final error in forward or backward Euler (the one with largest error is plotted) at different integration rates for straight trajectory, with a minimum pole distance (d 2) of 10 metres. The y-axis is logarithmic.

6.5.3. Conclusion
Integrating position using latitude and longitude can give unacceptably large errors when close to a Pole, particularly due to the coupling of error from latitude to longitude. In the given example, a distance in the order of 100 km from the Pole was needed to be able to safely neglect this additional error source. By using n-vector instead, no additional error is introduced (the error here was determined by the actual curvature of the trajectory or by computer precision for straight trajectory).
6.6. Example 6. Change reference of a position vector
In many applications, an object's (3D) position given relative to one frame needs to be expressed relative to another frame. For example, this calculation is needed if a vehicle position measured by one radar should be expressed relative to a second radar. The global positions of both radars are given and a classical approach to this problem is to assume that each radar has an associated N-frame. The vector to the vehicle is given relative to and decomposed in one N-frame, and should be found relative to and decomposed in the second N-frame. Using the elliptical Earth model, a classical approach is based on latitude and longitude (Moore and Blair, Reference Moore, Blair., Bar-Shalom and Blair2000) and gives the answer using 16 lines of code. Solving the same problem using n-vector and the functions in Section 5.4 is intuitive, and only 4 lines of code need be written. Counting the code lines inside the functions used, and multiplying for repeating use of functions gives a total of 10 code lines.
The above problem used N-frames, and is thus inherently singular at any pole. Another variant of the problem would be if the original and final vectors were given in the radar frames (where they are measured), and the orientation was given relative to E (which is the natural measurement from a multi-antenna GPS), rather than N. This variant is also discussed in (Moore and Blair, Reference Moore, Blair., Bar-Shalom and Blair2000) and in the classical solution new lines of code are needed for this variant (since the solution still goes via the N-frames). For n-vector, the total code now consists of only two lines, and in addition, the solution is completely non-singular.
If local level frames are desired also in the polar regions, non-singular code is easily achieved with the n-vector approach by replacing N with a non-singular frame. For the classical approach, this is not possible, since it is based on latitude and longitude.
7. n-VECTOR USAGE
In practice, it turns out that n-vector can be used for most position calculations where global position is involved. After presenting this alternative for various research groups at FFI and collaborating universities and research institutes, n-vector has replaced other alternatives in numerous applications. Examples of military usage include position calculations for radars, passive submarine sonars and active ship sonars, where the position calculations include target tracking. For navigation applications, n-vector is central for the position calculations in NavLab, HAIN (Marthiniussen et al. Reference Marthiniussen, Faugstadmo and Jakobsen2004) and the HUGIN real-time navigation system (Hagen et al., Reference Hagen, Storkersen and Vestgard2003) and (Jalving et al., Reference Jalving, Gade, Hagen and Vestgard2004). Applications include real-time and post-processing implementations in Matlab, C++ and C#, where thousands of hours of sensor data have been processed using n-vector, since 1999.
7.1. Using n-vector for attitude representation
n-vector is usually decomposed in E for horizontal position representation. However, if n-vector is decomposed in B, it will serve as a convenient and non-singular representation of roll and pitch. This is useful in several situations, since roll and pitch are often treated together, separately from yaw (heading). Actually nB relates to roll and pitch, in the same way as nE relates to latitude and longitude. Since the focus of this paper is on position representation, the treatment of nB as orientation representation will not be covered here.
CONCLUSIONS
Calculations involving global position often include the use of latitude/longitude, local north/east grids or map projections. The latter two alternatives involve limitations and approximations, and we have seen that the latitude/longitude representation has several complex properties, such as error in latitude leading to error in longitude, a discontinuity at longitude=±180°, and longitude rate going towards infinity at the poles. Numerous examples have shown that the use of n-vector to represent horizontal position gives one or more of the following advantages compared to the traditional approaches (for elliptical or spherical Earth model):
• There are no singularities at the poles or problems at longitude=±180° (the code works equally well for all global positions).
• An exact answer is returned (no approximations are made leading to increasing errors with increasing distances).
• Fewer lines of code are needed to solve typical position calculations.
• Implementation of the code is intuitive (no need to look up a specific procedure).
• No if-statements or iterations are needed in the code.
At FFI and collaborating universities and research institutes, n-vector has successfully been replacing other alternatives in numerous military and civilian applications and commercial products since 1999.
Acknowledgements
The author would like to thank everyone that has suggested topics and improvements of this paper, in particular scientists and engineers at the Norwegian Defence Research Establishment (FFI), the University Graduate Centre and Kongsberg Maritime.


APPENDIX B: KERNEL FUNCTIONS
The functions described in Section 5.4 are very easy to implement if using two kernel functions. The kernel functions are the back and forth conversions between the two non-singular alternatives for global position given in this paper: n-vector (with height) and the position vector (pEBE).
B.1. From n-vector to position vector
Going from n-vector (and height) to pEBE is done with a single equation that can be found from the geometry (Gade and Gade, Reference Gade and Gade2007),
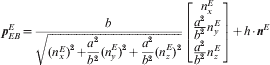
where a and b are the semi-major and semi-minor axes of the ellipsoid model in use.
It should be noted that this task is almost the same as if we were going from latitude and longitude (and height/depth) to pEBE instead. The equation for the latter is given in textbooks such as (Strang and Borre, Reference Strang and Borre1997). Thus, (22) can also be found by substituting n-vector components (using (3)) in the standard equation (the substitution is very simple, since the equation already contains only terms that are equal to the three components in (3)). Thus, replacing latitude/longitude with n-vector makes the standard equation shorter in addition to removing the singular quantities.
B.2. From position vector to n-vector
Going from pEBE to n-vector is again a similar problem as going from pEBE to latitude and longitude. The solution of the latter is believed by many to require iterations (see for example (Zipfel, Reference Zipfel2000) and (Strang and Borre, Reference Strang and Borre1997)), but direct and exact (closed-form) solutions are available (Vermeille, Reference Vermeille2004). Also in this solution, replacing latitude/longitude with n-vector gives a shorter and non-singular equation (Gade and Gade, Reference Gade and Gade2007),
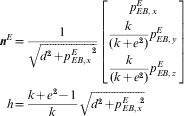
where e is the eccentricity of the Earth ellipsoid, given by  . Further
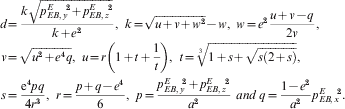
Note that by avoiding iterations, (23) runs faster than standard iterative solutions. Equation (23) is e.g. 2 to 3 times faster than the solution found in the current Matlab version (‘ecef2geodetic.m’ in the Mapping Toolbox), depending on the number of iterations needed (Gade and Gade, Reference Gade and Gade2007).