Introduction
The importance of integrated farm data services is increasing, as farming itself is becoming an increasingly data-intensive activity (Sørensen et al., Reference Sørensen, Pesonen, Bochtis, Vougioukas and Suomi2011). Competitive advantage increasingly lies in making the right decisions and executing the right operations at the appropriate time (Fountas et al., Reference Fountas, Carli, Sørensen, Tsiropoulos, Cavalaris and Vatsanidou2015). In this work we describe a prototype implementation of an open environment for processing data created from various sources. Physical data sources on a farm, such as farm machinery and sensors, we call Farm Things after the Internet of Things (IoT), where Things are physical devices connected to the internet (Gubbi et al., Reference Gubbi, Buyya, Marusic and Palaniswami2013). In the environment, data from various sources can easily be gathered, combined, stored, used for various analyses, and shared with selected third parties. The environment is built using the Service Oriented Architecture (SOA) paradigm, and thus can easily be modified and is able to work with third party systems (Krafzig et al., Reference Krafzig, Banke and Slama2005). In SOA paradigm applications are composed as autonomous services that can communicate with one another without a central authority to facilitate all communications.
Farming data can be created from a number of different sources. On the farm, Things that can provide the farmer with data include tractor-implements, harvesters, other mobile machinery, fixed equipment and various sensor systems, including weather and soil sensors. On a modern farm, this data can be used in planning, and as an enabler for precision farming.
There are several important barriers preventing farmers from fully taking advantage of the possibilities enabled by meticulous data gathering. While it is easy to gather data from machinery that support the ISO 11783 (ISOBUS) data communication standard (Anon, 2014), it is significantly more difficult to gather data from older machinery. Similarly, it is often difficult to manage a network of various sensors from a number of different manufacturers. Thus, farmers face a situation where they are faced with incomplete data as well as difficulties in data and system integration.
There are already solutions that allow a farmer to integrate the data from their sensors and machinery and use it in decision making. However, typically such solutions either do not cover the whole farming cycle, or have limited ability for interoperability (Fountas, 2015), and thus require the farmer to commit to the digital ecosystem of one provider. Since farming data has significant value, there is a need for a solution, which is able to use data from a wide variety of sources, and that can allow the farmer to retain full control and ownership of their business data.
In this work, a prototype implementation of a SOA-based open farm data management system is described. The system is able to take input data from a variety of sources, including Farm Things that do not support widely accepted data transfer standards. It is a concrete example of the advantages of such architectures. The SOA approach presents an alternative in software integration to platform-based thinking such as FIspace (Kruize et al., Reference Kruize, Wolfert, Goense, Scholten, Beulens and Veenstra2014). The scientific contribution of this work is the design, development, testing, and demonstration of this construct, and the analysis of the results and the feedback gained from users.
Materials and Methods
This work has used the constructive research approach, where the goal is to create an innovative construct in order to solve a real-world problem and thus create new scientific knowledge (Lukka, Reference Lukka2000). The construct in this work is the prototype environment, and it has been built in order to test promising means to improve farming by creating seamless flow of data. This, in turn, could enable improved efficiency, and increase competitiveness through cost savings. There were three technical goals for the system: gather data, combine data in meaningful ways, and represent data to users in a manner that allows them to make better decisions.
The components of the construct were defined through use case descriptions for three use cases (UC): 1) seeding and fertilization, 2) plant protection, and 3) harvesting. Earlier research regarding user-centric farm information management was utilized when designing the construct (Nurkka et al., Reference Nurkka, Norros and Pesonen2007, Sørensen et al., Reference Sørensen, Pesonen, Fountas, Suomi, Bochtis and Bildsøe2010). Especially, data flow models of precision farming tasks by Sørensen et al. (Reference Sørensen, Pesonen, Fountas, Suomi, Bochtis and Bildsøe2010) were employed. Also, the functional requirements for FMIS (Sørensen et al., Reference Sørensen, Pesonen, Bochtis, Vougioukas and Suomi2011), including description of assisting services needed in decision making, provided basic information for the design.
The work on the prototype described in this work is partially based on earlier research on the Cropinfra research platform at Natural Resources Institute Finland (Pesonen et al., Reference Pesonen, Teye, Ronkainen, Koistinen, Kaivoisoja and Suomi2014, Ronkainen et al., Reference Ronkainen, Teye, Koistinen, Kaivosoja, Pesonen and Suomi2012). Cropinfra serves as research, development and testing platform with farming processes, mapped fields, Farm Things, i.e. farm machinery, weather stations and sensors, and also as a farm data storage with farm history data as service.
Testing and demonstration of the system was conducted at a Natural Resources Institute Finland research farm in Vihti, southern Finland. A Valtra T163 tractor and Junkkari Maestro M300 Plus seed drill were used in UC 1. An A-Lab AWS-1 weather station and farm history data were used in UC2. A Sampo-Rosenlew Comia C6 combine harvester equipped with Ceres 3000 yield mapping system was used in UC 3. A wireless transmitter was installed on the tractor, the weather station and the harvester. Two adjacent field parcels with a combined area of approximately 10 hectares were dedicated to testing and demonstration of the prototype system for the 2016 growing season. The dedicated weather station was placed between the two parcels. Field workers used the prototype through the 2015 and 2016 growing seasons gaining hands-on experience with system.
Test parcels were planted with disease resistant malt barley variety, which simplified the detection and observation of diseases. The disease for the plant protection case was barley net blotch, caused by Pyrenophora Teres (Liu et al., 2011). The seeds were dressed against diseases in order to ensure that impurities in the seed batch did not affect the results. Plant samples were taken from the parcels and analyzed for disease during the growing season.
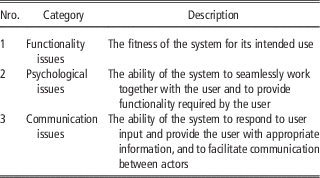
The system was demonstrated to users on a demonstration day in Vihti, and feedback was received through a discussion panel that same day. The users, farmers as end users as well as industry representatives, commented on the system and the prototype construct which they had just seen in action on the farm. The results of this discussion were transcribed and the feedback was categorized into three categories according to Kaasinen and Norros (Reference Kaasinen and Norros2007). The categories are described in Table 1. The categorization is meant for assessing user experience in intelligent environments. The comments were subjected to further validation in bilateral face-to-face interviews with farmers in KoneAgria2016 machinery exhibition. The interviewers were used to validate the issues raised in the demonstration day. The number of people who also considered these issues important was also recorded, as was how important they considered the issue to be.
assessment categories for feedback evaluation

Results
This work has produced two important results. The first is the prototype environment itself, which can be used as an example of how to manage farm data using SOA-based approach. The second are the results of the testing and user evaluation of the system. These results also include the feedback gained from the users. These results establish the advantages and disadvantages of the current prototype, as well as show what aspects of the system users find important. This data can then be used to guide future research efforts.
The Prototype system
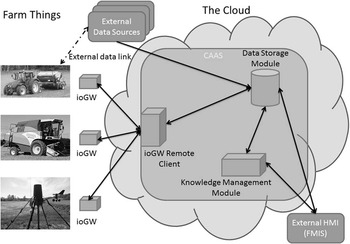
The prototype developed in this work consists of several different modules, some of which are attached to Farm Things, and some of which reside in various local processing and cloud modules. The exact arrangement of elements that were used varies between the different field operations, but in general six important elements of the system can be distinguished. An overview of the system is given in Figure 1.
Overall View of the Prototype System.

The majority of the modules in the prototype system reside in a cloud. The cloud contains the connectivity and discovery functionality between different services, data storages and analysis functionality, a wireless Input-Output Gateway (ioGW) that data feeds from Farm Things, and connectivity to external systems. These different system modules are all independent services that cooperate using principles of SOA. The cooperation is managed using the Central Authentication and Authorization Service (CAAS) (Kubovy et al., Reference Kubovy, Huber and Jäger2016), which defines what data and functionality each user can access in the system. CAAS is an implementation of the open authorization framework OAuth 2.0 and the OpenID standard.
The Data Storage Module is used to store all the data the system gains from farm things and third party services. The module is based on the LinkSmart platform (https://www.linksmart.eu). Data from Farm Things and other physical devices is primarily gained through the Input-Output Gateway (ioGW) Module and its cloud element, the ioGW Remote Client Module (Nakutis et al., Reference Nakutis, Deksnys, Jaruševičius, Dambrauskas, Činčikas and Kriaučeliūnas2016, Oksanen et al., Reference Oksanen, Linkolehto and Seilonen2016). The ioGW provides means to connect Farm Things and other data sources to the cloud system. The module can both transmit information from attached Things and to receive communication from the cloud. The remote client is responsible for mediating the data transfer between the Thing and the cloud platform. The data is further processed in the Knowledge Management Module (Jäger and Nadschläger, Reference Jäger and Nadschläger2016, Nadschläger et al., Reference Nadschläger, Jäger and Huber2016), which is the component that undertakes all data processing, information management, knowledge management and thereof derived functionality, data validation, data fusion, agronomic modelling, decision support and intelligence and data security. In addition, the system is connected to a number of External Services. For example, the farming data used in the demonstrations was visualized in the Dacom Crop-R (http://www.crop-r.com) farm management system.
Testing results
All tests were executed by experienced farm workers who were briefed in the use of the prototype system and knew how to operate it. In UC1 and 3 real-time collection and remote monitoring of machine data, and further transfer to FMIS was showed. In UC2 the data collection form sensors and transfer to disease model and created alerts were demonstrated.
During field operations IoGW was used to gather and transmit data from mobile machinery, and data was also continuously gathered by the weather station. Thus data flows between different elements of the prototype were established in all use cases. The farm workers used a web interface to plan field operations, examine and review the data in all UCs, and to follow the progress of the disease pressure model through the growing season in UC 2. The plant protection models that ran on the knowledge management platform functioned without interruption through the season. During the growing season there were some technical difficulties with getting the weather data from the weather station. When required, weather data from the Finnish Meteorological Institute was used as a substitute.
According to field workers the system helped them to assess situations, make better decisions, and provided them with means to learn in all three use cases. Thus, according to the field workers, the system fulfilled the three technical requirements set for it: data was gathered, combined meaningfully, and presented in a manner that the farm workers considered to have helped in decision making.
The farm workers also reported that the prototype system did not create extra work during field operations. However, in the tractor cabin there was no way to see whether the data collection and cloud link were functioning, which made it impossible for the field personnel to know if the system was working at any given moment.
In UC 1 later evaluation of work data was informative and helped to discover incorrect application of fertilizers in one of the test fields, where too small amount had been used. This discovery made it possible for the field personnel to spread additional fertilizer to fix the situation. In UC 2 the reference plant analysis revealed that the disease model performed mediocrely. However, the system as such performed as planned giving timely disease alerts triggered by the model. In UC 3 during the demonstration the harvester’s yield mapping system failed. This loss of data led to the harvesting operation to be halted until the fault was fixed. This caused the loss of some yield map data, and for demonstration to be shorter than originally anticipated.
Reflecting the farm worker assessment of the system on the categories given in Table 1, the workers were satisfied with the general functionality of the system. There were problems with some elements, such as the disease model. There was a significant communicative issue regarding the ioGW device in the tractor cabin. This also a psychological issue related to trust towards the system.
Demonstrations and feedback
Two use cases were included in the demonstration: a simulated seeding and fertilization demonstration, executed without farming inputs in the seed drill, and an actual harvest demonstration on the test fields. The plant protection operation was excluded from the demonstration as the main improvement there was tools for timing the operation. The decision support tools used for it were discussed, however.
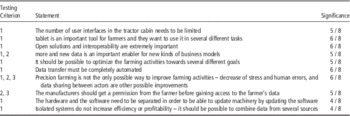
The main results of the feedback from the demonstration day and KoneAgria2016 can be seen in Table 2. Due to space constraints, the Table contains only the most significant results. Each line of the Table contains one important statement from the feedback, the categorization it falls under, and the number of interviewees who considered this statement significant. In the Table we have included those results that were considered most important in the demonstration day, as well as ranked as important by interviewees at KoneAgria2016.
The most important elements of the gathered feedback

The farmers felt very strongly about several functional issues in the system, such as the number of user interfaces, types of devices used, or the modes of transfer, ownership and access to data. There were significantly fewer communicative or psychological issues that were considered very important. As expected, farmers felt that the data should create new opportunities and additional value, and it should be easily used. There were, however, some interesting elements in the feedback. For example, in the demonstration day the usefulness of real-time data transfer was discussed for quite a while but there weren’t many people in KoneAgria2016 who felt strongly about this issue. Also, the ability to gather data from all older devices was something the farmers participating in the demonstration day felt to be important. However, at KoneAgria the majority of the people did not think this significant.
Discussion
This work expands on previous ideas (Pesonen, 2014, Ronkainen, 2012) of the authors by showing in practice how an open, SOA-based environment can be built by a number of cooperating actors and used to manage farm data in an open manner. It therefore demonstrates a system for farms that is not tied to any single service provider, and does not require the farmer to tie the management or relinquish the ownership of their farm data.
It also demonstrates how better integration of farming data and farming information systems can improve work processes in farming. Furthermore, the system demonstrates how knowledge management services can be integrated to farm management practices in order to give the farmer better information regarding their farm.
The comments from end users demonstrate that farmers require tools that they can use to gather data, and especially tools that can show them the data relevant for their current task presented in a way they can easily comprehend. This is in agreement with Fountas et al. (Reference Fountas, Carli, Sørensen, Tsiropoulos, Cavalaris and Vatsanidou2015), who also claim that data needs to support and enhance farmer decision making processes.
Conclusions
This work has presented a prototype environment for farm data integration, based on the service oriented architecture paradigm. The prototype has been tested successfully in southern Finland and demonstrated to a number of user groups, including farmers as end users. Users are struggling with their current systems and with the increasing complexity of data available.
The end users in the evaluation presented claims and needs and it was concluded that the developed SOA oriented prototype system was able to satisfy the needs and claims presented and thus the design was valid.
There is a clear need for horizontal integration between systems to unleash their full potential. Even very simple data integration, such as done in this work, revealed new insights into farming processes and allowed users to notice problems that would otherwise be overlooked.
Acknowledgements
This work has been done as part of the EU FP7 funded project CLAFIS (Crop Livestock and Forests Integrated System for Intelligent Automation) under grant agreement 604659. We would like to thank all our project partners.