Implications
Mastitis and claw and leg disorders (CLDs) are common in dairy cows. Although increasing milk yield influences the incidence of these diseases, the relationships between disease incidence and milk yield at various lactation stages have not yet been thoroughly investigated. We used a threshold–linear random regression test-day model to estimate the genetic relationships between yield traits and mastitis or CLD incidence from first-lactation records of Holstein cows. The highest positive genetic correlations between yields and disease incidences appeared at about the time of peak milk yield. Selection focused on peak yield may therefore increase the risk of mastitis and CLDs.
Introduction
In commercial dairy populations, mastitis and claw and leg disorders (CLDs) reduce profitability in farm management because of reduced production, increased veterinary costs and involuntary culling (Enting et al., Reference Enting, Kooij, Dijkhuizen, Huirne and Noordhuizen-Stassen1997; Booth et al., Reference Booth, Warnick, Gröhn, Maizon, Guard and Janssen2004; Shim et al., Reference Shim, Shanks and Morin2004).
In general, the heritability of disease resistance is low, because genetic variance has been reduced through a long period of natural and artificial selection. In contrast, environmental variance is high owing to relatively large variations in management. Estimated heritabilities are less than 0.15 for mastitis (e.g. Harder et al., Reference Harder, Bennewitz, Hinrichs and Kalm2006; Pérez-Cabal et al., Reference Pérez-Cabal, de los Campos, Vazquez, Gianola, Rosa, Weigel and Alenda2009; Hinrichs et al., Reference Hinrichs, Bennewitz, Stamer, Junge, Kalm and Thaller2011) and 0.12 for CLDs (Koenig et al., Reference Koenig, Sharifi, Wentrot, Landmann, Eise and Simianer2005; van der Waaij et al., Reference van der Waaij, Holzhauer, Ellen, Kamphuis and de Jong2005; Onyiro et al., Reference Onyiro, Andrews and Brotherstone2008; Laursen et al., Reference Laursen, Boelling and Mark2009; Buch et al., Reference Buch, Sørensen, Lassen, Berg, Eriksson, Jakobsen and Sørensen2011). However, next to production and fertility traits, health traits are still important in national breeding schemes, because even a small increment in disease rates has a serious influence on farm management costs (Koenig et al., Reference Koenig, Sharifi, Wentrot, Landmann, Eise and Simianer2005). Therefore, selection indices in many countries place positive weight on health traits or health-related traits (Miglior et al., Reference Miglior, Muir and Van Doormaal2005). When health trait data are not available in routine genetic evaluations, genetic performance for disease resistance can be improved by indirect selection using health-related traits such as SCS or type traits (Lund et al., Reference Lund, Jensen and Petersen1999; Sewalem et al., Reference Sewalem, Kistemaker and Van Doormaal2005).
Antagonistic genetic correlations have been reported between lactation milk yield and disease resistance (e.g. Van Dorp et al., Reference Van Dorp, Dekkers, Martin and Noordhuizen1998; Carlén et al., Reference Carlén, Strandberg and Roth2004; Pritchard et al., Reference Pritchard, Coffey, Mrode and Wall2013). Such correlations have the potential to cause serious problems in countries such as Japan, where breeders have been selecting Holstein cows mainly on the basis of milk yield. Several recent studies have suggested that the genetic correlations between production traits and disease resistance vary among lactation stages and that selection for lactation persistence could reduce disease incidence (Muir et al., Reference Muir, Fatehi and Schaeffer2004; Appuhamy et al., Reference Appuhamy, Cassell and Cole2009; Yamazaki et al., Reference Yamazaki, Hagiya, Takeda, Sasaki, Yamaguchi, Sogabe, Saito, Nakagawa, Togashi, Suzuki and Nagamine2013). Using a linear–linear model, Negussie et al. (Reference Negussie, Strandén and Mäntysaari2008) reported moderate positive genetic correlations between test-day (TD) milk yield and mastitis incidence in Ayrshire cows. They also suggested that selection for high milk yield in early lactation would increase the risk of mastitis. From this perspective, Togashi and Lin (Reference Togashi and Lin2004) developed a selection procedure that emphasized the improvement of milk yield in the middle and late stages to improve total milk yield.
The relationships between disease incidence and milk yield in the various stages of lactation, however, have not yet been thoroughly investigated. Although disease incidence is generally recorded as a binary trait, the relationships between continuous values (production traits) and binary disease incidence have been estimated only by using a threshold–linear lactation model or a linear–linear random regression TD model (RRM; e.g. Negussie et al., Reference Negussie, Strandén and Mäntysaari2008; Buch et al., Reference Buch, Sørensen, Lassen, Berg, Eriksson, Jakobsen and Sørensen2011). The threshold–linear RRM should be the most appropriate model in theory and makes it easier to interpret the results of specific TD management rather than whole-lactation management.
Here, we aimed to elucidate the genetic relationships between continuous (TD milk yield or SCS) and binary (incidence of mastitis or CLDs) traits in different lactation stages by using a threshold–linear RRM.
Material and methods
Data
TD records of milk yields, SCCs, and mastitis incidence in Holstein cows that had calved for the first time between 2000 and 2009 were provided by the Hokkaido Dairy Milk Recording and Testing Association. The TD records were collected once a month as part of the Dairy Herd Improvement Program. SCCs were log-transformed into SCSs by using the formula SCS=log2(SCC/100 000)+3 (Ali and Shook, Reference Ali and Shook1980). Records of mastitis and CLDs were defined as binary traits of 0 or 1, where 1 indicated the presence of the disease in the past month, as reported monthly by the owner to the milk-recording supervisor. CLDs recorded included laminitis, sole ulcer, heel–horn erosion, digital dermatitis, inflammation of the bulb and other causes of lameness. Only TD records that were complete for all traits were used to analyse genetic correlations. Yield and disease records were from first-parity cows (calving age, 18 to 35 months), and TD records were limited to 305 days in milk (DIM). The total number of records was 402 332 from 46 771 cows. A pedigree file containing records of 80 132 animals that include up to three generations was obtained from the Holstein Cattle Association of Japan.
Model
Genetic correlations were estimated from the combined analysis of a threshold–linear bivariate animal model. A threshold model was applied to the binary records (mastitis and CLDs) and a linear model was applied to the other traits. In the preliminary study, we used a fourth-order RRM for the effects of additive genetic traits. However, it did not achieve good convergence for covariance. Therefore, a cubic RRM for both liabilities and continuous traits were used to examine the additive genetic effects in the first lactation, as modeled by Tsuruta et al. (Reference Tsuruta, Misztal, Huang and Lawlor2009). The threshold–linear RRM on DIM was as follows:
 $$\eqalign{\left[ {\matrix{ l \cr y \cr } } \right]=\ \left[ {\matrix{ X & 0 \cr 0 & X \cr } } \right]\left[ {\matrix{ {\beta _{1} } \cr {\beta _{2} } \cr } } \right]{\plus}\left[ {\matrix{ {Z_{1} } & 0 \cr 0 & {Z_{1} } \cr } } \right]\left[ {\matrix{ {u_{1} } \cr {u_{2} } \cr } } \right]\cr {\plus}\left[ {\matrix{ {Z_{2} } & 0 \cr 0 & {Z_{2} } \cr } } \right]\left[ {\matrix{ {p_{1} } \cr {p_{2} } \cr } } \right]{\plus}\left[ {\matrix{ {e_{1} } \cr {e_{2} } \cr } } \right],$$
where l is the unobserved liabilities in disease records; y is the vector of observation for TD yield or SCS; β
1 is the vector of fixed effect of herd×year (2608 subclasses); and β
2 is the vector of fixed effect of herd×TD (28 551 subclasses). Subclasses were determined by age at calving×calendar month at calving (15 calving age groups and 12 calendar months, giving a total of 180 subclasses), with fixed regressions on DIM using fourth-order Legendre polynomials with a coefficient of the exponential term of the Wilmink function (Wilmink, Reference Wilmink1987) at DIM t, with
 $$\phi (t)=[ {\matrix{ {\phi _{0} (t)} & {\phi _{1} (t)} & {\phi _{2} (t)} & {\phi _{3} (t)} & {\phi _{4} (t)} & {\exp ^{{{\minus}0.05t}} } \cr } } \right]$$
(Shaeffer et al., Reference Shaeffer, Jamrozik, Kistemaker and Van Doormaal2000). Moreover, u
1 and u
2 are the vectors of additive genetic effects with random regressions on DIM using cubic Legendre polynomials; p
1 and p
2 are the effects of permanent environment of cows, with random regressions on DIM using cubic Legendre polynomials; e
1 and e
2 are the vectors of random residual effects; and X, Z
1, and Z
2 are the design matrices for β, u, and p, respectively. The covariance structure of random effects was defined as
 $${\mathop{\rm var}} \left[ {\matrix{ u \cr p \cr e \cr } } \right]=\left[ {\matrix{ {G\,\otimes\,A_{u} } & 0 & 0 \cr 0 & {P\,\otimes\,I_{p} } & 0 \cr 0 & 0 & {R\,\otimes\,I_{n} } \cr } } \right],$$
where G and P are 8×8 (co)variance matrices of the random regression coefficients for additive genetic and permanent environmental effects, respectively; R is a 2×2 residual (co)variance matrix; A
u
is the matrix of additive genetic effect among animals; I
p
is an 8×8 identity matrix for cows; I
n
is a 2×2 identity matrix for records; and
 $$\,\otimes\,$$
is the Kronecker product.
The THRGIBBS1F90 program (Misztal et al., Reference Misztal, Tsuruta, Strabel, Auvray, Druet and Lee2002) was used for Gibbs sampling for the threshold and linear models. Residual variances of binary traits were fixed at 1.0 on the liability scale. A flat prior was used for fixed effects, and an inverted Wishart distribution was used as the prior on the random effects. For each analysis, 150 000 samples (saving every 10th sample after a burn-in of 50 000 iterations) were used to calculate the posterior means and standard deviations of the (co)variance components. Convergence was determined from a visual inspection of the plotting of Gibbs samples.
Random genetic effects were represented as a cubic Legendre polynomial at DIM t, with
 $$\phi (t)=\left[ {\matrix{ {\phi _{0} (t)} & {\phi _{1} (t)} & {\phi _{2} (t)} & {\phi _{3} (t)} \cr } } \right]$$
. The genetic correlation between yield or SCS at DIM
 $$t_{1} $$
and disease at DIM t
2 was estimated as
 $$\hat{r}_{{g,{\rm Yield}(t_{1} ){\minus}{\rm Disease}(t_{2} )}} ={{\phi '(t_{1} )G_{{{\rm Yield}{\minus}{\rm Disease}}} \phi (t_{2} )} \over {\sqrt {\phi '(t_{1} )G_{{{\rm Yield}}} \phi (t_{1} ){\times}\phi '(t_{2} )G_{{{\rm Disease}}} \phi (t_{2} )} }},$$
where G Yield–Disease is the additive genetic covariance between yield and disease incidence for random regression coefficients; G Yield is the additive genetic (co)variance of yield for random regression coefficients; and G Disease is the additive genetic (co)variance of disease incidence for random regression coefficients.
Results
Summary statistics
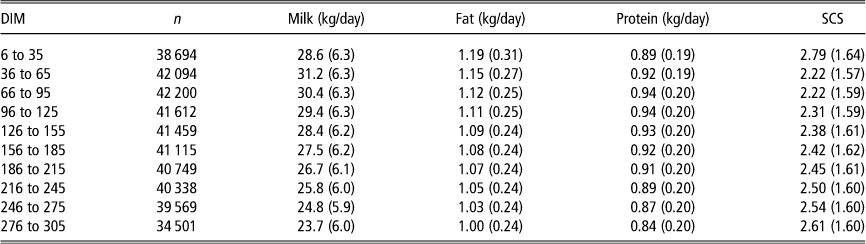
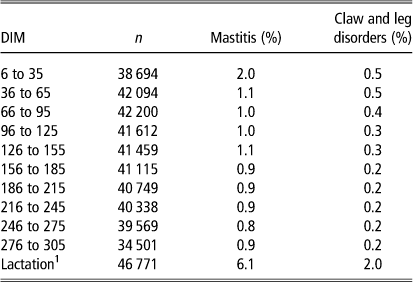
Mean values of daily milk, fat and protein yields and SCS are shown in Table 1. For milk and protein, TD production was higher from 36 to 125 DIM than from 6 to 35 DIM; thereafter it gradually decreased. Fat yield in first lactation decreased from 1.19 to 1.00 kg/day with increasing DIM. Mastitis frequency decreased with increasing DIM from 2.0% to 0.9%; CLD frequency also decreased with increasing DIM, from 0.5% to 0.2% (Table 2).
Means (with SDs in parentheses) of milk, fat and protein yields and SCS in first-lactation cows at various DIM

SCS=somatic cell score; DIM=days in milk.
Diseased cows as percentages of the total number of cows for which data were recorded at various DIM

DIM=days in milk.
1 Percentage of cows with disease at any stage of first lactation.
Phenotypic correlations
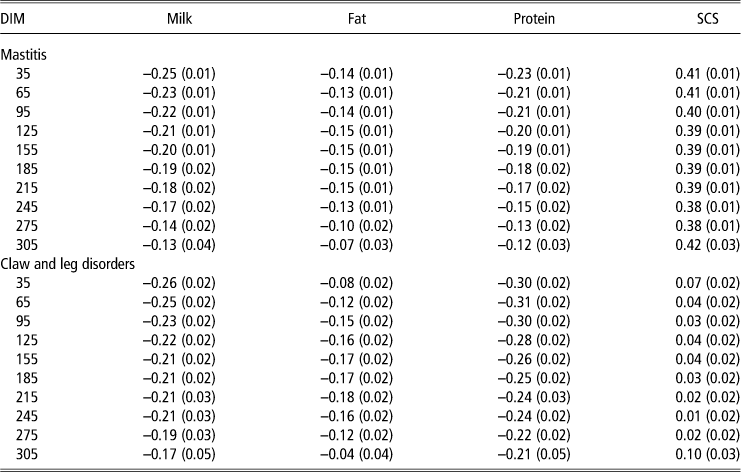
Daily phenotypic correlations between yield traits and disease incidence were negative and small (Table 3). Stronger correlations between mastitis or CLD incidence and milk or protein yield were found in the early stages of lactation than in the later stages; the correlations between milk yield and disease incidence ranged from –0.25 to –0.13 (mastitis) and from –0.26 to –0.17 (CLDs). The correlations between fat yield and mastitis incidence were small, negative and almost constant in the interval between calving and 215 DIM; they gradually became smaller toward the end of lactation (range throughout lactation: –0.15 to –0.07). The correlations between fat yield and CLD incidence ranged from –0.18 to –0.04. The phenotypic correlations between SCS and mastitis incidence ranged from 0.38 to 0.42, and showed no obvious pattern over the lactation period. The phenotypic correlations between SCSs and CLD incidence were low.
Posterior means (with SDs in parentheses) of daily phenotypic correlations of disease incidences (mastitis and claw and leg disorders) with milk, fat and protein yields and SCS in first-lactation cows at various DIM

SCS=somatic cell score; DIM=days in milk.
Heritability estimates
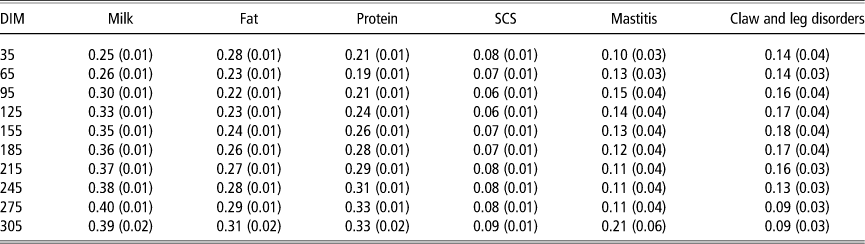
The heritability estimates of TD milk yield increased from 0.25 to 0.40 with increasing DIM (Table 4). For fat and protein yields, heritability estimates also generally increased steadily with increasing DIM (0.22 to 0.31 for fat and 0.19 to 0.33 for protein). The posterior means±1 SD of heritability over the entire 305-day lactation period were 0.42±0.01 (milk), 0.33±0.01 (fat) and 0.40±0.01 (protein; data not shown). The posterior means of heritabilities of SCS were almost constant (between 0.06 and 0.09) during the lactation period. The heritability estimates of mastitis incidence ranged between 0.10 and 0.21. For CLD incidence, the heritability estimates increased from 0.14 to 0.18 with increasing DIM but then gradually decreased after 155 DIM.
Posterior means (with SDs in parentheses) of heritabilities of milk, fat and protein yields, SCS, mastitis, and claw and leg disorders in first-lactation cows at various DIM

SCS=somatic cell score; DIM=days in milk.
Genetic correlations
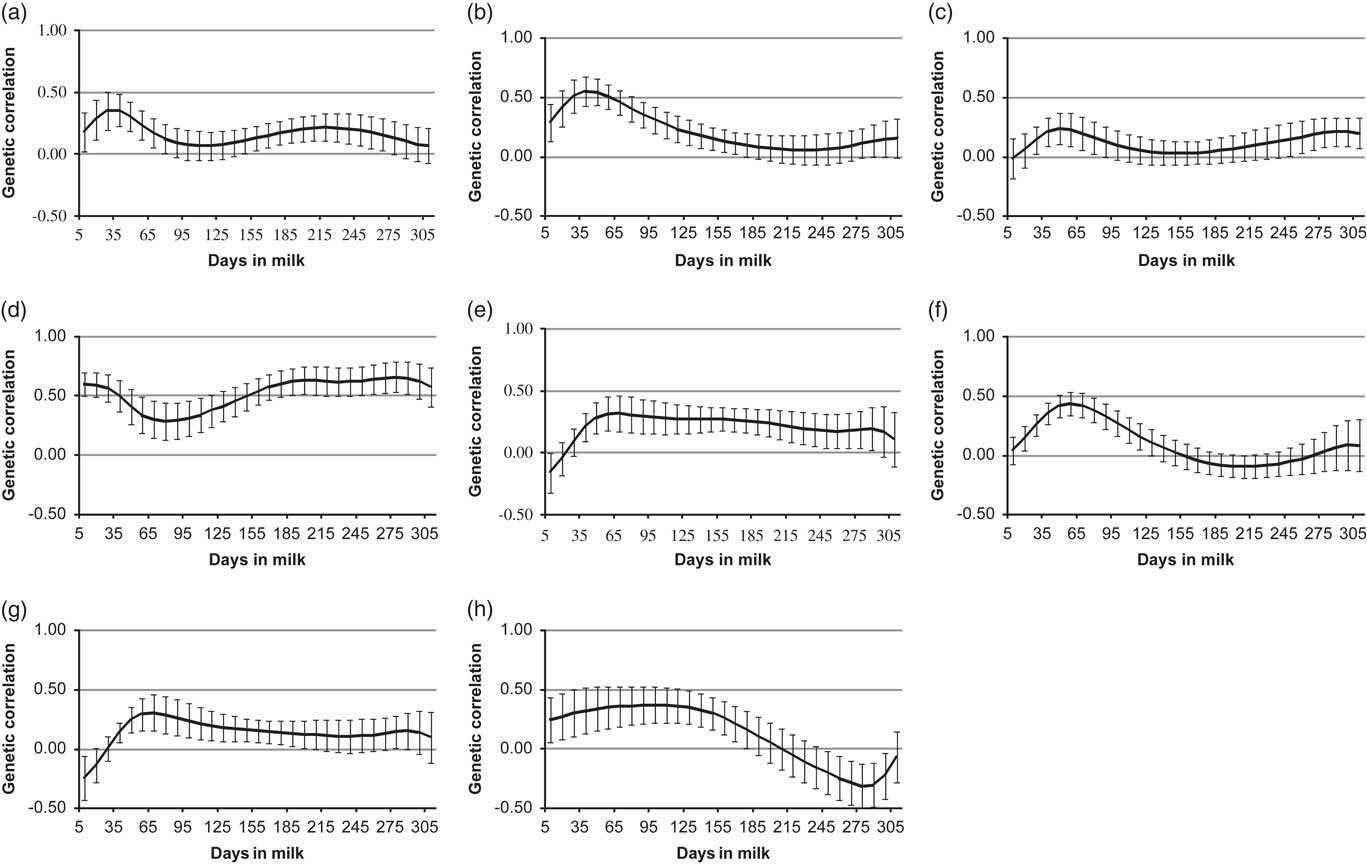
We calculated the posterior means and standard deviations of the daily genetic correlation estimates between yield traits and disease incidences (Figure 1). Daily genetic correlations between milk yield and mastitis incidence were highest (0.36) at about 35 DIM and then decreased with increasing DIM. Those between fat content and mastitis were highest (0.56) at 35 DIM. For the genetic correlation between protein and mastitis, the highest estimates were obtained at about 45 DIM (0.24) and again at the end of lactation (0.21); these estimates were smaller than those for milk and fat. The daily genetic correlations between milk or protein yield and CLD incidence were negative in the early stages of lactation and became positive after about 25 DIM. The graph of the correlation between fat and CLDs had a shape similar to the one between fat and mastitis, but the estimates were small or close to zero in the late stages of lactation. The highest estimated genetic correlations (0.32 for milk, 0.44 for fat, and 0.31 for protein) between TD yield and CLD incidence occurred near the time of peak milk yield (36 to 65 DIM). The daily genetic correlations between SCS and mastitis were positive, ranging from 0.28 to 0.66; they were high in the early and late stages of lactation. The genetic correlations between SCS and CLD decreased from 0.37 at about 95 DIM to –0.32 toward the end of lactation.
Posterior means and standard deviations (with bars) for daily genetic correlations (a) between milk yield and mastitis; (b) between fat yield and mastitis; (c) between protein yield and mastitis; (d) between somatic cell score and mastitis; (e) between milk yield and claw and leg disorders; (f) between fat yield and claw and leg disorders; (g) between protein yield and claw and leg disorders; (h) between somatic cell score and claw and leg disorders.

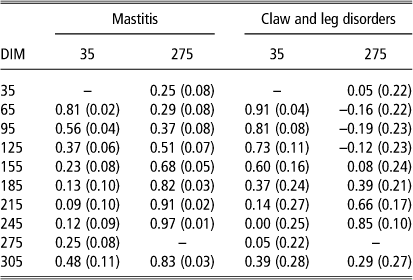
We also estimated the genetic correlation between the same disease traits at different days. The genetic correlation of mastitis at early (35 DIM) lactations decreased from 0.81 (65 DIM) to 0.09 (215 DIM) with increasing DIM; however, it increased slightly after 215 DIM toward the end of lactation (Table 5). Daily genetic correlations of mastitis at late (275 DIM) lactations gradually increased from 0.25 (35 DIM) to 0.97 (245 DIM) with increasing DIM. For CLD, trends of genetic correlation estimates were similar to those of mastitis but SDs were higher than those of mastitis (0.01 to 0.11 for mastitis and 0.04 to 0.27 for CLD).
Posterior means (with SDs in parentheses) of daily genetic correlations between the same disease incidences (mastitis and claw and leg disorders) at 35, 275 and variable DIM in first-lactation cows

DIM=days in milk.
Discussion
The overall frequency of mastitis in this study (6.1%) was lower than that in first-parity Holstein cows in the United States (9.5%; Appuhamy et al., Reference Appuhamy, Cassell and Cole2009) and in the United Kingdom (14%; Pritchard et al., Reference Pritchard, Coffey, Mrode and Wall2013). The overall frequency of CLD (2.0%) was much lower than that in Danish Holstein cows (6.3%; Laursen et al., Reference Laursen, Boelling and Mark2009). The Danish CLD data were recorded by veterinarians, whereas those in our study were reported by the cows’ owners. Laursen et al. (Reference Laursen, Boelling and Mark2009) also suggested that using CLD records scored by claw trimmers would extend the CLD data available beyond those scored by classifiers. Therefore, the frequencies of CLDs in different evaluation systems cannot be compared directly.
The posterior means of the phenotypic correlations between yield traits and disease incidences were small and negative. Although our daily phenotypic correlations between TD milk yield and mastitis incidence were somewhat larger, in absolute terms, than the estimates (ranging from –0.06 to 0.02) of Negussie et al. (Reference Negussie, Strandén and Mäntysaari2008), who used a linear–linear model, negative correlations similar to ours (ranging from –0.13 to –0.11) between these traits have been reported from first-lactation records (Carlén et al., Reference Carlén, Strandberg and Roth2004).
The posterior means of daily heritability of milk yield were in agreement with those reported using RRM in Holstein cows in Japan (Hagiya et al., Reference Hagiya, Togashi, Takeda, Yamasaki, Shirai, Saburi, Masuda and Suzuki2009). Our heritability estimates for mastitis were higher than those reported in Finnish Ayrshire cows by Negussie et al. (Reference Negussie, Strandén and Mäntysaari2008) using a linear model (0.03 in early DIM and 0.02 in the period from 31 to 300 DIM). Higher heritability (0.15) was estimated in German Holstein cows when the threshold RRM was used (Hinrichs et al., Reference Hinrichs, Bennewitz, Stamer, Junge, Kalm and Thaller2011). Hinrichs et al. (Reference Hinrichs, Bennewitz, Stamer, Junge, Kalm and Thaller2011) also reported that estimates using the threshold TD model were higher than those from linear or lactation models. Our posterior means of heritability of CLDs were higher than those obtained in Danish Holstein cows (0.01 for claw health and 0.01 for leg health; Laursen et al., Reference Laursen, Boelling and Mark2009); these researchers suggested that heritability estimates varied with the trait definition and the quality of trait recording. Although our disease data were reported by dairy farmers, they included medical treatment record in the past 1 month. Therefore, the quality of our records would be close to the record from veterinarian. As we applied the threshold–linear RRM, which should be the most appropriate model for disease traits analysis, quite reliable estimates were expected. However, SDs of posterior means of heritabilities for mastitis and CLD were still higher than those of production traits of SCS. Further studies are needed to obtain the reliable estimation for these disease traits.
The daily genetic correlation between yield traits and mastitis incidence was largest in the period of peak yield (35 to 45 DIM) (Figure 1). This antagonistic relationship agrees with that found by Negussie et al. (Reference Negussie, Strandén and Mäntysaari2008). Therefore, selection for increased production at peak yield may increase the risk of mastitis. The positive relationship between yield traits at about 65 DIM and daily CLD incidence suggested that high peak yield also increases CLD incidence.
Our positive genetic correlations between SCS and mastitis incidence agree with those (ranging from 0.34 to 0.77) of Negussie et al. (Reference Negussie, Strandén and Mäntysaari2008). Laursen et al. (Reference Laursen, Boelling and Mark2009) investigated claw health and leg health separately; they reported that the genetic correlation between claw health and leg health was low (0.35). Our definition of ‘CLDs’ included many kinds of disorders associated with lameness; it is therefore not easy to compare our results with those of previous studies. However, the positive genetic correlations of SCS with mastitis or CLD incidence imply that selection to reduce SCS in the early stages of lactation would decrease the incidence of both mastitis and CLD.
Zwald et al. (Reference Zwald, Weigel, Chang, Welper and Clay2006) observed that the genetic correlation between the incidences of mastitis in early and late lactation was low or moderate (ranging from 0.26 to 0.56 in first lactations). Therefore, Negussie et al. (Reference Negussie, Strandén and Mäntysaari2008) defined mastitis as two traits at different DIM; incidence of mastitis in either early or late lactation, and it was found that genetic correlations were high between mastitis and TD SCS during the same lactation stage. Our results for genetic correlations of mastitis in early and late lactation agree with those of Zwald et al. (Reference Zwald, Weigel, Chang, Welper and Clay2006). Although definition of several mastitis traits during lactation would result in high levels of modeling complexity, the threshold RRM for mastitis traits in terms of DIM – as we used here – would be suitable for obtaining genetic (co)variances on various TDs.
Conclusion
We investigated the genetic correlations between continuous traits (TD yields or SCS) and binary traits (mastitis or CLDs) at different lactation stages. The highest genetic correlation between yields and disease incidences (mastitis and CLD) was estimated to occur at about the time of peak milk yield. Selection focused on early lactation yield may therefore increase the risk of mastitis and CLD. We also found positive genetic correlations during the lactation period between SCS and mastitis incidence; therefore, reduction of SCS is likely to reduce the incidence of mastitis.
Acknowledgement
The authors are grateful to the editor and two referees for their helpful comments and suggestions.