The efficiency and geographical extent of markets are described by the flow of commodities. From the middle ages, the Baltic Sea region played a key role in the emerging European economy, not least by supplying rye and, later, wheat, and other grains. In this article, we analyze market integration both within the region focusing on the co-movement of grain prices across 10 Baltic ports (see Chart 1) and the region's integration into the Atlantic economy as measured by the London corn market from 1840s to 1880s. Our analysis is based on two newly constructed grain prices datasets: one for a sample of 10 Baltic ports and the second for wheat of different qualities in the London corn market at Mark Lane.
MAP OF THE BALTIC SEA WITH THE PORTS

Instead of relying on standard tests for market integration,Footnote 1 we combine a wavelet analysis with a dynamic factor model to estimate the degree of market integration. Giovanni Federico (Reference Federico, Persson, Hatton, O'Rourke and Taylor2012) argues that market integration is about equality or convergence of price levels, whereas co-movements or coordination of changes should be seen as a separate issue of market efficiency. Co-movements of prices, however, do not reflect efficiency of isolated markets but rather precisely when the markets are integrated. Of course, markets can be more or less integrated. To fully explore the extent of market integration we create a scale that allows us to measure varying degrees of market integration.
Specifically, we suggest a new test for market integration based on a dynamic factor model and wavelet analysis. Among its advantages is that it does not impose as many restrictive assumptions as other tests, rather it allows the data to speak for itself. Using a dynamic factor model, we create a scale along which we measure the degree to which markets are integrated. Using wavelet analysis, we take into account the fact that the degree of market integration is likely to vary across time horizons. Even if markets are integrated over the long-term, some short-term (or medium-term) price deviations among the markets may be expected due to local market conditions or the time it takes to equalize prices across markets.
The empirical results show that German ports from Danzig to Flensburg and Copenhagen were already highly integrated by mid-nineteenth century, although rye and wheat markets were more integrated than oats and barley markets. Volume data suggest that these differences can be partly explained by the trade volumes. Arguably, trade volumes in turn depend on costs, since lower priced grains can bear transaction and transport costs to a smaller extent and are as a result less traded. However, if trade costs were the prime driver of market integration, we should expect that integration would proceed sequentially from the most expensive to the cheapest grain, but this is not unambiguously the case. The variations in market integration between different kinds of grain and ports appear to be related to the volumes traded. This is not to deny the importance of transport cost. Ports on the periphery both in the West (London) and the East (Riga and St. Petersburg) were, as we show, less integrated than ports in the center. From the late 1870s market integration had geographically advanced. For wheat and rye, the Prussian ports and Copenhagen had attained a higher integration with London in the West as well as with St. Petersburg in the East. However, distance remained significant for oats and barley.
Recent research (Persson Reference Persson2004; Jacks Reference Jacks2004, Reference Jacks2005; Federico and Persson Reference Federico, Persson, Hatton, O'Rourke and Taylor2007; Uebele Reference Uebele2011, Reference Uebele2013) has emphasized that integration was not merely the result of declining freight costs but that institutional changes were also important, if not more important, during the first one-half of the nineteenth century. While our data cannot speak to early nineteenth century integration in the Baltic Sea region, there was immense growth in the volumes traded in the latter one-half of the century. This late nineteenth century expansion seems ignored when Karl Gunnar Persson (Reference Persson2004) stretched the argument by pointing out that the late-nineteenth century fall in wheat freights diminishes when deflated by the declining price of wheat. Yet, the point is actually that wheat, despite a declining price, could bear the Atlantic freights and without a concomitant decline of the latter, the impact of integration on economic growth and welfare would have been much less. Moreover, the market integration continued to advance which is shown with the new graded measure provided in this article.
The causes of market integration were certainly an interaction of several factors, institutions as well as information flows, and change in transport technology leading to declining freight rates. To these factors can be added traded volumes which interacted both with institutions and the scale effects of transport technology. To the latter belongs, indeed, the impact of railways with the enlargement of the areas of supply that pressed down the prices of wheat and increased volumes (Harley Reference Harley1980; Gulley Reference Gulley1987; O'Rourke and Williamson Reference O'Rourke and Williamson1999).Footnote 2 Although a comprehensive account of the effect of traded volumes on market integration is still lacking, our evidence suggests that volume plays a crucial factor in explaining market integration particularly in the early stages of market integration.
The article is organized as follows. Next we take a look at grain market integration in the Baltic Sea region during the nineteenth century. We then present our two new datasets, one based on monthly price quotations in Baltic Sea ports, and the second based on the weekly quotations in The Economist for the grain market in Mark Lane. We then present our new graded measure followed by an empirical analysis of co-movements and the role of distance in different trading points. Finally we discuss the results and their implications.
THE BALTIC SEA REGION AND THE GRAIN TRADE
From the fourteenth century, grain has been shipped from the Baltic Sea to Western Europe, in particular to Amsterdam, which dominated the trade through the Early Modern period. In the Baltic, Danzig (today's Gdansk) was the dominant port for Prussian grain and, at least from the end of the sixteenth to the beginning of the nineteenth century, prices in Amsterdam and Danzig were highly correlated (van Tielhof Reference van Tielhof2002, p. 94). The importance of Baltic grain shipped through the Sound is highlighted by the fact that during the late eighteenth century, its tonnage exceeded that of the trade between Europe and Asia (Rafael Dobado-González et al. Reference Dobado-González, Alfredo and Guerrero2012, p. 678).
In the nineteenth century, England came to replace the Netherlands as the Baltic region's major export market. In 1845, 75 percent of Baltic wheat exports went to England, and only 13 percent to the Dutch market. While the Baltic had exported more rye, for most of the nineteenth century wheat dominated (van Tielhof Reference van Tielhof2002, pp. 79, 64) although by the end of the century the port of Danzig began to export relatively more rye. On the eve of the WWI, the quantities of rye, barley, and oats shipped surpassed wheat (Franaszek Reference Franaszek2012). This reflected, firstly, a geographical diversification of the Baltic export markets to places where rye was used to produce bread. Secondly, it also reflected a fall in transports costs so that cheaper grains could carry their freight costs. The decline in freight costs, for example, allowed for an immense growth, from mid-century, in Russian exports of oats from ports on the Baltic, as well as barley from ports on the Black Sea (Gulley Reference Gulley1987).
Oats and barley took an increasing share in the Baltic trade during our period. Relative prices between the different grains could be seen as a response to this development by modestly converging towards the level of rye prices. There were, however, distinct fluctuations over some three to five years and the modest trend of convergence still left a gap between the prices of the different grains. Broadly speaking, wheat was 40 percent more expensive than rye, while barley was some 20 percent cheaper than rye, and oats 40 percent cheaper than rye.
Oats was shipped from Denmark and Tsarist Russia to Britain for horse fodder. Sweden also entered this trade and was the major supplier to the British market around 1870, although Tsarist Russia later regained its dominance. For German ports the oats trade remained of minor importance while trade in barley became large, due to demand from the modernized and fast growing brewing industry. Germany both exported and imported barley, whereas this trade remained insignificant for Russian ports on the Baltic. In the early 1880s, British imports of barley reached a level similar to its import of oats. Much of the barley came from Russian ports at the Black Sea while Germany and Denmark also provided substantial quantities.Footnote 3 As we discuss later this increase in the volume shipped of barley and oats is reflected in increased levels of market integration that took place at a later point in time than for wheat and rye. Wheat accounted for most of the German grain export although its share was in decline throughout the late nineteenth century. Large quantities of these bread grains were imported to Königsberg, close to the border of Tsarist Russia. Rye was then shipped on to other German ports and wheat re-exported.
The Baltic-Dutch grain trade of the Early Modern period was crucial for feeding the growing urban population of the “First Modern Economy”; similarly the “Grain Invasion” of the second half of the nineteenth century was a brick in the modernization of Europe. In this period the Baltic trade to Western Europe was supplemented and overtaken by imports from other sources. Russian and Ukrainian wheat was shipped from Odessa and other ports on the Black Sea, and American wheat over the Atlantic (Fairlie Reference Fairlie1965; Falkus Reference Falkus1966; Harley Reference Harley1980; Goodwin and Grennes Reference Goodwin and Grennes1998). However, the export of wheat from St. Petersburg and other Baltic ports of Tsarist Russia continued to grow and reached its highest volume in the early 1880s (Gulley Reference Gulley1987, pp. 325 ff). Wheat prices rose in England until the 1870s, but the rise in prices would probably have been significantly higher without the increasing imports. From 1874 prices fell and in a couple of decades were cut by one-half.Footnote 4 The impact on economic growth and the standard of living can scarcely be overestimated. The ensuing period witnessed a break-through, not the least in the standard of living (Leonard and Ljungberg Reference Leonard, Ljungberg, Broadberry and O'Rourke2010), and cheaper wheat had an important role. Internal as well as external integration of the wheat trade in the Baltic Sea region was part of the first wave of globalization.
Viewed by the measure of market integration proposed by Federico (Reference Federico2010, Reference Federico2012), that is, the dispersion of prices as indicated by the coefficient of variation the picture does not change much from the 1840s to the 1880s or 1890s (Figure 1). Apart from the big bulge during the Crimean war in the 1850s, the decline of the dispersion continues to the early 1870s when it increases again until the 1890s.
COEFFICIENT OF VARIATION FOR WHEAT PRICES IN EIGHT BALTIC SEA PORTS, 1841–1893

This is not dissimilar from the long-run view, with a larger European sample, told by Federico (Reference Federico2010). Thus, in this long-run view, there was a steady decline after 1825 and a “protectionist backlash in the late 1880s and early 1890s” (Federico Reference Federico2010, p. 105). A direct effect from tariffs cannot be seen in the present sample because we deal with prices f.o.b. and the Sounds Customs were insignificant.Footnote 5 To the extent protection reduced the shipped quantities it might have constrained the leveling of prices. Even if shipments from Danzig fell, this had begun already during the 1860s, before the protectionist backlash, and was caused by a reallocation of Polish-Russian exports to other Baltic ports (Franaszek Reference Franaszek2012). Shipments from St. Petersburg and also other ports such as Riga greatly expanded in the 1860s and 1870s. Besides wheat from St. Petersburg, increasing quantities of rye and oats were also exported from these ports. While wheat and oats were largely destined for Britain, rye, in particular, was shipped to German ports and this entailed a growth of the grain trade within the Baltic Sea (Gulley Reference Gulley1987; Hailer Reference Hailer1902). A larger diversity of the qualities of supply is arguably an explanation of an increased price spread. This was an outcome of the rise of systematic breeding (Czembor et al. Reference Czembor, Bonjean and Angus2001) reflected in quotations, in The Economist, of new qualities of Baltic wheat in the 1870s.
Also noticeable in Figure 1 is that the monthly volatility in the dispersion of price quotations declined over time, indicating a more even supply through efficient markets. Calculated as the monthly deviations from 13-month averages of the spread (coefficient of variation), volatility decreased by one-half between the 1840s and the 1880s. Until 1873, occasional booms or spikes in wheat prices brought increases in the spread between ports, but thereafter volatility declined.Footnote 6
The story of the dispersion of prices between the Baltic ports is broadly the same for the other grains, with often a slightly smaller spread for rye prices and somewhat wider for barley and even more so for oats. Inevitably one concludes that the leveling of prices was related to the shipped quantities but another reason for the larger spread and less coordinated changes of prices in oats and barley might be quality differences. Cheaper fodder grains may be mixed up with both oats and barley for human consumption.
THE DATA
We use a previously unexploited set of monthly grain price quotations contained in the Swedish consular reports from Baltic Sea ports over the years 1841–1888 and for some ports until 1893.Footnote 7 As usual for such quotations, they list maximum and minimum prices from which we calculate the average. It is remarkable that this information was collected over such a long time without being further disseminated in print but seems only to have been an input for analyses in the Swedish Foreign Office. We do not think it far-fetched to presume that these quotations reflected information that was widely known by the community of traders and shippers.
From 1840 to1880, most of the Baltic grain exports went to England with London as the major market. In order to analyze the co-movements between wheat prices in the Baltic ports and London, we have collected London wheat price quotations published in the weekly issues of The Economist. From 9 September 1843 and running until 22 September 1883, we collected a series of prices of wheat from Danzig and Königsberg which has been extrapolated, with American Red Winter, until end of June 1888. Often referred to are the “Gazette prices” which were reported in The Economist, with reference to “the London Gazette of last night,” and give the average price of all transactions for the week in the London corn market at Mark Lane. Since the composition of the transactions varied both over the short and the long term, the Gazette prices hide a quality problem, as noted by Thorstein Veblen (see Persson Reference Persson2004).Footnote 8 To avoid this problem we have constructed a series on quotations of “high mixed Danzig,” followed by “Danzig and Königsberg, high mixed and white,” and in the 1870s subsequently “Fine old” and “New” of the same origin. Given the complete integration in the London market (see the section on Mark Lane), we believe that the extrapolation of the Danzig-Königsberg series with the American wheat from 1883–1888 will not bias the comparison with the Baltic port prices.
The monthly time series for London is calculated as the averages of the weekly quotations. Even if the digitalized backlog of The Economist has excellent search functions, the print quality can be unreliable so we have cross-checked with different search-words in order not to miss available observations. But, some interpolation was necessary to obtain a complete data set. We interpolated up to a maximum of three weeks. Unfortunately, the years 1845–1847 contain some gaps exceeding three weeks and in this case to fill the gaps we have extrapolated with the Gazette prices.
For the Baltic ports, quality differences are of less importance, since we analyze the co-movements and not price levels. However, to the extent that quality varied across time and ports, it would lead to an under-estimation of the market integration. The relative price differentials between the ports, according to the Swedish consular reports, were relatively stable over time and it is reasonable to take this stability as a reflection of longstanding quality differences. At least in 1889, when the unit quoted changed from volume to weight, it can be shown that these price differentials largely can be explained by quality differences.Footnote 9 With the emergence of systematic breeding, variations in quality probably became more frequent, which may affect the results by reducing the estimated degree of integration.
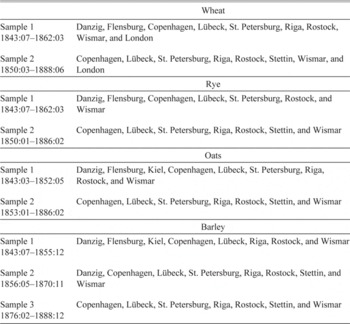
The Baltic data set also contains missing values. Most often only one observation (month) is missing but sometimes up to three months have been interpolated. There are a few longer gaps exceeding three months but these have not been interpolated. Instead we have constructed two samples for each grain type for which we have continuous time series for all ports included in the respective samples. The first data sample covers the period from the early 1840s to the 1850s or 1860s depending on the grain type and the second sample covers the period from the early 1850s to the mid or late 1880s. Some ports are included in both samples, while others are only included in one sample. For barley, missing data during the early 1870s prevented the construction of a continuous sample from the 1850s to the 1880s and we have instead constructed three samples for barley, the first sample covering the 1840s to 1850s, the second sample covering the 1850s to the 1860s, and the third sample covering the 1870s and 1880s. A detailed description of dates and ports for each sample are given in Table 1. The results from the two major samples are not directly comparable because they contain two different sets of ports. To test for structural change over time, we split the longer second sample into two sub-samples. The first sub-sample includes the 1850s and the 1860s and the second sub-sample the 1870s and the 1880s.Footnote 10
SAMPLE DESCRIPTION: TIME PERIODS AND PORTS

Note:
In the empirical analysis Sample 2, for wheat, rye and oats, is also divided into two sub-samples. Sub-sample 2:1 ending with 1869:12, and sub-sample 2:2 starting with 1870:01.
Source:
Consular Reports and The Economist.
ESTIMATING THE DEGREE OF MARKET INTEGRATION
According to the Law of One Price, identical goods will have the same price in all markets, otherwise arbitrage profits are possible. We can, therefore, test if markets are integrated by testing if prices are equal across markets. However, some price differences may persist even if markets are fully integrated due, for example, to transportation costs or quality differences. An alternative test of market integration is to analyze the degree of co-movement in prices. According to this approach, prices across markets move together when markets are integrated, although a persistent difference in price levels can exist.
Several different tests of market integration based on co-movement of prices have been proposed (for a summary see, e.g., Federico Reference Federico2012). One of the recent contributions is a dynamic factor model (see Uebele Reference Uebele2011, Reference Uebele2013). The dynamic factor model has several advantages compared to other commonly used methods. Perhaps the most important advantage is that is can be used to address “how much integrated?” Whereas most tests only analyze if markets are fully integrated versus not integrated, a dynamic factor model allows the degree of market integration to be estimated. The factor model separates between common price fluctuations and idiosyncratic price fluctuations. Theoretically, in fully integrated markets the common factor explains 100 percent of the price variations while in completely independent markets the common factor explains 0 percent of price variations. As markets become more integrated, the share explained by the common factor will increase. This creates a simple metric showing the pattern and degree of integration. In practice, though, it is unlikely that markets are 100 percent integrated and we return later in the empirical section to the question of how close to 100 percent should mean “fully integrated.”
Although the dynamic factor model has several desirable properties, it does not take into account one important aspect of market integration—time horizons. Information flows and the resulting arbitrage trade that equalize prices take time. It is probable, therefore, that markets are more integrated over the long term than over the short term. As is indicated by Figure 1, the coefficient of variation does not only vary due to short-term monthly jumps in the data but also shows persistent cyclical variation—cycles that appear to last at least up to two years. Statistically the separation between short- (and possible medium-term) and long-term effect is not trivial (Federico Reference Federico2012). When the short-run and the long-run processes are different, the choice of data frequency influences the results (see, e.g., Engle Reference Engle1974; Corbae, Ouliaris, and Phillips Reference Corbae, Ouliaris and Phillips2002; Andersson Reference Andersson2008, Reference Andersson2011). The results are dominated by the short-run process when high frequency data (i.e., weekly, monthly, or quarterly data) are used in the analysis and the results are dominated by the long-run process when low frequency data (yearly data or five or ten year averages) are used. The empirical results are thus sensitive to the choice of data frequency or the length of the averages. Yet the effect of different time horizons on market integration is not commonly considered.
Similar to Martin Henning, Kerstin Enflo, and Fredrik N.G. Andersson (Reference Henning Martin and Andersson2011) and Andersson, Sonja Opper, and David Edgerton (Reference Andersson, Opper and Edgerton2013), we create a test for market integration by combining wavelet analysis and a dynamic factor model. By using wavelet methods we can decompose the data into different time horizons from the short to the long-run. Once the data have been decomposed, we estimate one dynamic factor model for each time horizon. We then construct a measure of market integration for each time horizon using the results from the dynamic factor model. This approach allows us to test how integrated the ports are and how quickly they respond to common price movements. Overall this method is more explorative compared to other methods and lets the data tell rather than being constrained by restrictive assumptions.
Separating between several different time horizons is difficult in the time domain but easy in the frequency domain where each band of frequencies represents a given time horizon. High frequency data, as noted above, capture the short-run variation and the low frequencies capture the long-run variation in the data. A problem with the frequency domain is that it contains no time resolution and therefore does not allow for structural changes in how prices and markets behave. An alternate domain is the wavelet domain that is a combination of the time and frequency domains (Percival and Walden Reference Percival and Walden2006).
To transform the time series from the time domain to the wavelet domain, we use the Maximal Overlap Discrete Wavelet Transform (MODWT).Footnote 11 The MODWT is essentially a band pass filter, which unlike many other filters, combines both time and frequency resolution. It can be applied to time series data that contain structural breaks, outliers and other non-recurring events without having to pre-whiten the data (Percival and Walden Reference Percival and Walden2006). Controlling for outliers is an especially important feature of the MODWT. Outliers impact the analysis and can, in some cases, be the main driver behind the statistical results. Due to the statistical properties of the MODWT, outliers will only affect the results for the short run but not for the more persistent price changes.
Our test for market integration is constructed in the following way: let P
it
be the price for port i at time t and let  such that log price difference is
 . With monthly data, the MODWT decomposes the price series into six frequency bands.Footnote
12
These frequency bands represents cyclical variations over 2 to 4 months (the highest frequency band), 4 to 8 months, 8 to 16 months, 16 months to 32 months, 32 months to 64 months and a trend (lowest frequency band) that captures prices changes over 64 months and beyond.Footnote
13
Specifically the prices series are decomposed,

where D 1 it to D 6 it are the respective frequency band components, that is, they represent the respective time horizons. A dynamic factor model is then estimated for each time horizon separately following the approach by Jushan Bai and Serena Ng (Reference Bai and Serena2002). Specifically, the price variations at the different time horizons, D jit , are modeled as a common factor and an idiosyncratic component,

where α ji is a port specific constant at frequency band j, α jif are market specific loadings for dynamic factor and ε jit are idiosyncratic price movements. By construction, the dynamic factor and the idiosyncratic shocks are independent whereby the following decomposition of the price variation is possible,

The more integrated the ports are, the more of the variance is explained by the common factor. Using the share  we thus have an estimate of how integrated a market of ports is for each frequency band (i.e., time horizon). The estimate takes a value between 0 and 1 where 0 implies no market integration and 1 complete market integration.
MARK LANE AS A YARDSTICK FOR FULL MARKET INTEGRATION
Before analyzing the degree of co-movement of prices in the Baltic Sea region we start with an account of the co-movement of wheat prices in the London corn market to obtain a yardstick for comparison. On Mark Lane distance was irrelevant and information was extremely good, communicated not only in encounters among the traders but also reported in the press. We expect this to be an integrated market and thus use the results from Mark Lane as a yardstick for complete market integration. It should be noticed that we use wheat of different origins and qualities to control for diverging supply effects in the idiosyncratic component.
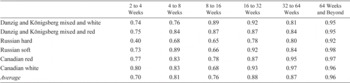
Table 2 reports the degree of market integration or the share of the variation explained by the common factor, for six different varieties of wheat in the London corn market. The sample consists of weekly average prices from 1853 to 1855.Footnote 14
ESTIMATES OF MARKET INTEGRATION IN THE LONDON MARKET

Note:
All Market integration estimates are statistically significant at the 5 percent level.
Source:
Own estimations on the Economist.
Table 2 reveals two main results. Among wheat varieties Russian Hard is less integrated than Russian Soft and other kinds of wheat. We conjectured that this is due to its less homogeneous quality, which is also suggested by the larger variation in its price. Russian Hard and Russian Soft were cheaper than those shipped from other ports. Prices of Russian wheat were more than 15 percent below wheat from Danzig in the 1850s and a significant price gap was maintained by the end of the sample (1883). It is likely that Russian Hard varied in quality between shipments which increased the idiosyncratic component in its price changes.
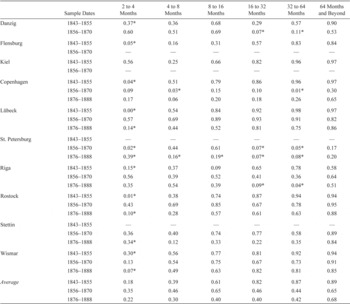
Second, Mark Lane was more integrated for the longer time horizons compared to the shorter time horizons. Approximately two-thirds of the price variation is explained by the common factor for the shortest time horizon (two to four week long variations). For eight to 16 weeks, corresponding to the shortest time horizon in the Baltic samples, the share increases to three-quarters. For the longest time horizon of 64 weeks and beyond, the share of the variation explained by the common factor is 96 percent. Based on these results we take 70 percent as a yardstick for full market integration for the shortest time horizon (up to four months) and 85 percent as the yardstick for the longer time horizons when testing for market integration among the Baltic ports. The slightly lower values of the yardstick than the values in Mark Lane should allow for the probability for unrelated quality variations in the somewhat larger sample of quotations from the Baltic ports.
MARKET INTEGRATION OF WHEAT AND RYE MARKETS IN THE BALTIC SEA REGION
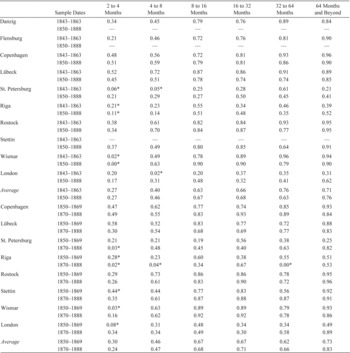
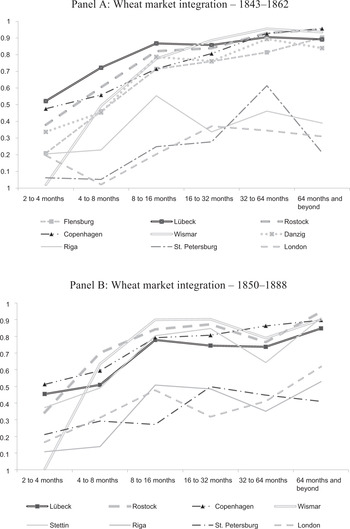
Estimates of market integration for wheat are reported in Table 3 and illustrated in Panels A and B in Figure 2. Overall the results for the earlier and later periods are similar despite the fact these two samples include somewhat different set of ports. Not unexpectedly, the ports in the Baltic Sea region are less integrated than the different kinds of wheat traded in Mark Lane with the differences larger for the shorter time horizons than for the longer time horizons. St. Petersburg, Riga, and Wismar are not at all integrated with the other markets for the shortest time horizon (two to four months). For the other time horizons all markets were more integrated although the degree of integration is smaller than our Mark Lane yardstick.
WHEAT MARKET INTEGRATION ESTIMATES

Note:
All market integration estimates are statistically significant at the 5 percent level except those marked with an asterisk.
Source:
Own estimations on Consular Reports and the Economist.
WHEAT AND RYE MARKET INTEGRATION


How integrated the ports were with the other ports is partly, but not fully, correlated with their geographical location.Footnote 15 Ports in the geographical center of our sample, Copenhagen, Lübeck, and Rostock, stand out as approaching full integration across almost all time horizons. The ports on the geographical periphery, both to the West (London) and the East (Riga and St. Petersburg) were less integrated compared to the ports in the geographical center.
To test for structural change over time, we split the longer Sample 2 into two sub samples: sub-sample 2:1 covers the period from March 1850 to December 1869 while sub-sample 2:2 covers from January 1870 to June 1888. We refrained from splitting Sample 1 into sub-samples because it covers a relatively short time period. The results for the two sub-samples are reported in the bottom one-half of Table 3.
London and St. Petersburg, but not Riga, became more integrated over time. London even becomes fully integrated with the Baltic ports for the most persistent price movements (64 months and beyond) by 1870–1880, while St. Petersburg falls just short of being fully integrated (the estimated market integration is 0.82 compared with the yardstick for full market integration of 0.85). For the shorter time horizons, the average market integration of the Baltic ports and London remains somewhat below the yardstick set by Mark Lane also for the later period.
The different patterns of integration for St. Petersburg and Riga reflect developments of their wheat exports. While shipments of wheat from St. Petersburg rose from about 45,000 tons in the first one-half of the 1860s to more than 300,000 tons in 1881–1885, wheat shipments from Riga remained at 10,000 over five year periods (Gulley Reference Gulley1987). For London, the relative importance of Baltic wheat may have diminished, although the volumes remained high enough to benefit from the generally increasing market efficiency.
The results for rye are broadly similar to those for wheat. St. Petersburg and Riga were more integrated compared to the wheat market. See Table 4 and Panels C and D in Figure 2. The share of the variance explained by the common factor is higher for the more persistent price movements: averages about 85 percent in both samples showing fully integrated markets in the long run. Similar to wheat, market integration was lower in the shorter-term price movements.
RYE MARKET INTEGRATION ESTIMATES

Note:
All market integration estimates that are statistically significant at the 5 percent level except those marked with an asterisk.
Source:
Own estimations on Consular Reports.
Again, shipped volumes reflect the degree of market integration. For St. Petersburg shipments of rye were small and similar to those of wheat. Riga, on the other hand, which had insignificant shipments of wheat, increased its exports of rye from 10,000 tons in 1861–1865 to 138,000 tons in 1876–1880 (Gulley 1987). Riga also became more integrated in the market for rye than in that for wheat.
Sample 2 is split into the same sub-samples to test for changes in market integration over time. The most significant change between the earlier period (1850s and 1860s) and the later (1870s and 1880s) is that Copenhagen goes from being fairly well integrated to less integrated at all but the longest time horizon. This contradictory development for wheat and rye in the case of Copenhagen suggests that changes in the market rather than changes in institutions were the cause. That is, institutional change would have affected wheat and rye alike while changes in cultivation and consumer preferences could and did differ between different kinds of grain. It also illustrates that market integration was not a continuous process that slowly led to increased integration of all ports. Although the overall trend was towards more market integration, some ports could become both more or less integrated over time depending on which kind of grain is considered.
MARKET INTEGRATION OF OATS AND BARLEY MARKETS IN THE BALTIC SEA REGION
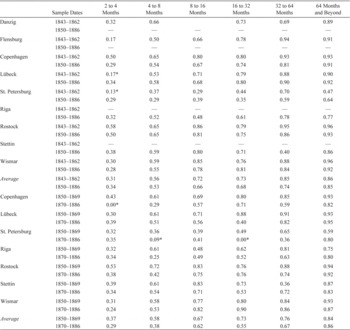
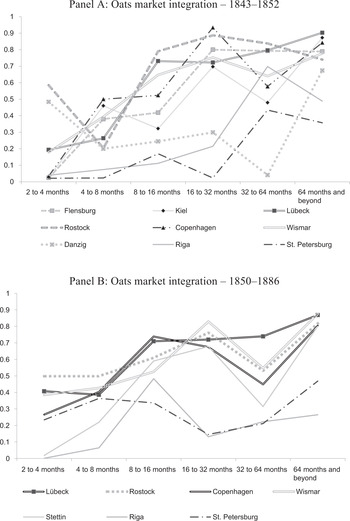
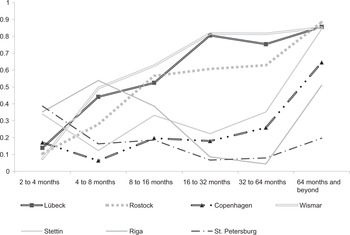
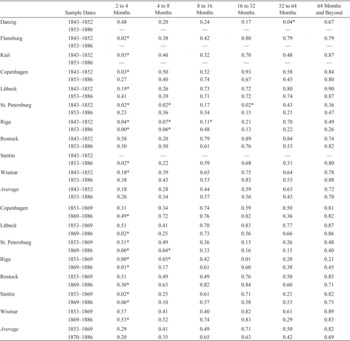
On average, the oats and barley markets were less integrated than the wheat and rye markets and fewer ports reach full market integration irrespective of sample period, see Tables 5 (oats) and 6 (barley), and Figures 3 and 4. For both the wheat and rye markets, ports in the geographical center were relatively highly integrated compared to those on the periphery. Danzig, moreover, which for both wheat and rye belonged to the center of relatively highly integrated markets, belongs to the less integrated periphery for oats and barley. The geographical area where markets were highly integrated is thus smaller for oats and barley compared with the geographical area for wheat and rye.
OATS AND BARLEY MARKET INTEGRATION


BARLEY MARKET INTEGRATION – 1876–1888

OATS MARKET INTEGRATION ESTIMATES

Note:
All market integration estimates that are statistically significant at the 5 percent level except those marked with an asterisk.
Source:
Own estimations on Consular Reports.
BARLEY MARKET INTEGRATION ESTIMATES

Note:
All market integration estimates that are statistically significant at the 5 percent level except those marked with an asterisk.
Source:
Own estimations on Consular Reports.
For oats, contradictory changes take place over time, which is evident in a comparison of the samples and subsamples. While Copenhagen and Wismar become integrated at levels close to those for wheat and rye, Lübeck and, to some extent, Rostock becomes less integrated. Thus, integration in the oats market is patchier and the eastern ports Riga and St. Petersburg did not become more integrated over time. Since both these ports had quite substantial shipments of oats, this result seems to refute that traded volumes are crucial for the market integration or co-movement of prices. However, oats was marginal in the German grain trade (Statistisches Reichsamt 1935). Oats shipments from St. Petersburg and Riga were largely destined for horse fodder in Britain (Fridlizius Reference Fridlizius1957). The spatial extension of the oats trade largely excluded German ports but included Swedish ports and ports of the eastern Baltic exporting to England. It is therefore reasonable that the common component for oats is small in our sample of ports.
For barley, because Sample 2 only covers the 1850s and 1860s, specific comparisons of changes in market integration over time cannot be made. Because it was not possible to construct a consistent set of price series covering the 1850s to the 1880s, we use three samples; one for 1843 to 1855, a second for 1856 to 1870, and the third from 1876 to 1888. Results from the three samples reveal even patchier integration than for oats. Some ports were fairly integrated for particular time horizons, notably Danzig in the first and second period, Riga in the second period, and St. Petersburg in the third. In Copenhagen the integration with the Baltic barley market was fairly high in the first period, became much less integrated in the second period, and approached the earlier level in the third period. For Copenhagen the different grains thus displayed different degrees of integration over time. Integration stayed high in wheat, declined in rye while it progressed in oats and had a reversal in barley.
These dissimilar patterns for different kinds of grain lends support to our interpretation that market changes, such as consumer preferences, farming technology, and transport facilities, play an important role. Had tariff policy or other regulations been the factor behind changes, a higher uniformity between the results for different grains would be expected. It is, therefore, reasonable to see the outcomes as results of market changes rather than institutions. In terms of the quantities traded, oats throughout our period made out less than 2 percent of the grain exported from Danzig (Franaszek Reference Franaszek2012). Meanwhile Sweden (for which we unfortunately lack comparable price data), became a major exporter but totally lost this position when out-competed by cheaper “Russian” oats in the early 1890s (Fridlizius Reference Fridlizius1957). Also in other grains significant restructuring between exporting ports and markets took place, as briefly mentioned in the beginning of the article. Theoretically, information and not traded volumes should have significance but in real life friction has a role and makes adjustment slower, in particular when not lubricated by actual transactions.
Barley and oats are the cheaper grains, priced at less than one-half or only one-third of wheat, and could only with a decrease of transport cost bear the freight rates of long-haul shipping. This would speak for progressing market integration in our period. However, quality differences are big for both barley and oats, depending on whether they should be used for fodder or human consumption, in the case of barley refined to beer. Before the growth of traded volumes gave way to standardization of supply, we can presume that quality changes had a larger impact on the price quotations and thus contributed to the patchy integration in oats and barley markets.
In summation, the results for oats and barley show that these markets were less integrated than wheat and rye markets and few ports achieved a high degree of market integration given the yardstick set by Mark Lane. Oats and barley show more variation than the results for wheat and rye, which indicate that these markets were less stable compared to the former markets.
MARKET INTEGRATION AND GEOGRAPHICAL DISTANCE
So far the results indicate that the degree of market integration was related to the geographical location of the port in relation to the other ports. Riga and St. Petersburg were less integrated with the geographical center irrespective of sample and the kind of grain. There are several reasons why distance can have an effect on the degree of integration. For example, the cost of transportation increases with the distance whereby the price difference between two ports has to be relatively large for arbitrage trade to yield any profits. Or, the flow of information was delayed by distance.
To test the hypothesis that distance is related to the degree of market integration we estimate the following cross-sectional model,

where distance is the distance in thousands of nautical miles from Lübeck.Footnote 16 Lübeck is chosen as the benchmark city against which we measure the distance because it had for a long time been a center in the Baltic trade and our results so far show that it is highly integrated with other ports in the region. To test if the degree of market integration is systematically different for any given time horizon due to other factors not related to distance, the time horizon specific dummy d n is introduced. It takes the value 1 for time horizon (frequency band) n = 1,…,5 and 0 otherwise. Also included in the model are interaction variables between the dummy variables and distance, d n distance i , to test if the distance is more or less correlated for some of the shorter time horizons compared with the longest time horizon. The effect of the distance for the respective time horizons is obtained by summing the parameter for distance with the parameter for the interaction variable between distance and the dummy.
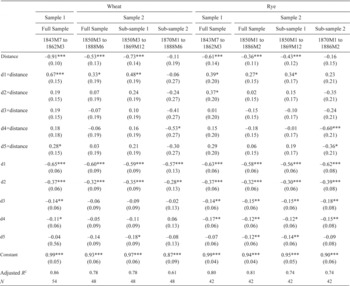
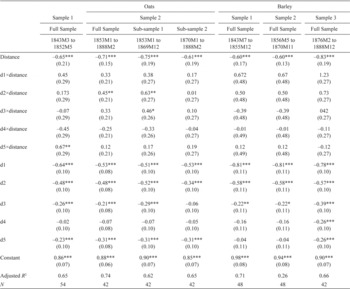
We estimate one model for Sample 1 and for Sample 2, as well as one model for each of the two sub-samples. The market integration estimate is bounded between 0 and 1 and the model is, therefore, estimated using a Tobit model. The results of the regressions for each kind of grain are presented in Tables 7 (wheat and rye) and 8 (oats and barley).
The time horizon specific dummy, d n , is negative and statistically significant for the two shortest time horizons (two to four months and four to eight months) for each grain and time periods. The dummy for the eight to 16 month time-horizon is significant and negative for rye, barley and oats, but not for wheat. The degree of market integration is thus systematically smaller for the shorter time horizons and this has nothing to do with distance.
REGRESSION OF MARKET INTEGRATION ON DISTANCE: WHEAT AND RYE

∗ = Significant at the 10 percent level.
∗∗ = Significant at the 5 percent level.
∗∗∗ = Significant at the 1 percent level.
Note:
Standard errors in parentheses.
Source:
Own estimations.
REGRESSION OF MARKET INTEGRATION ON DISTANCE: OATS AND BARLEY

∗ = Significant at the 10 percent level.
∗∗ = Significant at the 5 percent level.
∗∗∗ = Significant at the 1 percent level.
Note:
Standard errors in parentheses.
Source:
Own estimations.
The dummies have no significant effect for the longer time horizons, 16 months and beyond, and the average degree of market integration is thus the same for these time horizons. Although the degree of market integration is lower for the shorter time-horizons, it seldom approaches zero and even if ports were not fully integrated they share some co-movement. In other words, the degree of integration systematically increases until time horizons of 16 months and beyond when it reaches its maximum.
In each sample, distance has a significant and negative effect for all grain types. The effect of distance, moreover, is the same for all time horizons, that is, the interaction variable between the dummy and distance is insignificant except for the shortest time horizons for wheat and rye at the 10 percent significance level. For these two grains distance is less negative at the shortest time horizon. For the other time horizons, and for oats and barley irrespective of time horizon, there is no evidence that the effect of distance should vary across time horizons. Distance has a similar negative effect on all the market integration estimates irrespective of time horizon.
When we split Sample 2 into sub-samples we find that the significant effect of distance disappears for wheat and rye in the second sub-sample, but remains negative and of the same magnitude as in sub-sample 1 for oats and barley. Thus for wheat and rye, distance is not correlated to market integration after the 1860s. If increased market integration was a gradual and continuous process it is likely that we would find that the effect of distance disappears first for the longer time horizons and at a later stage in time for the shorter time horizons. Our results, however, show that distance loses its significant effect on market integration for all time horizons at the same time. Distance has no significant effect on market integration for any time horizon after the 1860s, with regards to wheat and rye. Thus instead of a continuous process where the effect of distance is reduced in small steps over time, we find a major break in the 1860s after which distance has no significant effect on wheat and rye market integration. The parameters for the dummy variables remain similar in both sub-samples. In short, the average degree of market integration is lower for the shorter time horizons irrespective of time period.
CONCLUDING REMARKS
Taken together, our results for the wheat and the rye markets indicate that the ports in the geographical center of our sample, from Flensburg in the West to Danzig in the East, were already relatively highly integrated by the mid-nineteenth century. Given the Mark Lane yardstick for market integration, some ports were approaching or had even achieved full market integration. Ports in the geographical periphery on the other hand were less integrated with the other ports, although the integration was never zero.
Despite centuries of Baltic grain trade, we can conclude that market integration by the mid-nineteenth century was geographically limited. German ports and Copenhagen had a fairly well integrated market with more eastern ports and London loosely connected. In other words, the Baltic Sea region was still incompletely integrated in the international or Atlantic economy. If not much changed in the German-Copenhagen region in the second one-half of the nineteenth century, its relations with St. Petersburg and London became more integrated.
Previous studies have shown that (e.g., considering Swedish butter) international integration may precede national integration (Ljungberg Reference Ljungberg1996). These studies points to the importance of traded volumes as a lever for market integration and price convergence. Swedish butter exports to England leveled prices between the south of Sweden, Copenhagen, and England before butter prices over all of Sweden had equalized. In grains, for which the national trade had begun earlier, Swedish market integration preceded that for butter by decades (Jörberg Reference Jörberg1972). The dissimilar developments of market integration between different grains emphasize the role of traded volumes rather than institutions in the Baltic region. Moreover, different patterns of integration, for different grains in the same port, emphasize the role of demand and supply. This suggests that institutional change may well be endogenous in the historical process of market integration and not constantly the ultimate cause.
We view the contributions of this article coming from three levels. First, as methodological contribution in that we use econometric methods that take account of both time horizon and space in the process of market integration and suggesting a comparative measure of market integration. Second, there is the historical contribution—placing the Baltic Sea region into the context of the nineteenth century international economy. In the latter one-half of the nineteenth century, market integration significantly progressed with the inclusion of peripheral areas into already integrated markets. Crucial in this development were the railways which greatly increased the supply of grains to the exporting ports. Third, we make a theoretical contribution on the role of traded volumes for market integration, which corroborate arguments about scale economies and market efficiency in the recent literature (Brautaset and Grafe Reference Brautaset and Grafe2006; Ejrnæs et al. Reference Ejrnæs, Persson and Rich2008).