Introduction
A quantitative microscopic understanding of the behavior of real materials under realistic conditions still presents a great challenge for atomic-scale modeling. Especially challenging are simulations of processes involving plastic deformation, fracture, wear, thin-film growth, or ion-beam etching, since they require an accurate description of strongly distorted atomic configurations with rapidly changing bonding conditions in large atomic ensembles containing thousands or even millions of atoms. Interatomic potentials suitable for description of such complex processes therefore must be both computationally efficient and reliable in the description of interatomic interactions.
One of the most successful families of interatomic potentials that has been able to stand the demanding requirement of simultaneous efficiency and reliability is the family of models based on the quantum-mechanical concept of bond order, introduced by CoulsonReference Coulson1 long before the advent of atomistic simulations. In the intuitive language of chemical molecular orbital theory, the bond order simply characterizes the strength of a chemical bond, since it corresponds to one-half of the difference between the number of electrons in the bonding and anti-bonding states. In the elementary H2 molecule, the bond order is equal to one since the bonding state is fully occupied by two electrons with opposite spins, while the anti-bonding state remains empty. In more complicated molecules or in solids, the bonds are usually not fully saturated due to the influence of the atomic environment, and, as a result, their bond orders are less than unified.
A more rigorous, quantitative definition of the bond order requires an introduction of some basic quantum mechanical terminology. The usual way to solve the one-particle Schrödinger equation

where Ĥ is the Hamiltonian operator, |n〉 are the single-particle eigenfunctions, and ε(n) the corresponding eigenvalues, is to convert it into a matrix eigenvalue problem. Following the chemically intuitive tight-binding (TB) model,Reference Pettifor2, Reference Finnis3 the eigenfunctions are expanded into a minimal set of localized atomic-like orbitals
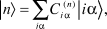
where i is a site index, α is an orbital index, and  is the expansion coefficient of orbital iα. It is assumed here for simplicity that the atomic-like orbitals |iα〉 are real and orthonormal. Combining Equations 1 and 2 obtains the secular equation
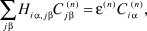
where the Hamiltonian operator is now expressed in the matrix form as Hia, j β = 〈iα|Ĥ|jβ〉 for orbitals iα and jβ. Using the well-known two-center parameterization of Slater and Koster,Reference Slater and Koster4 the inter-site elements Hi α, jβ can be expressed directly in terms of distance-dependent two-center integrals, which are also known as bond or hopping integrals. Typically, in semi-empirical TB approaches, the bond integrals are treated as fixed functions whose parameters are obtained by fitting to more accurate electronic structure calculations. The parameterization of the Hamiltonian matrix elements as functions of the atomic positions, which will be addressed later, is the most critical part of any TB model.
Using the previous notation, the bond order between orbitals |iα〉 and |jβ〉 is then given as

where ρi α, jβ are off-diagonal elements of the density matrix—a quantity known more commonly among the solid-state physics community. The sum runs over all occupied eigenfunctions n(occ). The factor of two accounts for spin degeneracy, but more general spin-unpaired formulations also exist.Reference Finnis3
Equation 4 presents a rigorous definition of the bond order within the TB theory. It enables expression of the total bond energy associated with the formation of chemical bonds as a sum over individual bonds
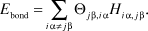
This deceptively simple equation is the defining equation for all bond order schemes. It shows that the strength of bonding is given as the product of pairwise bond integrals, which need to be parameterized, and bond orders, which need to be calculated. The major complication hidden in Equation 5 is that the bond orders are not pairwise quantities, but they generally depend on the positions of all atoms in the system. In standard TB approaches, the bond orders in Equation 4 are obtained by solving the secular Equation 3 by matrix diagonalization. However, this mathematical procedure is impractical for large systems, since its computational cost scales with the cube of the number of atoms, limiting the accessible size of the system under study to a few hundred atoms. The key idea of all classical interatomic potentials is to avoid the non-local solution and to express instead the bond order in Equation 5 via a short-ranged function of the positions of the neighboring atoms only. Naturally, the main reason for such a direct formulation is to gain a significant speed-up of the calculations, ideally reaching the linear scaling necessary for large-scale molecular dynamics simulations. However, it must not be forgotten that every local expression is an approximation to the exact TB solution based on the assumption that the strength of a chemical bond is mainly influenced by its local environment.
As detailed by Finnis in this issue, there are two ways to construct an interatomic potential. The first way is the artistic route of empirical design using chemical and physical insights together with convenient functional forms. The second alternative is the rigorous approach of a bottom-up derivation of the functional forms from a higher level theory, in our case TB. Both of these procedures have been applied in the construction of bond order expressions, and both approaches turned out to be largely successful. This success can be likely attributed to the general validity of the fundamental Equation 5. In this article, we provide an overview of many-body potentials constructed by following both routes—the artistic route of empirical design and the rigorous route of bottom-up derivation. Both routes have their virtues and their weaknesses, but, more importantly, it will be shown that they do not diverge but rather seem to approach each other.
Before going into details, it must not be forgotten that the total binding or cohesive energy of an atomic ensemble is not equal just to the sum of individual bond energies. In addition to this major attractive contribution, there are other terms that depend on the material under study and its bonding character. In a general case, the total binding energy E B can be written as

where E rep is a repulsive energy arising from the overlap and electrostatic repulsion of the atoms, E prom is the promotion energy reflecting the change of the hybridization state on bonded atoms with respect to their atomic ground states, E mag is the magnetic energy contribution associated with the formation of magnetic moments on atoms, E ion is the ionic energy in polar bonding environments where there is a net charge transfer between the atoms, and E vdW is the weak van der Waals contribution. The majority of the models described here deal with dense covalent and metallic materials, in which the last two contributions in Equation 6 can be neglected. Thus, in this article, the ionic and van der Waals bonding are excluded hereafter.
In addition to describing the underlying concepts of various bond order schemes, we will present several applications from our own studies on tribology and plasticity in order to demonstrate the robustness and predictive power as well as the limitations of existing models.
Abell-Tersoff-Brenner: Empirical formulations for the bond order
The history of empirical bond order schemes is usually thought to start with the work of Abell,Reference Abell5 who suggested an expression of the universal binding energy relations in solids using a bond order function. Soon after Abell, Tersoff proposed an explicit expression for the bond order and applied it to silicon.Reference Tersoff6 The resulting interatomic potential turned out to be remarkably transferable to a wide range of silicon allotropes and was later parameterized also for carbon and silicon-carbon interactions.Reference Tersoff7
In Tersoff’s potential, the bond and repulsive energy are given, respectively, as

Both the bond integral hij and the repulsive potential Vij are pairwise functions that depend on the interatomic distance Rij between the atoms i and j only and are required to become zero before the second-neighbor shell in the ground-state crystalline structure. In contrast, the expression for the bond order is a many-body function, which contains both distance and angular dependent terms. Despite its empirical nature, Tersoff’s expression for the bond orderReference Tersoff8 has been shown to be extraordinarily flexible and has been used to construct interatomic potentials for a number of systems (e.g., Al-N,Reference Kioseoglou, Komninou and Karakostas9 B-C-N,Reference Matsunaga, Fisher and Matsubara10–Reference Albe, Möller and Heinig12 C-O,Reference Ni, Lee and Sinnott13 Fe-C,Reference Henriksson and Nordlund14, Reference Müller, Erhart and Albe15 Si-C,Reference Tersoff6, Reference Tersoff7, Reference Erhart and Albe16 W-C,Reference Juslin, Erhart, Träskelin, Nord, Henriksson, Nordlund, Salonen and Albe17 Ga-As,Reference Hammerschmidt, Kratzer and Scheffler18 and Zn-O).Reference Erhart, Juslin, Goy, Nordlund, Müller and Albe19
A few years after Tersoff’s initial work, Brenner presented a parameterization for hydrocarbons, which was later named as the reactive empirical bond order (REBO) potential.Reference Brenner20, Reference Brenner21 Brenner realized that Tersoff’s initial functional form was too simplistic to describe the wide variety of bonding situations and the complex chemistry found in hydrocarbons. He proposed to correct the potential based on look-up tables whose entries were selected by the coordination numbers Ni and an additional variable  describing the conjugation state of bond i–j. The set of numbers
 can be regarded as a fingerprint of the local chemical environment that reaches out to second-nearest neighbors, making the potential effectively longer-ranged than that of Tersoff. The second-generation of Brenner’s potentials (REBO2),Reference Brenner, Shenderova, Harrison, Stuart, Ni and Sinnott22 published about 10 years later, further improved the description of crystalline bulk phases and π-bonded molecules by modifying the conjugation parameter
 and by adding a dihedral energy contribution that penalizes the rotation of adjacent hydrocarbon groups, such as the C–C bond rotation in ethylene. Another extension of the REBO formalismReference Stuart, Tutein and Harrison23 included an expression for E vdW for modeling of the liquid and vapor phases in which non-bonded interactions become important.
The REBO potentials enabled the study of carbon in a broad range of bonding environments (e.g., diamond, graphite, fullerenes, nanotubes, simple polymers, diamond-like carbon, carbynes) and processes involving subtle structural variations. One of the first successes of the original REBO was the prediction of the dimer opening process on the (001) (2 × 1) diamond surface that was believed to play a crucial role in the chemical vapor deposition growth of diamond.Reference Garrison, Dawnkaski, Srivastava and Brenner24 Since then, the family of Abell-Tersoff-Brenner (ATB) potentials has been used extensively in simulations of vapor deposition processes of diamondReference Eckert, Neyts and Bogaerts25 and amorphous carbon (a-C),Reference Moseler, Gumbsch, Casiraghi, Ferrari and Robertson26, Reference Jäger and Albe27 irradiation damage in silicon,Reference Pastewka, Salzer, Graff, Altmann and Moseler28 friction of polymers,Reference Mikulski, Herman and Harrison29 mechanical properties of carbon nanotubes,Reference Buongiorno Nardelli, Yakobson and Bernholc30 and graphene,Reference Neek-Amal and Peeters31 to name a few examples.
Despite these numerous successes, ATB potentials have been known to fail under certain circumstances. One of the most apparent failures occurs when the bonds are significantly stretched beyond their equilibrium distances, for instance, under large external loads or in the vicinity of the crack tip.Reference Marder32Figure 1a shows a crack tip in diamond simulated with REBO2. Instead of crack tip propagation, as expected for a brittle material, the potential predicts the crack to emit dislocations and blunt. A similar failure of the REBOs is observed for the fracture of carbon nanotubes and graphene.Reference Pastewka, Pou, Pérez, Gumbsch and Moseler33
Panels (a) and (b) show examples where REBO2 gives unphysical behavior that is cured by using REBO2+S. In a dynamic simulation, a crack in diamond blunts (a), but propagates (b) at identical strain in REBO2+S. Panels (c) and (d) illustrate the origin of this failure from the carbon dimer potential energy landscape. Panel (c) shows that the potential energy E(R) = V(R) – h(R) = (V 0(R) – h 0(R))fC(R) drops more rapidly with dimer length R as the cutoff radius r 2 is decreased. The more rapid this drop, the larger the respective force shown in panel (d). The force required to break the dimer is the maximum of the force curve. The insets show the value (e) and derivative (f) of the cutoff function fC. The cutoff function is unity below radius r 1 and drops to zero at r 2. The original REBO2 formulation uses r 2 = 2.0 Å (blue lines). Adapted from References Reference Brenner, Shenderova, Harrison, Stuart, Ni and Sinnott22 and Reference Pastewka, Pou, Pérez, Gumbsch and Moseler33. V(R), repulsive potential; h(R), bond integral; V 0(R), asymptotic potential; and h 0(R), asymptotic bond integral.

It is important to stress that this unphysical behavior does not imply the failure of the bond order concept. It simply originates from the applied fitting scheme that assumes that the bond integral h(R) and the repulsive potential V(R) are rather short ranged in order to minimize the computational load.Reference Pastewka, Pou, Pérez, Gumbsch and Moseler33 This “shortsightedness” is enforced by multiplying the asymptotic h 0(R) and V0(R) with a cutoff function fC(R) that drops from unity to zero between first- and second-nearest neighbors in the equilibrium diamond structure. Figure 1c–d shows the effect of the cutoff function (shown in Figure 1e–f ) on the energetics of a carbon dimer. A steep drop in the energy enforced by fC leads to a peak in the force that is substantially larger than the force from the potential without cutoff.Reference Gumbsch, Shibutani and Ogata34 This overestimation favors dislocation nucleation over brittle fracture in crystalline carbon allotropes.Reference Pastewka, Pou, Pérez, Gumbsch and Moseler33
A common cure for the force overestimation problem is the truncation of forces instead of energies. It was first used in studies on fracture of polycrystalline diamondReference Shenderova, Brenner, Omeltchenko, Su and Yang35 and later rediscovered for fracture of silicon.Reference Mattoni, Ippolito and Colombo36 However, such an approach has the disadvantage that the force-field becomes non-conservative, thus prohibiting the reforming of bonds.Reference Daw and Baskes37 These problems can be fixed by implementing an empirical screening function approachReference Pastewka, Pou, Pérez, Gumbsch and Moseler33, Reference Baskes, Angelo and Bisson38, Reference Baskes39 to limit the interaction to the first-nearest neighbor shell while allowing the bond lengths to vary smoothly over a longer range. The idea behind this method is that two atoms interact as long as there is no third atom in the bonding area that screens the interaction.
This scheme was transferredReference Pastewka, Pou, Pérez, Gumbsch and Moseler33 to Brenner’s REBO2 to limit its interaction range using the screening function first published in Reference Reference Baskes, Angelo and Bisson38. Briefly, the bond integrals become hij = h 0(Rij)Sij, where Sij is a many-body term that accounts for the loss of bond strength due to the screening effect of neighboring atoms. Since this term depends on the ratios of distances only, the unphysical length scale, which is introduced in a distance-based cutoff formulation, is replaced by a scale-invariant ellipsoid with a fixed ratio of the axes’ lengths. While this approach is completely empirical in nature, it leads to an overall functional form similar to environment-dependent screening functions used in orthogonal TB (OTB) formulations.Reference Tang, Wang, Chan and Ho40, Reference Haas, Wang, Fähnle, Elsässer and Ho41
Nguyen-Manh et al. rigorously showed that a non-orthogonal Hamiltonian can be reduced to an orthogonal Hamiltonian with such environment dependence,Reference Nguyen-Manh, Pettifor and Vitek42 giving a justification for using screening functions in related schemes.
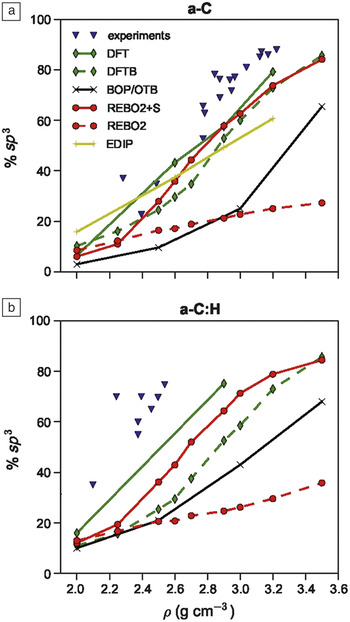
The “screened” REBO2 formalism, which is referred to as REBO2+S in the following, corrects the fracture problem (see Figure 1b). Surprisingly, it also significantly improves the description of amorphous carbon (a-C) and hydrocarbon (a-C:H) phases. Figure 2 shows how the hybridization (i.e., the fraction of sp Reference Finnis3 coordinated atoms) changes as a function of the density in the two amorphous carbon materials. This extensive comparison contains experimental dataReference Ferrari, Libassi, Tanner, Stolojan, Yuan, Brown, Rodil, Kleinsorge and Robertson43 together with theoretical predictions of accurate density functional theory (DFT) calculations,Reference McCulloch, McKenzie and Goringe44, Reference Bilek, McKenzie, McCulloch and Goringe45 a non-orthogonal density functional-based TB (DFTB) model,Reference Porezag, Frauenheim, Köhler, Seifert and Kaschner46 orthogonal TB and related analytical bond order potentials that are discussed later in the text, the REBO potentials, and the purely empirical environmental-dependent interaction potential.Reference Marks47 While the original REBO2 severely underestimates the sp Reference Finnis3 content for high densities, the improved REBO2+S closely reproduces the quantum calculations.
Hybridization (fraction of sp Reference Finnis3 carbon atoms) as a function of density for (a) a-C and (b) a-C:H for different quantum and classical methods. Experimental data are results from Reference Reference Ferrari, Libassi, Tanner, Stolojan, Yuan, Brown, Rodil, Kleinsorge and Robertson43, density functional theory data for a-C and a-C:H is taken from References Reference McCulloch, McKenzie and Goringe44 and Reference Bilek, McKenzie, McCulloch and Goringe45, respectively, and environmental-dependent interaction potential (EDIP) data are taken from Reference Reference Marks48. Note that experimental films are obtained from plasma enhanced physical vapor deposition processes, while the simulated samples are quenched from liquid carbon, resulting in slightly different hybridization.

Bond breaking and making in carbon tribocontacts
The REBO2+S has enabled the study of crystalline and amorphous hydrocarbon systems under conditions where frequent bond-making and breaking events occur.Reference Pastewka, Moser, Gumbsch and Moseler49–Reference Pastewka, Moser, Moseler, Blug, Meier, Hollstein and Gumbsch52 Such conditions are often encountered in tribological contacts, either when pressure and sliding velocity are large enough for the material to wear down, or if the surfaces are chemically active.
Severe wear is typical for machining processes that form one of the pillars of modern technology. Despite their significance, microscopic models for most industrial machining processes are largely lacking.Reference Meng and Ludema53 One example of such a process is the polishing of diamond wherein the hardest known material, usually exploited to machine other materials, is actually worn down. The particular process that is used to polish diamonds has remained unchanged for at least six centuries. Yet the microscopic details have remained a mystery. In this process, the polishing wheel is a cast iron disc (the scaife) with embedded diamond grit. The grit particles stick out of the iron surface and slide against the gemstone as the scaife rotates,Reference Hird and Field54 leading to diamond polishing of diamond.
The first scientific investigation of this process dates back to the work of TolkowskyReference Tolkowsky55 in 1920. He concluded that the diamond gemstone fractures along low index planes, removing tiny chips of material. This explanation was later dismissed as high resolution microscopes became available and amorphous material was found besideReference van Bouwelen, Bleloch, Field and Brown56, Reference Feng and Field57 and later insideReference Konicek, Grierson, Gilbert, Sawyer, Sumant and Carpick58 the wear track.
Since diamond is pure carbon, it is an ideal candidate to be studied with the REBO potentials. Indeed, frictionReference Sinnott, Heo, Brenner, Harrison, Irving and Bhushan59, Reference Harrison, White, Colton and Brenner60 and mild wear situationsReference Harrison and Brenner61 were studied shortly after the inception of REBO. In the unscreened formulation, the REBO, however, is unsuitable for the study of diamond machining where atoms are torn from the surface such that bonds repeatedly break and form. Hence REBO2+S was applied to model the severe conditions of diamond wear using a molecular dynamics simulation.Reference Pastewka, Moser, Gumbsch and Moseler49
In these simulations, it was initially assumed that tribochemical mechanisms, previously observed by Harrison and Brenner,Reference Harrison and Brenner61 lead to a full dissociation of the surface termination. The residues of this process were modeled by a couple of adatoms placed between two pristine but unterminated diamond crystals that act as a seed for the destruction of the diamond. During sliding, pressureReference Pastewka, Moser and Moseler50 and temperatureReference Peters62 are controlled using specialized schemes that are designed for such tribosimulations. As sliding progresses, the system shears at the interface of the crystals, and each surface atom repeatedly forms and breaks bonds with continuously changing neighbors. A simple picture of this process is a layer of “pilot” atoms that move over the ordered phase, repeatedly pulling on the crystalline surface atoms. Since the amorphous environment of the “pilot” atoms changes over time, the pulling forces also change. A surface atom is then lifted into the amorphous phase when the pulling force happens to be larger than the force holding the surface atom to the crystal.
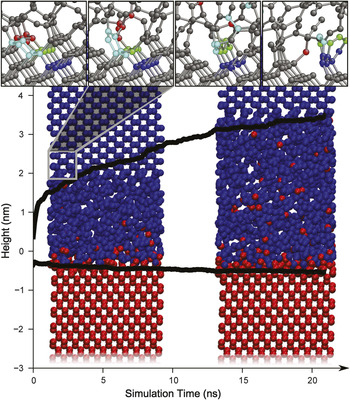
Surprisingly, different crystal orientations and sliding directions show different rates at which the atoms are lifted into the amorphous phase. Figure 3 shows the pairing of the {110} surface in the soft <100> direction, which is known to show high wear rates, with the “harder” {100} surface in the <110> direction. The coloration in Figure 3 allows identification of the crystallite of origin for each atom. From this information, it becomes clear that atoms from the {110} surface turn more quickly into the amorphous phase than atoms from the {100} crystallite. Since such anisotropy is also experimentally found in the wear rate,Reference Hird and Field54, Reference El-Dasher, Gray, Tringe, Biener, Hamza, Wild, Worner and Koidl63 it was concluded that the formation of the amorphous layer is the rate limiting step in diamond polishing. This layer is then removed from the diamond surface by plowing or chemical etching with ambient O2.Reference Pastewka, Moser, Gumbsch and Moseler49, Reference Moras, Pastewka, Gumbsch and Moseler51, Reference Moras, Pastewka, Schnagl, Walter, Gumbsch and Moseler64
A {110} diamond crystallite sliding at 20 m s–1 in the 〈100〉 direction (blue) against a {100} crystallite oriented along the 〈110〉 axis in the sliding direction (red). Colors indicate whether an atom was bound to the top or bottom crystallite initially. The {110} surface, which is known to show lower wear than the {100} surface, shows a lower rate of amorphization. Black solid lines show the position of the amorphous interface over the course of 20 ns. The snapshots shown are taken at 5 ns (left) and 17.5 ns (right), respectively. Insets show snapshots of the microscopic details of the wear process on the {110} surface. At the beginning of the simulation (time zero), the interface between the two crystallites is located at zero height. Adapted from Reference Reference Pastewka, Moser, Gumbsch and Moseler49.

These atomistic simulations have allowed unprecedented insights into the microscopic processes that take place. The inset in Figure 3 shows the progression of the atomic configuration on the {110} surface. As the “pilot” atoms move over the surface, the cyan 6-ring flips upright and is then subsequently integrated into the amorphous phase pulling along the following green and blue rows of atoms. This cascaded process is the reason why the amorphization is fastest on the {110} surface while sliding along the 〈100〉 direction. Since the reverse process is kinetically hindered, the amorphous phase grows, as shown in Figure 3. From this observation, a microscopic wear model based on the yield force to break C–C bonds can be derived.Reference Pastewka, Moser, Gumbsch and Moseler49
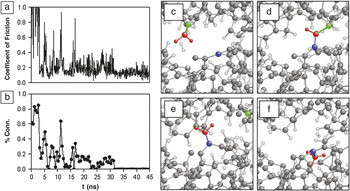
In a related example, REBO2+S was employed to study the frictional behavior of an amorphous hydrocarbon film,Reference Pastewka, Moser and Moseler50, Reference Pastewka, Moser, Moseler, Blug, Meier, Hollstein and Gumbsch52 which is widely used for low-friction wear-resistant coatings.Reference Robertson65 Surfaces that are “fresh,” in that they have not yet experienced any tribological loading, show a decrease in friction coefficient during the initial frictional cycles that is known as “running-in” (Figure 4). An initially high friction coefficient (>0.1) drops over a few frictional cycles until it reaches a value as low as 0.01Reference Enke66 or even 0.001.Reference Fontaine, Le Mogne, Loubet and Belin67 The mechanisms of this initial running-in are also poorly understood, although changes in topography due to plastic deformation have been proposed.Reference Fontaine, Le Mogne, Loubet and Belin67
(a) Friction coefficient of two a-C:H surfaces with 30 at.% H sliding at 20 m s–1 and 1 GPa normal pressure. (b) Connectivity, defined as the relative amount of time a chemical bond exists between two surfaces over periods of 0.5 ns. (c)–(f) Snapshots of a typical passivation event that leads to a reduction in connectivity involving bond-breaking and formation processes. (c) The methylene group (red atoms) bound to the upper surface (green atom) binds to the lower sliding surface (blue atom) in panel (d). Movement of the upper surface strains the carbon-carbon bonds that connect the methylene to the top and bottom surfaces. The weaker bond to the top surface finally breaks (e) and, subsequently, the methylene finds a binding position (f) within the bulk of the bottom surface leading to passivation. In panels (c) to (f), carbon atoms are displayed by large gray spheres, while hydrogens are smaller white spheres. Adapted from Reference Reference Pastewka, Moser and Moseler50.

In reproducing experimental conditions as closely as possible, these surfaces were initially grown in a simulated vapor deposition process. Two such surfaces were then paired and slid under boundary conditions similar to the diamond case. Contrary to diamond polishing, interest here lay in the behavior of the friction coefficient, shown in Figure 4a for a sample with 30 at.% H. Clearly, the friction coefficient fluctuates dramatically in the initial stages and saturates over the period of 45 ns shown. The coefficient correlates with a measure of chemical bonding between the surfaces, shown in Figure 4b. As the system is in a steady state (run-in) and the friction coefficient is low, no further chemical bond linking the top to the bottom surface is observed. The passivation mechanism at work here is similar to the amorphization process described previously. As the red atom in the upper surface in Figure 4c moves, it repeatedly forms and breaks chemical bonds with various substrate atoms. When it approaches the blue atom in the lower surface, which has the “pilot” function here, the bond that forms (Figure 4d) is stronger than the bond holding the red atom to the top surface, such that the atom is transferred from the top to the bottom surface as sliding progresses. Now the red atom is bound to the lower surface (Figure 4e), where it eventually fully binds by saturating its dangling bonds (Figure 4f).
The dynamics of the breaking and making of chemical bonds at the interface is hence crucial for understanding the fundamental processes in friction and wear, requiring by its very nature a chemically accurate interatomic potential. Since most potentials are fitted to ground-state properties, they naturally provide a proper description for configurations not far from equilibrium. However, in the two previous examples, it is the balance of forces between the “pilot” surface atom and the substrate atoms that needs to be correct. This also requires a fair description of the slopes of the interatomic potential energy landscape. The screening function approach corrects this behavior in the REBO potential. No adjustment of the original potential parameters is required after the screening functions are introduced, which shows that the correct asymptotics of the functions describing bond integrals and repulsive potential are obtained from these ground-state fits already. Indeed, Brenner and co-workers hinted at the unphysical nature of the cut-off function when describing their second-generation REBO and noted that “other more complicated schemes will be needed, perhaps including self-consistent bonding concepts”Reference Brenner, Shenderova, Harrison, Stuart, Ni and Sinnott22 to exploit the full potential of the model.
Coarse graining the electronic structure: Rigorous derivation of the bond order expansions
While the empirical ATB potentials have proven successful in many applications, they were also found to suffer from some fundamental limitations such as overbinding of radicals due to the inability to describe dangling bonds, poor treatment of π and conjugated bonds, and sometimes incorrect differentiation of bulk structures. As described previously, some of these shortcomings have been corrected in subsequent generations or parameterizations of the ATB potentials. However, those related to the empirical nature of the models (i.e., inappropriate functional forms or missing contributions) are sometimes difficult or even impossible to cure.
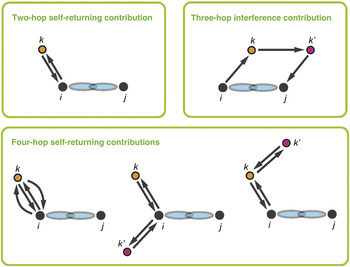
As stated in the introduction, it is possible to derive the functional form of a many-body interatomic potential directly from the rigorous quantum mechanics of the electrons. The first cornerstone for such a rigorous derivation was laid in the late 1960s by Cyrot-LackmanReference Cyrot-Lackmann68 and DucastelleReference Ducastelle and Cyrot-Lackmann69 who showed that within the TB framework, a connection exists between the moments of the local density of states (LDOS) on an atom and the topology of the lattice in terms of self-returning hopping or bonding paths starting on the same atom (see Figure 5).Reference Pettifor2, Reference Finnis3 This crucial link between the electronic and atomistic modeling hierarchies can be formally written as

A schematic diagram of hopping paths included in the fourth-moment expansion of the bond order. The bond order between atoms i and j depends on the two-, three-, and four-hop contributions to the neighboring atoms k and k’.Reference Pettifor and Oleinik76, Reference Mrovec, Moseler, Elsässer and Gumbsch80

where the pth moment,  , of the local density of states Di α(E) equals the pth moment of the Hamiltonian projected on the same orbital iα. The process of hopping on the lattice along closed paths of length p becomes more obvious when the previous equation is rewritten as

with Hi α,jβ describing the hop between orbitals |iα〉 and |jβ〉. The first moment consists of hops on a single site, the second of hops to the nearest neighbors and back, and so on. The more hops that are considered, the better the description of the LDOS obtained. Important here is that only moments higher than two provide information about the shape of the eigenspectrum. The simplest second-moment models, which sample the shells of nearest neighbors only, therefore can describe correctly the basic energetics associated with the electron occupation, but they cannot predict any properties related to the more subtle details of the electronic structure, for instance, the structural trends.Reference Pettifor2, Reference Finnis3
The second major breakthrough came in 1989,Reference Pettifor70 when Pettifor showed that the bond order can be written as a multi-atom expansion that depends not only on the self-returning hopping paths but also on the interference paths linking atoms i and j (see Figure 5). This fundamental development enabled derivation of explicit expressions for the bond order using a continued fraction expansion of the Green’s function matrix elements, and hence paved the way for a controlled and systematic construction of rigorous bond order potentials (BOPs). In the last 20 years, several BOP implementations have been developed for both metallic and covalent materials.Reference Horsfield, Bratkovsky, Fearn, Pettifor and Aoki71–Reference Finnis and Drautz73 These schemes mainly differ in the mathematical formalism of how the BOP expansion is carried out and truncated, depending on the bonding character of the material. Detailed presentations of these developments can be found in the original literatureReference Pettifor70, Reference Horsfield, Bratkovsky, Fearn, Pettifor and Aoki71, Reference Pettifor, Aoki, Moran-Lopez, Mejia-Lira and Sanchez74, Reference Alinaghian, Gumbsch, Skinner and Pettifor75 and several recent books and reviews.Reference Pettifor2, Reference Finnis3, Reference Finnis and Drautz73
In the present article, we want to briefly outline the analytic BOPs for sp valent systems,Reference Pettifor and Oleinik76–Reference Mrovec, Moseler, Elsässer and Gumbsch80 since they can be considered to be counterparts to the empirical ATB potentials. The analytic BOPs for hydrocarbons, developed by Pettifor and Oleinik about 10 years ago,Reference Pettifor and Oleinik76–Reference Pettifor and Oleinik78 contain the first theoretically derived expressions for both the σ and π bond orders, as well as the promotion energy. The analytic formula for the σ bond was obtained within the so-called symmetric four-level approximation as a function of two- and four-hop self-returning and three-hop interference contributions (see Figure 5). Interestingly, the second-moment term in the expansion turned out to be very similar to Tersoff’s empirical expression for the bond order, thereby providing insight and justification for the empirical ATB schemes.Reference Alinaghian, Gumbsch, Skinner and Pettifor75 However, it was also shown that the fourth-moment terms are essential for a reliable description of the σ bond orders in the whole range of carbon bonding environments, from molecules and open bulk phases to close-packed and amorphous structures, when compared to the exact TB results.Reference Mrovec, Moseler, Elsässer and Gumbsch80, Reference Oleinik and Pettifor81 The explicit π bond description presents another major improvement over the ATB potentials since it naturally leads to a proper treatment of conjugacy and rotation barriers in double, triple, and conjugated carbon bonds without any empirical correction terms.Reference Brenner, Shenderova, Harrison, Stuart, Ni and Sinnott22
In spite of their increased complexity, the analytic BOPs remain computationally efficient, as demonstrated in deposition simulations of amorphous carbon (a-C) and hydrogenated carbon (a-C:H) films.Reference Mrovec, Moseler, Elsässer and Gumbsch80 These large-scale simulations present a stringent test, since they describe film growth under non-equilibrium conditions of plasma deposition where the local atomic structure of the films is determined by breaking, stretching, and twisting of bonds induced by the impacting molecules. The study has shown that the key properties of the growing films, such as the density and the sp Reference Finnis3 content, depend sensitively on the energy of deposited species. These results are in qualitative but not fully quantitative agreement with available experimental observations,Reference Ferrari, Libassi, Tanner, Stolojan, Yuan, Brown, Rodil, Kleinsorge and Robertson43 according to which the sp Reference Finnis3 content of highly dense a-C:H films exceeds 80% compared to about 60% obtained in the BOP simulations. A detailed analysis of the amorphous structures revealedReference Mrovec, Moseler, Elsässer and Gumbsch80 that the primary reason for this problem lies not in the approximations used during the derivations of the bond order expressions but rather in deficiencies of the underlying OTB parameterization.Reference Xu, Wang, Chan and Ho82 As shown in Figure 2, both BOP and its underlying OTB model (their results are identical within the error limits) give a systematic underestimation of the sp Reference Finnis3/sp Reference Pettifor2 ratio in amorphous carbon structures. Hence, the BOP models inherit not only the strengths but also the limitations of the TB parameterizations on which they are based. In order to shift from qualitative to fully quantitative predictions, the quality of the TB models is therefore of outmost importance.
BOPs for transition metals and their compounds
Despite the notion of the metallic bond being delocalized, the bonding in technologically important transition metals and their compounds is, to a great extent, controlled by the d electrons that remain tightly bound to the atoms and form strong unsaturated covalent bonds. The bond order concept within the TB formalism is therefore well applicable for the description of energetics in the transition metal systems.
In contrast to covalent materials, higher-order (typically >4) moment expansions are needed for transition metals in order to obtain a sufficiently detailed representation of the LDOS that guarantees the correct prediction of structural trends among close-packed metallic structures.Reference Pettifor2 The reliable description of bonding is also crucial for reliable modeling of extended defects in these materials, since the angular character of the bonding often governs their structures and properties. Popular many-body potentials for metals based on the second-moment approximation to the density of statesReference Müller, Erhart and Albe15, Reference Daw and Baskes37, Reference Finnis and Sinclair83 (see the article by Foiles and Baskes in this issue) are known to fail in identifying subtle differences in properties of dislocation cores, grain boundaries, or surfaces in transition metals and their compounds.Reference Pettifor, Aoki, Gumbsch, Horsfield, Nguyen-Manh and Vitek84–Reference Chen, Mrovec and Gumbsch86
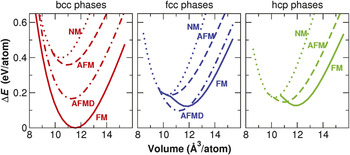
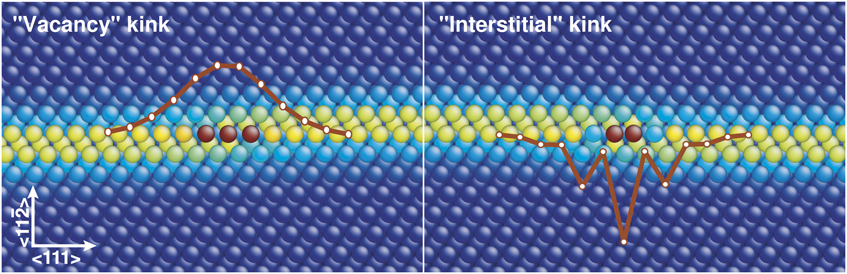
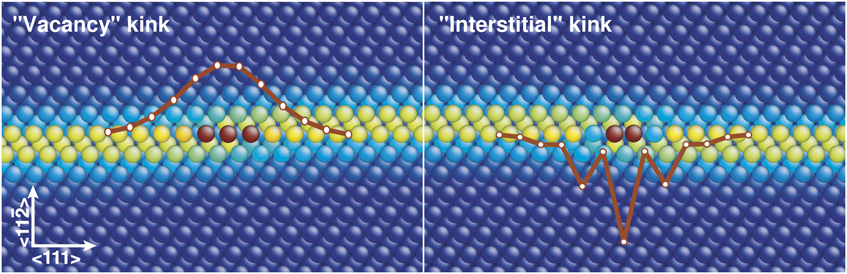
A number of BOPs for transition metals,Reference Mrovec, Nguyen-Manh, Pettifor and Vitek87–Reference Girshick, Bratkovsky, Pettifor and Vitek90 as well as transition metal compounds,Reference Znam, Nguyen-Manh, Pettifor and Vitek91 have been completed in the past decade. These potentials have been used extensively in studies of dislocation properties and their relation to macroscopic mechanical behavior.Reference Mrovec, Nguyen-Manh, Pettifor and Vitek87, Reference Mrovec, Gröger, Bailey, Nguyen-Manh, Elsässer and Vitek88 The simulations provided valuable atomistic insights and thus helped to resolve several outstanding and often unexpected features of plastic deformation such as the non-Schmid behavior of 1/2〈111〉 screw dislocations in bcc metals,Reference Vitek, Mrovec, Gröger, Bassani, Lacherla and Yin92–Reference Gröger and Vitek95 the unusual brittleness of fcc iridium,Reference Cawkwell, Nguyen-Manh, Woodward, Pettifor and Vitek96 or the origins of channeled flow in lamellar intermetallic TiAl.Reference Katzarov and Paxton97 Recently, the original BOP formalism was also generalized to magnetic materials, and the first magnetic bond order potential for iron has been developed.Reference Mrovec, Nguyen-Manh, Elsässer and Gumbsch98 The description of magnetic effects is of crucial importance, since ferromagnetism plays a dominant role in determining the stability of Fe bulk phases. Due to a correct description of bonding and the inclusion of magnetic interactions within the Stoner model of itinerant magnetism, the magnetic BOP is able to distinguish between various bulk magnetic phases of Fe (see Figure 6) and to correctly account for the collapse of magnetic moments as the structures are compressed.Reference Mrovec, Nguyen-Manh, Elsässer and Gumbsch98 This state-of-the-art potential is currently employed in atomistic studies of dislocation core structures under applied load, including the changes in local magnetic moments within the cores. Notwithstanding its quantum mechanical origin, the magnetic BOP is still computationally efficient to carry out large-scale simulations containing many thousands of atoms. This was demonstrated on studies of dislocation kinks that require fully 3D simulation blocks with large dimensions both perpendicular and parallel to the dislocation line.Reference Mrovec, Nguyen-Manh, Elsässer and Gumbsch98Figure 7 shows the predicted atomic structures of individual single kinks on the 1/2 〈111〉 screw dislocation in α-Fe. These kinks are termed as vacancy and interstitial due to local tensile and compressive regions in their centers, though the number of atoms in both kinks is the same. According to the BOP simulations, the two kinks have clearly distinct atomic and magnetic structures.Reference Mrovec, Nguyen-Manh, Elsässer and Gumbsch98 Despite its denser core, the interstitial kink was found to have a lower formation energy than the more spacious vacancy kink. This somewhat surprising result is related to the magnetic effects since the central atoms of the interstitial kink prefer to flip their magnetic moments to an anti-ferromagnetic state to lower their energies. As shown by the superimposed lines in Figure 7, these factors also lead to much larger and inhomogeneous variations of the bond lengths in the center of the interstitial kink than in the case of the vacancy kink, where only marginal changes of the local magnetic moments were observed. Additionally, BOP simulations show that the kink region is rather compact, which is in contrast to simulations carried out with the classical second-moment potentials.Reference Ventelon, Willaime and Leyronnas99 This result is most likely related to the central-force character of the potential that favors a conservation of atomic volumes rather than of bond angles.
Relative stabilities of Fe bulk phases predicted by magnetic bond order potential. NM, non-magnetic; FM, ferromagnetic; AFM, anti-ferromagnetic; AFMD, anti-ferromagnetic double layer; bcc, body centered cubic; fcc, face centered cubic; hcp, hexagonal close packed; and ΔE is the energy difference.Reference Mrovec, Nguyen-Manh, Elsässer and Gumbsch98

Atomic core structures of kinks on the 1/2 〈111〉 screw dislocation in Fe. The coloring of atoms represents local distortions of atomic environment: the yellow atoms mark the dislocation core, and the red atoms are the kink core atoms. The superimposed curves show the relative increase and decrease of the nearest-neighbor bond lengths along the dislocation line in the vacancy and interstitial kinks, respectively.Reference Mrovec, Nguyen-Manh, Elsässer and Gumbsch98
The examples presented here demonstrate that BOPs for transition metals are a mature and full-featured scheme that can capture subtleties of chemical bonding and still be applied to studies of complex defect configurations in large atomic ensembles exceeding 10Reference Abell5 atoms.
Summary and outlook
Many-body interatomic potentials based on the concept of the bond order are powerful tools for exploring the behavior of real materials. As we have described previously, simulations at the atomic scale can yield remarkable insights into experimentally inaccessible microscopic processes. In some situations, such “nanoscale” simulations can even help to explain macroscopic phenomena, such as plastic deformation or wear. For the bond order potentials to become even more useful for engineering purposes, the accessible length and time scales need to be further extended beyond the nm and ns, respectively, for instance, by incorporation into multiscale modeling schemes or by efficient implementation on massively parallel computers. As discussed by Plimpton and Thompson in this issue, higher computational cost—typical for bond order schemes—usually means higher parallel efficiency. Nevertheless, efficient parallel implementations of advanced bond order potentials, which involve multiple hopping paths to distant neighbors, will probably require more involved parallelization strategies than those used in the existing molecular dynamics codes.
Apart from these rather technical issues, probably the main scientific challenge that lies ahead is to cover a broader range of the periodic table, since most technologically important materials are compounds, alloys, or composite materials. Among the best examples are modern steels that have both complicated microstructure and chemistry. The bare minimum of elements needed for realistic steel simulations include Fe and C, several transition metals such as Cr, Mo, Mn, or Ni, and possibly also O, H, and other non-metallic elements.
Empirical potentials for multi-component systems, including those where significant charge transfer occurs, have been developed in recent years (see References Reference Henriksson and Nordlund14, 100–102, and the article by Shin and co-workers in this issue). However, there is always a significant risk of failure when these models are applied to situations far from their proven fitting pools. For example, the charge transfer schemes employed in such multi-component potentials typically treat covalent systems as if they were metals.Reference Shan, Devine, Hawkins, Asthagiri, Phillpot and Sinnott102 This leads to a wrong scaling of polarizabilities with system size.Reference Verstraelen, van Speybroeck and Waroquier103 The number of possible cures, such as a modification of model parameters or an addition of further terms, is limited and becomes more difficult to apply the more complicated the models are.
Significant progress has been achieved with rigorous bond order potentials (BOPs) and tight-binding (TB) models, but their fitting may also be elaborate, in particular when multiple chemical elements need to be considered simultaneously. TB bond and overlap integrals can, in principle, be obtained directly from first-principles calculations by utilizing a suitable minimal basis of atomic orbitals. Several approaches have been proposed in the past,Reference Porezag, Frauenheim, Köhler, Seifert and Kaschner46, Reference Andersen and Jepsen104–Reference Qian, Ju, Qi, Wang, Chan, Yao, Ho and Yip106 and some of themReference Nguyen-Manh, Pettifor and Vitek42, Reference Nguyen-Manh, Pettifor, Cockayne, Mrovec, Znam and Vitek107, Reference Nguyen-Manh, Vitek and Horsfield108 have been used for a systematic determination of TB and BOP parameterizations. The magnetic BOP for iron presented previously was parameterized using a novel projection scheme developed by Meyer and co-workersReference Urban, Reese, Mrovec, Elsässer and Meyer109 that is based on simultaneous optimization and projection of atomic-like orbitals on self-consistent density functional theory wave functions. The method is universally applicable to both elements and compounds and enables thorough testing of the transferability of TB parameters not only between different structural configurations but also in different chemical environments.Reference Margine, Kolmogorov, Reese, Mrovec, Elsässer, Meyer, Drautz and Pettifor110
We believe that such physically justified bottom-up approaches are indispensable for the construction of transferable models. Both sound and justifiable functional forms and transparent fitting strategies are crucial in particular for multi-component systems where the number of model parameters explodes, and the fitting becomes very tedious and ambiguous. A typical sign of a lack of transferability in state-of-the-art interatomic potentials or even tight-binding models is the existence of separate parameter sets for an element under different conditions (e.g., liquid or solid phases) or for a binary system with different concentrations of its constituents. In situations where the complexity of atomic interactions prohibits the models to be both simple and accurate, the required accuracy could be reached by employing modern correction schemes, such as recent Gaussian approximation potentials,Reference Bartók, Payne, Kondor and Csányi111 instead of creating several specific parameterizations.
Potentials covering multiple elements and the whole spectrum of covalent, metallic, and polar chemical bonds still require further work. However, the theoretical groundwork laid and the experience gained in the last 30 years has clearly shown a rigorous route through which such a goal could be reached.
Many-body expansions
Although the theoretical basis is not as firm as for potentials based, for example, on effective medium theory, expansions of the potential energy as sums of pairs and triplets of atoms are commonly used as potential energy functions. The most widely used form is the valence force field in which covalent bonding is modeled as a harmonic expansion in bond stretches, bends, dihedral rotations, and combinations of stretches and bends, with the force constants typically fit to structures and vibrational frequencies. These harmonic expansions are usually supplemented with longer-ranged interactions involving electrostatic terms and relatively weak non-bonded forces.
Acknowledgments
The authors acknowledge collaboration and many fruitful discussions with David Pettifor, Vasek Vitek, Christian Elsässer, Bernd Meyer, Duc Nguyen-Manh, Ralf Drautz, Jonathan Hird, and John Field. Financial support was provided by the German Research Foundation (DFG) via grants MR 22/5–1 and Gu 367/30, by the German Ministry of Education and Research (BMBF), Grants 03X0511 and 03X2512G, by the European Commission through contract No. NMP.2010.2.5–1.263335 (MultiHy), and a Marie-Curie fellowship for L.P. (IDoF 272619). Some simulations were carried out at the Jülich Supercomputing Center.