




Crossref Citations

This article has been cited by the following publications. This list is generated based on data provided by Crossref.
Keith, Melissa G.
and
Harms, Peter D.
2016.
Is Mechanical Turk the Answer to Our Sampling Woes?.
Industrial and Organizational Psychology,
Vol. 9,
Issue. 1,
p.
162.
DeSimone, Justin A.
2016.
What Else Are We Missing? Additional Issues Associated With Sample Misrepresentation.
Industrial and Organizational Psychology,
Vol. 9,
Issue. 1,
p.
129.
Lowry, Paul Benjamin
D’Arcy, John
Hammer, Bryan
and
Moody, Gregory D.
2016.
“Cargo Cult” science in traditional organization and information systems survey research: A case for using nontraditional methods of data collection, including Mechanical Turk and online panels.
The Journal of Strategic Information Systems,
Vol. 25,
Issue. 3,
p.
232.
Jia, Ronnie
Reich, Blaize Horner
and
Jia, Heather H.
2016.
A commentary on: “Creating agile organizations through IT: The influence of IT service climate on IT service quality and IT agility”.
The Journal of Strategic Information Systems,
Vol. 25,
Issue. 3,
p.
227.
Badger Darrow, Jessica
and
Behrend, Tara S.
2017.
Person-environment fit is a formative construct.
Journal of Vocational Behavior,
Vol. 103,
Issue. ,
p.
117.
Cheung, Janelle H.
Burns, Deanna K.
Sinclair, Robert R.
and
Sliter, Michael
2017.
Amazon Mechanical Turk in Organizational Psychology: An Evaluation and Practical Recommendations.
Journal of Business and Psychology,
Vol. 32,
Issue. 4,
p.
347.
Sigerson, Leif
Li, Angel Y.-L.
Cheung, Mike W.-L.
and
Cheng, Cecilia
2017.
Examining common information technology addictions and their relationships with non-technology-related addictions.
Computers in Human Behavior,
Vol. 75,
Issue. ,
p.
520.
Ford, John B.
2017.
Amazon's Mechanical Turk: A Comment.
Journal of Advertising,
Vol. 46,
Issue. 1,
p.
156.
Keith, Melissa G.
Tay, Louis
and
Harms, Peter D.
2017.
Systems Perspective of Amazon Mechanical Turk for Organizational Research: Review and Recommendations.
Frontiers in Psychology,
Vol. 8,
Issue. ,
Steffens, Niklas K.
Peters, Kim
Haslam, S. Alexander
and
van Dick, Rolf
2017.
Dying for charisma: Leaders' inspirational appeal increases post-mortem.
The Leadership Quarterly,
Vol. 28,
Issue. 4,
p.
530.
Garrow, Laurie A.
Ilbeigi, Mohammad
and
Chen, Ziran
2017.
Forecasting Demand for On Demand Mobility.
Wood, Dustin
Harms, P. D.
Lowman, Graham H.
and
DeSimone, Justin A.
2017.
Response Speed and Response Consistency as Mutually Validating Indicators of Data Quality in Online Samples.
Social Psychological and Personality Science,
Vol. 8,
Issue. 4,
p.
454.
Buchheit, Steve
Doxey, Marcus M.
Pollard, Troy
and
Stinson, Shane R.
2018.
A Technical Guide to Using Amazon's Mechanical Turk in Behavioral Accounting Research.
Behavioral Research in Accounting,
Vol. 30,
Issue. 1,
p.
111.
Kan, Irene P.
and
Drummey, Anna B.
2018.
Do imposters threaten data quality? An examination of worker misrepresentation and downstream consequences in Amazon's Mechanical Turk workforce.
Computers in Human Behavior,
Vol. 83,
Issue. ,
p.
243.
Chambers, Silvana
and
Nimon, Kim
2018.
Handbook of Research on Innovative Techniques, Trends, and Analysis for Optimized Research Methods.
p.
258.
Mallinas, Stephanie R.
Crawford, Jarret T.
and
Cole, Shana
2018.
Political opposites do not attract: The effects of ideological dissimilarity on impression formation.
Journal of Social and Political Psychology,
Vol. 6,
Issue. 1,
p.
49.
DeSimone, Justin A.
and
Harms, P. D.
2018.
Dirty Data: The Effects of Screening Respondents Who Provide Low-Quality Data in Survey Research.
Journal of Business and Psychology,
Vol. 33,
Issue. 5,
p.
559.
Stanziani, Marissa
Cox, Jennifer
and
Coffey, C. Adam
2018.
Adding Insult to Injury: Sex, Sexual Orientation, and Juror Decision-Making in a Case of Intimate Partner Violence.
Journal of Homosexuality,
Vol. 65,
Issue. 10,
p.
1325.
Hopp, Toby
2019.
A network analysis of political incivility dimensions.
Communication and the Public,
Vol. 4,
Issue. 3,
p.
204.
Hirschi, Andreas
Keller, Anita C.
and
Spurk, Daniel
2019.
Calling as a double-edged sword for work-nonwork enrichment and conflict among older workers.
Journal of Vocational Behavior,
Vol. 114,
Issue. ,
p.
100.
Landers and Behrend (Reference Landers and Behrend2015) are the most recent in a long line of researchers who have suggested that online samples generated from sources such as Amazon's Mechanical Turk (MTurk) are as good as or potentially even better than the typical samples found in psychology studies. It is important that the authors caution that researchers and reviewers need to carefully reflect on the goals of research when evaluating the appropriateness of samples. However, although they argue that certain types of samples should not be dismissed out of hand, they note that there is only scant evidence demonstrating that online sources can provide usable data for organizational research and that there is a need for further research evaluating the validity of these new sources of data. Because the target article does not directly address the potential problems with such samples, we will review what is known about collecting online data (with a particular focus on MTurk) and illustrate some potential problems using data derived from such sources.
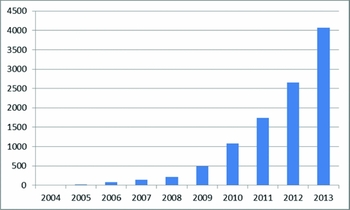
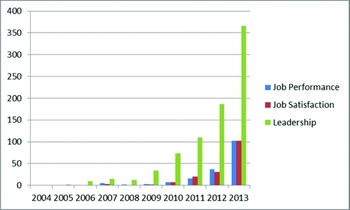
Although there have only been a few articles to date using MTurk samples in premiere organizational journals, the usage of MTurk samples both inside and outside the organizational sciences is increasing. Google Scholar searches for “mechanical turk” demonstrate its rapid ascendance in the academic literature (see Figure 1). Searching within those results for the terms “job performance,” “job satisfaction,” and “leadership” shows a similar pattern for topics that are of interest to organizational scholars (see Figure 2). Given the rapidly increasing interest in online samples as data sources for organizational researchers, it is clear that there is a pressing need to come to a better understanding of such samples.
Google Scholar Search of “Mechanical Turk” (Color online)
Google Scholar Search Results of Organizational Topics Within Studies Using Mechanical Turk (Color online)
One of the most widely studied topics in research methods papers investigating MTurk and other online samples concerns their representativeness (e.g., Buhrmester, Kwang, & Gosling, Reference Buhrmester, Kwang and Gosling2011; Chandler, Mueller, & Paolacci, Reference Chandler, Mueller and Paolacci2014; Mason & Suri, Reference Mason and Suri2011; Paolacci, Chandler, & Ipeirotis, Reference Paolacci, Chandler and Ipeirotis2010). Studies have shown that samples tend to be disproportionately young and female with higher than average income levels (Buhrmester et al., Reference Buhrmester, Kwang and Gosling2011; Chandler et al., Reference Chandler, Mueller and Paolacci2014; Paolacci et al., Reference Paolacci, Chandler and Ipeirotis2010).
The problems associated with representativeness become magnified when using non-U.S. samples. Not only do the percentages of individuals “working” on MTurk for a living dramatically increase but also the vast majority of the non-U.S. Turkers are male, under the age of 25, and much more educated than the average individual in their country (Ross, Irani, Silberman, Zaldiver, & Tomlinson, Reference Ross, Irani, Silberman, Zaldivar, Tomlinson, Edwards and Rodden2010). Recent research suggests that data provided from this latter group is particularly poor (Feitosa, Joseph, & Newman, Reference Feitosa, Joseph and Newman2015), and screening them out of studies using an MTurk country-of-origin screen can be problematic as there are a number of online sites dedicated to showing international Turkers ways to set up fake addresses and accounts in order to make themselves eligible for U.S.-only studies. Feitosa et al. (Reference Feitosa, Joseph and Newman2015) estimated that 5%—10% of “U.S. participants” were actually from overseas. Similar results have been found in other studies (e.g., Berinsky, Huber, & Lenz, Reference Berinsky, Huber and Lenz2012; Rand, Reference Rand2012).
In terms of what industries are represented, one recent study that we collected with over 1,000 U.S.-based Turkers found that the top three industries for Turkers were informational technology (16.1%), arts/entertainment (12.2%), and finance (12.2%). For comparison, the U.S. Census reports that these industries constitute 2.6%, 2.0%, and 5.1% of the workforce, respectively. Across all North American Industry Classification System codes, there was only a small (r = .12) correspondence between MTurk and the working population.
It is also important that organizational researchers recognize that the majority of MTurk participants also tend to be underemployed or unemployed (Ross et al., Reference Ross, Irani, Silberman, Zaldivar, Tomlinson, Edwards and Rodden2010), and many report that MTurk is their primary source of income (Paolacci et al., Reference Paolacci, Chandler and Ipeirotis2010). This may be of particular concern to organizational researchers as many of these individuals report that they are “employed” part- or full-time, but they are either interpreting working on MTurk as being employed or are simply reporting being employed in order to participate in studies that pay well. That said, we should be clear that many Turkers do sincerely consider what they do to be a job like any other. Websites like mturkgrind.com, wearedynamo.org, and turkopticon have been used to advocate for MTurk worker rights. In particular, it has been suggested that the rates of pay for projects be benchmarked to the U.S. federal minimum wage. Researchers paying less than this rate may be contacted by self-appointed “labor reps” pointing them to these sites and threatening to contact university institutional review boards.
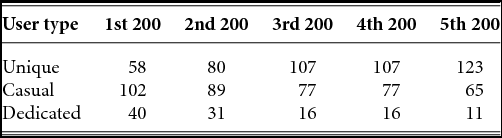
One consequence of having so many “professional” Turkers in the system is that a very small number of workers are responsible for a disproportionate amount of the activity on MTurk. One of the most comprehensive investigations of this problem found that the top 1% of the most prolific Turkers were responsible for 11% of the human intelligence tasks (HITs) and that the top 10% were responsible for 41% of the HITs completed on the service (Chandler et al., Reference Chandler, Mueller and Paolacci2014). The website Deneme (2009) reported that the top 22% of Turkers were responsible for 80% of HITs. In other words, although Amazon advertises that there are over 100,000 active workers, in truth the majority of work is being done by a very small number of dedicated users. Moreover, because Turkers tend to specialize in particular types of tasks, this has enormous consequences for nonindependence of samples for researchers collecting questionnaire or experimental data. To illustrate, a recent set of six studies by Berinsky and colleagues (Reference Berinsky, Huber and Lenz2012) found that 24% of the Turkers in the total sample appeared in at least two of the studies and 1% were present in five or more. Even more concerning is that the number of dedicated users is not equally distributed across samples. To investigate, we ran a study of 1,000 Turkers in five blocks of 200. To categorize workers, we used a database of eight studies consisting of over 20,000 Turkers that had been collected over the past 3 years. Individuals were coded as “unique” if they had taken part in no prior studies, “casual” if they had participated in one or two prior studies, and “dedicated” if they were in three or more. The results are presented in Table 1. As can be seen, the dedicated Turkers quickly inundate newly posted HITs. Additionally, 52.3% of our sample had participated in at least one prior MTurk study in our database, which is more than double Berinsky et al.'s estimate. It is only when studies are sufficiently large (n > 800) or have the advantage of a large database of prior studies to screen them out that one can be assured that the professional Turkers do not make up more than 10% of the sample. Individuals new to collecting data on MTurk can only gain this advantage by running several screening studies at great cost.
The Frequency of Dedicated Turkers in a Large Sample
But is it really so bad to have large numbers of professional Turkers in a study meant to examine organizational phenomena? We believe that the answer is yes. As noted above, these individuals tend to have irregular employment status and are more likely to be from non-U.S. populations. Although these dedicated workers report making greater efforts to focus on HITs (Chandler et al., Reference Chandler, Mueller and Paolacci2014), it is likely that they do so because they are aware of data quality checks and the need to maintain their reputations. Rather, Mason and Suri (Reference Mason and Suri2011) report that data quality actually falls among frequent participants. Similarly, the website Deneme (2009) reports that prolific Turkers tend to use a smaller range of response options than casual users do in order to complete surveys more quickly and maximize income. This results in greater peakedness in the distribution.
But high-frequency participants are not the only source of bad data in MTurk samples. Feitosa et al. (Reference Feitosa, Joseph and Newman2015) found that data collected from non-English speakers was particularly problematic. Given the prevalence of both groups in smaller MTurk samples, this presents a real threat to the validity of data collected in this domain. Chandler et al. (Reference Chandler, Mueller and Paolacci2014) reported that only around 33% of research conducted using MTurk samples used data quality checks and that on average 15% of respondents were removed. However, the extent of the problem of bad data in MTurk samples is not really well known because most studies only conduct simple screens. For example, Rand (Reference Rand2012) reported that 4% of participants reported different genders across two studies. Feitosa and colleagues used two quality control items and ended up screening out approximately 9% of their sample. A more recent study used extreme scores on self-reported psychopathology scales to remove 10% of participants (Shapiro, Chandler, & Mueller, Reference Shapiro, Chandler and Mueller2013). Others have reported having to reject 20%–50% of their participants for not taking sufficient care to respond accurately and honestly (Bohannon, Reference Bohannon2011).
Our own work on data cleaning methods (see DeSimone, Harms, & DeSimone, Reference DeSimone, Harms and DeSimone2015) led us to conduct a more vigorous analysis of potential problems with MTurk data. One useful piece of information is that around 15% of potential participants log in to studies and self-select out before completing the survey. We assume that these are high-frequency Turkers checking on the difficulty of HITs before accepting the task. Although we have argued in this article that these individuals are less likely to provide high-quality responses, it is also true that any self-selection by participants in or out of a study is a potential threat to validity. Of the individuals who completed our survey, 4.9% responded to inventory items in less than 2 seconds on average, 9.5% responded to bogus items in such a way as to indicate that they were not reading them, and as many as 35% would have been screened out using standard cutoffs for the Mahalanobis D 2 screen that checks for patterns of aberrant responses. Based on this, it appears that prior estimates of the rates of poor-quality data in MTurk samples may have been underestimated.
Although more work needs to be done, it is clear to us that organizational researchers need to use caution before making use of MTurk or other online samples. At the very least, robust data cleaning procedures are needed. That said, we highly recommend subtle methods of conducting data quality checks (see DeSimone et al., Reference DeSimone, Harms and DeSimone2015). Screening questions at the beginning of surveys are largely ineffective as Turkers have many public forums available to them where they report on not only the rates of pay and the amount of time needed to complete projects but also whether the researcher is using screens to check either eligibility or data quality (Chandler et al., Reference Chandler, Mueller and Paolacci2014). We would also advise that the reasons for accepting or rejecting work be made very explicit before participants take part in HITs. We would even go so far as to say that investigators may want to consider paying for bad data as simply a cost of doing research online. Based on personal experience, it is not worth saving 30 cents to have someone call your house and threaten to drive from Colorado to Nebraska so they can stab you because you did not pay them.
On the whole then, we differ from Landers and Behrend (Reference Landers and Behrend2015) in that we urge a cautious, skeptical approach to embracing new samples. In a sense, they are advising us to focus on avoiding making a Type 1 error. We should not reject unconventional samples out of hand because those samples are “neither better or worse . . . merely different.” Instead, we would argue for moving forward more slowly so as to avoid the Type 2 error of falsely concluding that there is no difference between types of samples. This would seem to be the most prudent course to take considering that even Landers and Behrend have noted the paucity of evidence to support or disconfirm either conclusion.
In conclusion, and in contrast to Landers and Behrend (Reference Landers and Behrend2015), we believe that rather than solving the problem of the WEIRD (Western, educated, industrialized, rich, and democratic; Henrich, Heine, & Norenzayan, Reference Henrich, Heine and Norenzayan2010) samples typically found in psychological studies, the samples provided by MTurk and other online sites have simply added another confounding variable in that many of the participants are spending a disproportionate amount of time (and their work lives) online (Ross et al., Reference Ross, Irani, Silberman, Zaldivar, Tomlinson, Edwards and Rodden2010). We do not yet fully understand what the consequences of using samples of WEIRDOs to investigate organizational topics (and psychology more broadly) will be. However, we do agree with Landers and Behrend (Reference Landers and Behrend2015) that more attention must be paid to whether such samples are appropriate. In the case of MTurk, we may find that such samples are not of much use to organizational researchers outside studies of job-seekers, the recently terminated, the chronically unemployed, and disengaged employees misusing company resources to earn extra income. The real inconvenient truth is that samples really do differ both in terms of their quality and in the degree to which conclusions can be drawn from them. The time has come for organization researchers to begin seriously investigating whether the recent enthusiasm for crowdsourced data is warranted or desirable.