Introduction
Pure and metal-doped degenerate semiconductor cadmium oxide (CdO) has been used in a wide range of optoelectronic applications like transparent conducting oxide, solar cells, smart windows, and optical communications, as well as other type of applications such as IR heat mirrors and gas sensors, etc.[Reference Zhao, Morel and Ferekides1–Reference Yan, Lane, Kannewurf and Chang5] These applications are based on its (CdO) optical and electrical properties,[Reference Zhao, Morel and Ferekides1, Reference Carballeda-Galicia, Castanedo-Perez, Jimenez-Sandoval, Jimenez-Sandoval, Torres-Delgado and Zuniga-Romero6–Reference Kondo, Okhimura and Sakai9] which could be controlled through doping with different types of metallic ions. It was observed that doping of CdO with some metallic ions of smaller radius than that of Cd2+, like In, Sn, Al, Sc, and Y, improved its electrical conduction properties, and increases its optical energy gap.[Reference Zhao, Morel and Ferekides1, Reference Maity and Chattopadhyay10–Reference Dakhel14] However, Dakhel[Reference Dakhel15] studied the possibility of controlling the optoelectrical properties of CdO through doping with rare earth ions Sm3+ because of smaller ionic radius than that of Cd2+ and found that Sm3+ ions doping obviously narrows optical band gap and increases conductivity by slight doping level of 0.4 at.%. He further found that Dy[Reference Dakhel15] and Ce[Reference Dakhel16] dopings have similar effects on the optoelectric properties of CdO. Recently, the potential doping candidates of the rare earth oxide Gd[Reference Guptaa, Ghosh, Patel and Kahol17] and Li–Ni[Reference Gupta, Serbetci and Yakuphanoglu18] in improvement of the optical and electrical properties of the CdO films have also been reported. Pr cation has radius near Cd cation. Tetravalent Pr4+ can also provide more carriers for n-type CdO semiconductor than other trivalent rare earth cations such as Nd3+, Sm3+, Gd3+, etc., and so conductivity can be expected to have increased more. Moreover, the efficient visible and infra-red emissions of Pr cation in some host materials are reported in previous literature.[Reference Lakshminarayana, Yang, Teng and Qiu19–Reference Gu, Gao, Huang, Liu, Liu and Chen23] However, the literature survey indicates that there is no report on optoelectrical properties of Pr-doped CdO materials. The aim of the present work is to study the effects of Pr doping with different levels on the structural and optical properties of CdO powders for the first time.
Materials and methods
The starting materials used were all analytical agents. For synthesis of the Pr-doped CdO powders, Pr6O11 powder was first dissolved in 5 mol/l HCl aqueous solution and CdCl2 powder was dissolved in deionic water with constant stirring. The two solutions were then mixed according to the designed Pr content of 0, 0.5, 1.0, 1.5, and 2.0 at.%. Deionic water was added into the mixed solutions to achieve total metal cation concentration of 0.01 mol/l. Subsequently, ammonia (36 wt.% NH3) was slowly dropped into the solutions with constant stirring until the solution pH ~10. In this process, reddish brown precipitations were fast formed in the solutions. After an aging of 1 h at room temperature, the solutions were filtered and washed with ammonia aqueous solution with pH ~9–10 for several times. Finally, the precipitations were dried at 100 °C for 24 h and then calcined at 400 °C for 2 h.
The structural phase of the Pr-doped CdO powders was identified at room temperature using an x-ray diffractometer (XRD, CuKα1, λ = 0.15406 nm, Model No.: D/Max-2200PC, Rigaku, Tokyo, Japan), and the morphology of the powders was analyzed using a field emission scanning electron microscope (FE-SEM, Model No.: JXM-6700F, JEOL, Tokyo, Japan). The diffuse reflectance absorption spectra of the powders were determined with a UV-vis spectrophotometer (Model No.: Lambda 950, Bruker Daltonics, Billerica, MA).
Results and discussion
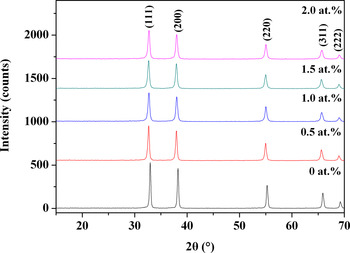
Figure 1 shows the XRD patterns of the Pr-doped CdO powders. The monteponite CdO with cubic structure is the only XRD detectable phase (PDF# 76-0653), no other phase is detected. This might indicate that the Pr3+/Pr4+ cations entered the CdO lattice by the cation substitution. It is demonstrated from the XRD patterns that the powders have preferred orientation with I (200)/I (111) = 0.857–0.8978. This implies that the powders are weak a-orientation in comparison with the standard XRD intensity ratio of I (200)/I (111) = 0.858. The average particle sizes of the powders are estimated with Jade 5.0 software provided by the x-ray diffractometer from the strongest peak at ~32.8°. They are 31.5, 25.3, 22.0, 22.0, and 21.3 nm for the Pr content of 0, 0.5, 1.0, 1.5, and 2.0 at.%, respectively.
XRD patterns of the CdO:Pr powders with different Pr content.

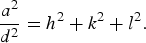
The monteponite CdO is a cubic crystal, and the lattice parameters of the powders can be calculated with XRD data analysis by the following equation:
 $$\displaystyle{{a^2 } \over {d^2 }}=h^2+k^2+l^2 .$$
Calculated lattice parameters are a = 4.6995, 4.7265, 4.7205, 4.7253, and 4.7187 Å for the powders with Pr content of 0, 0.5, 1.0, 1.5, and 2.0 at.%, respectively. The a value of the doped powders is overall larger than that of the pure CdO powder due to larger ionic radius (1.09 Å/0.92 Å) of Pr3+/Pr4+ cations than the Cd2+ cation (0.97 Å). Each lattice cell contains four CdO molecules. With the calculated lattice parameters, the density of the powders (D, g/cm3) can be calculated by the following equation:
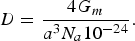 $$D=\displaystyle{{4G_m } \over {a^3 N_a 10^{ - 24} }}.$$
where G m is the gram molecular mass (128.4104 g/mol of the CdO) and N a is the Avogadro constant (6.022·1023). As-calculated densities are 8.218, 8.078, 8.109, 8.084, 8.118 g/cm3 for Pr content of 0, 0.5, 1.0, 1.5, and 2.0 at.%, respectively.
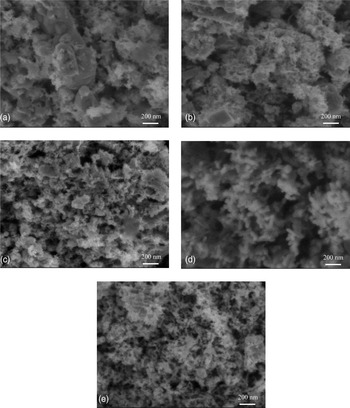
Figure 2 shows FE-SEM micrographs of the Pr-doped CdO powders. The powders demonstrate granular particle morphologies. The powders with Pr content of 0 at.%, 0.5 at.% are containing some abnormal large particles with size of about 150–500 nm, so that the average particle size decreases overall as the Pr content increases. This is consistent with the result of XRD analysis.
SEM micrographs of the CdO:Sm powders with Sm3+ contents of (a) 0 at.%, (b) 0.5 at.%, (c) 1.0 at.%, (d) 1.5 at.%, (e) 2.0 at.%.

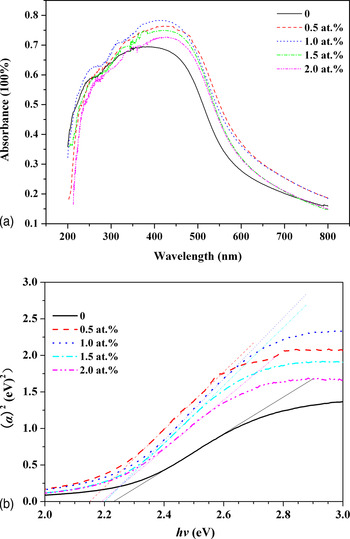
Figure 3 shows absorption spectra of the Pr-doped CdO powders with various Pr contents. The absorbance in the UV-visible range increases first and then decreases with increasing Pr content. Average absorbances in the range of 200–800 nm are 46.38, 50.21, 51.26, 47.73, and 48.89% for the Pr content of 0, 0.5, 1.0, 1.5, and 2.0 at.%, respectively. The powders with Pr contents of 0.5–1.0 show the maximum absorbance. The plot of α Reference Su, Grote and Schmitt2 ~ hv are shown in [Fig. 3(b)]. The straight-line portion of the curve, when extrapolated to zero, gives the optical band gap E g. They decrease from 2.23 to 2.15 eV with increase in the Pr content from 0 to 0.5 at.% and then increase to 2.20, 2.20, and 2.19 eV as the increase in contents to 1.0, 1.5, and 2.0 at.%, respectively. The band gap of pure CdO (Pr content is 0) is in band gap range of 2.2–3.0 eV reported for the films prepared by different techniques[Reference Zhao, Morel and Ferekides1, Reference Dakhel15–Reference Gupta, Serbetci and Yakuphanoglu18, Reference Dakhel24–Reference Ueda, Maeda, Hosono and Kawazoe26] and near 2.2 eV reported for bulk CdO.[Reference Xu and Schoonen27] The band gap of the host CdO suffers from a sudden decrease by about 3.6% due to the slight Pr3+ doping of 0.5 at.%.
(a) UV-vis. absorption spectra of the Pr-doped CdO powders. (b) Plots of (αhν)2 vs. hν.

In general, rare earth cation doping can result in increase of carrier concentration of n-type semiconductor such as CdO and so band gap widening or Moss–Burstein effect.[Reference Kawamura, Maekawa, Yanagi, Hirano and Hosono25, Reference Ueda, Maeda, Hosono and Kawazoe26] Such a decrease of E g is contradictory to the usually expected Moss–Burstein effect. This decrease can be explained by the change in the nature and strength of the crystalline potential by adding the influence of Pr3+ ions and the effect of their 4f-electrons on the crystalline electronic energy spectrum. Owing to light doping, the band tailing or impurity band becomes broader and finally reaches and merges with the bottom of the conduction band causing sudden decrease of the optical band gap. The relative gradual variation of E g among rare earth ion-doped samples is studied in the present work through the available models that related the change of E g to the change of carrier concentration.[Reference Dakhel15, Reference Dakhel16, Reference Dakhel24] The increase of carrier concentration in degenerate semiconductors causes theoretically two opposite effects, namely band gap widening and band gap narrowing (BGN). The BGN could play a major role in explanation of the present results due to the high density of carriers. The BGN consists of two parts.[Reference Dakhel15, Reference Dakhel16, Reference Dakhel24] The first part comes from the electron-impurity interaction. The second part of BGN arises from the columbic interaction between the carriers and results in the band gap shift.[Reference Camassel, Auvergne and Mathieu28] In addition, Gupta et al.[Reference Gupta, Serbetci and Yakuphanoglu18] also related the possible reason for decrease in the optical band gap of Li–Ni co-doped CdO thin films to the change in the grain size of the films. Moreover, the band gap is associated with lattice spacing. Smaller lattice spacing leads to stronger interaction between atoms and thereby leads to a wider band gap. The variations in the band gap of the CdO powders with Pr content are overall in accordance with their variations in lattice parameters and densities estimated with XRD data analysis.
Conclusions
Pr-doped CdO powders with Pr contents of 0–2.0 at.% have been synthesized by a coprecipitation method. Pr cation is completely entered into the CdO lattice in studied range of Pr content. Pr doping significantly affects the absorbance and the band gap energy of the powders. With increasing Pr content, the average particle size decreases, the absorbance of the powders in the range of UV-visible light decreases and then increases, and the band gap is narrowed and then returns. Maximum E g decrease of about 3.6% and absorbance increase of about 8.26% are obtained due to slight Pr3+ doping of 0.5 at.%. This may be of significance to the optical application of the CdO:Pr materials.
Acknowledgments
The authors thank Ms. F. Tian of the Northwest Institute for Non-Ferrous Metal Research for her kind assistance in SEM measurement, Mr. J.P. Wu and Dr. H. Liu of the Shaanxi University of Science and Technology for their kind assistance in XRD and UV-vis spectra measurements, respectively.