

1. Introduction
Grasslands cover approximately 23% of the Earth’s terrestrial surface, with a total area of 8.4 billion acres (ILRI et al., 2021). In the United States, improper livestock grazing led to land degradation, which negatively impacts agricultural productivity, posing a threat to food security and rural livelihoods (Public Employees for Environmental Responsibility [PEER], 2025). Improving grazing management is therefore essential to sustain both ecological integrity and agricultural viability.
Among grazing strategies, continuous grazing (CG) remains the predominant management approach. Under CG management, livestock have unrestricted access to the entire pasture. This increases the risk of overgrazing, as animals tend to selectively graze preferred plants, leading to uneven utilization and inadequate grass recovery (Paine, Undersander, and Casler, Reference Paine, Undersander and Casler1999; Teague et al., Reference Teague, Provenza, Kreuter, Steffens and Barnes2013). Over time, CG often leads to reduced forage availability, degraded soil health, soil erosion, and nutrient runoff, all of which compromise grass productivity and grazing sustainability (Pratt, Reference Pratt1993).
In contrast to CG, rotational grazing (RG) divides a pasture into multiple smaller paddocks so that livestock can graze on one paddock while the other paddocks are under recovery. RG spans a continuum of management intensity, ranging from low-intensity (extensive RG) to high-intensity (management-intensive grazing (MIG)) (Wang and Kreuter, Reference Wang and Kreuter2025). A producer can increase management intensity by incorporating more paddocks and shorter grazing periods to optimize forage use (Briske et al., Reference Briske, Derner, Brown, Fuhlendorf, Teague, Havstad, Gillen, Ash and Willms2008; Teague et al., Reference Teague, Provenza, Kreuter, Steffens and Barnes2013). While both are based on the core principle of rotating livestock between paddocks to promote forage recovery, they differ in the number of paddocks, grazing duration, and length of recovery (Teague et al., Reference Teague, Provenza, Kreuter, Steffens and Barnes2013).
Extensive RG typically utilizes fewer paddocks (usually 4 to 15) with longer grazing periods, sometimes even allowing livestock to graze for months on the same paddock (Teague et al., Reference Teague, Provenza, Kreuter, Steffens and Barnes2013; Wang and Kreuter, Reference Wang and Kreuter2025; Wang et al., Reference Wang, Jin, Kreuter, Feng, Hennessy, Teague and Che2020, Reference Wang, Jin, Kreuter and Teague2022). Prolonged grazing and limited recovery period can place persistent stress on preferred or palatable plant species, thereby reducing their competitiveness against non-palatable grasses (Teague et al., Reference Teague, Provenza, Kreuter, Steffens and Barnes2013; Wang, Teague, and Park, Reference Wang, Teague and Park2016). By contrast, MIG generally involves more paddocks (usually 16 or more), shorter grazing (1–14 days), and extended recovery periods (20–100 days) to improve forage and animal production (Gerrish, Reference Gerrish2004; Teague et al., Reference Teague, Dowhower, Baker, Haile, DeLaune and Conover2011, Reference Teague, Provenza, Kreuter, Steffens and Barnes2013; Wang and Kreuter, Reference Wang and Kreuter2025). Short-duration and high-density grazing under MIG minimizes selective defoliation and promotes uniform forage utilization, while adequate recovery supports plant regrowth before subsequent grazing (Ge et al., Reference Ge, Xue, Ru, Li, Li, Han, Li and Huang2025; Teague et al., Reference Teague, Provenza, Kreuter, Steffens and Barnes2013).
From producers’ standpoint, transitioning from CG to a higher grazing management intensity level, such as RG and MIG, constitutes a substantial investment decision. Producers need to weigh the upfront capital costs of installing fencing and water infrastructure against the potential long-run benefits, including improved forage utilization and greater stocking capacity (Pannell et al., Reference Pannell, Marshall, Barr, Curtis, Vanclay and Wilkinson2006; Teague et al., Reference Teague, Provenza, Kreuter, Steffens and Barnes2013). These decisions are further shaped by uncertainty about economic and biophysical outcomes, heterogeneity in financial capacity, and the availability of cost-share incentives that alter the perceived cost–benefit calculus of adoption (Knowler and Bradshaw, Reference Knowler and Bradshaw2007; Wang et al., Reference Wang, Jin, Kasu, Jacquet and Kumar2019). Importantly, adoption is not a one-time choice but a dynamic process in which producers may intensify management as benefits are realized or shift toward more extensive systems when labor demands cannot be met, or outcomes become unfavorable (Pannell et al., Reference Pannell, Marshall, Barr, Curtis, Vanclay and Wilkinson2006; Prokopy et al., Reference Prokopy, Floress, Arbuckle, Church, Eanes, Gao, Gramig, Ranjan and Singh2019).
While prior studies have examined producers’ adoption of RG using survey data, most have combined extensive RG and MIG into a single category, obscuring important differences in outcomes generated by these distinct grazing strategies (Becker et al., Reference Becker, Kreuter, Atkinson and Teague2017; Che, Feng, and Hennessy, Reference Che, Feng and Hennessy2023; O’Hara et al., Reference O’Hara, Reyes, Knight and Brown2023). In addition, previous studies have relied on cross-sectional data to examine adoption status at a single point in time, providing no evidence on how producers transition among different grazing management intensities over time (Boyer et al., Reference Boyer, Lambert, Griffith and Clark2022; Fotz and Lang, Reference Foltz and Lang2005; Jensen et al., Reference Jensen, Lambert, Clark, Holt, English, Larson, Yu and Hellwinckel2015; Roche et al., Reference Roche, Cutts, Derner, Lubell and Tate2015; Wang and Kreuter, Reference Wang and Kreuter2025; Whitt and Wallander, Reference Whitt and Wallander2022; Wongpiyabovorn and Wang, Reference Wongpiyabovorn and Wang2025; Wang et al., Reference Wang, Jin, Kreuter and Teague2022).
To our knowledge, no study has tracked individual producers’ adoption trajectories for intensive grazing systems or examined transitions across grazing practices over time. As a result, changes in RG and MIG adoption status remain poorly understood, and transitions across CG, extensive RG, and MIG are largely undocumented. Although the Agricultural Census recorded whether farms used RG/MIG in each census year from 2007 to 2022, the survey conflated extensive RG with MIG (USDA NASS, 2007–2022), making it impossible to identify producers’ true management intensity or to follow their transitions over time.
To address these gaps, we analyze producer survey responses collected in 2018 and 2022 to identify changes in individual grazing management adoption and to examine how grazing management practices evolve among producers in North Dakota, South Dakota, and Texas. Specifically, it aimed to (1) identify the factors that drive the transition from CG to RG, (2) determine the factors that motivate producers to transition from extensive RG to MIG, and (3) identify the factors associated with the transition from higher to lower intensity management strategies, such as from MIG to RG, or from RG to CG. By analyzing different transition patterns over time and the potential factors and motivations behind them, our study provides new insights into the patterns and drivers of changes in grazing management practices.
2. Economic framework for adoption and transition in grazing management
Producers make cost-benefit evaluations when deciding whether to adopt more intensive management in grazing practices, consistent with the broader framework of agricultural technology adoption in which they weigh expected benefits against the costs and risks of altering established practices (Feder, Just, and Zilberman, Reference Feder, Just and Zilberman1985; Knowler and Bradshaw, Reference Knowler and Bradshaw2007; Prokopy et al., Reference Prokopy, Floress, Klotthor-Weinkauf and Baumgart-Getz2008; Wang et al., Reference Wang, Jin, Kasu, Jacquet and Kumar2019). Moving from CG to RG or from RG to MIG requires substantial fixed investments in fencing and water infrastructure and may increase labor and management demands (Teague et al., Reference Teague, Provenza, Kreuter, Steffens and Barnes2013). Producers must therefore assess whether anticipated long-run gains justify these upfront and recurring costs (Gillespie et al., Reference Gillespie, Wyatt, Venuto, Blouin and Boucher2008; Pannell et al., Reference Pannell, Marshall, Barr, Curtis, Vanclay and Wilkinson2006; Teague et al., Reference Teague, Provenza, Kreuter, Steffens and Barnes2013). Conversely, producers may disadopt or revert to less intensive systems when more intensive practices become economically or time-wise unsustainable (Pannell et al., Reference Pannell, Marshall, Barr, Curtis, Vanclay and Wilkinson2006; Roche et al., Reference Roche, Cutts, Derner, Lubell and Tate2015; Wang et al., Reference Wang, Jin, Kreuter, Feng, Hennessy, Teague and Che2020).
The primary barrier to adopting RG and MIG is the substantial fixed investment required for fencing and water infrastructure (Knight, Toombs, and Derner, Reference Knight, Toombs and Derner2011; Wang et al., Reference Wang, Jin, Kreuter, Feng, Hennessy, Teague and Che2020; Windh et al., Reference Windh, Ritten, Derner, Paisley and Lee2019). Cross-fencing alone accounts for 69%–83% of total annual system costs (Windh et al., Reference Windh, Ritten, Derner, Paisley and Lee2019), with four-strand barbed-wire installation costing about $8,290 per mile and annual maintenance equal to roughly 8% of installation costs (Knight, Toombs, and Derner, Reference Knight, Toombs and Derner2011). Cost differences across systems are notable: on a 3,200-acre ranch, annual fencing costs were $8,800 under CG, increased to $19,800 for RG with permanent fencing (or $9,600 with temporary electric fencing), and reached $29,800 under an adaptively managed system with contiguous paddocks (Windh et al., Reference Windh, Ritten, Derner, Paisley and Lee2019).
Water infrastructure costs also rise with grazing intensity because each paddock requires reliable water access, with water infrastructure and associated labor comprising 17%–31% of total system costs (Booher and Clark, Reference Booher and Clark2025; Windh et al., Reference Windh, Ritten, Derner, Paisley and Lee2019). As the number of paddocks increases, so does the number of water points and the need for smaller tank sizes, raising overall expenses. For example, in a 10-paddock RG system with 320 acres per paddock, water costs are nearly three times higher than in a single CG pasture (Windh et al., Reference Windh, Ritten, Derner, Paisley and Lee2019).
More intensive grazing systems generally impose higher labor requirements for livestock movement and infrastructure management, while potentially reducing the labor needed for routine monitoring (Teague et al., Reference Teague, Provenza, Kreuter, Steffens and Barnes2013; Undersander et al., Reference Undersander, Albert, Cosgrove, Johnson and Peterson2002; Wang and Kreuter, Reference Wang and Kreuter2025). Labor outcomes vary with paddock number and system design, and empirical evidence reflects this variability: Gillespie et al. (Reference Gillespie, Wyatt, Venuto, Blouin and Boucher2008) reported that labor per acre rose from 6.28 hours under CG to 10.60 hours in an 8-paddock rotational system due to added forage management, repairs, and animal movements. In contrast, Windh et al. (Reference Windh, Ritten, Derner, Paisley and Lee2019) found that shifting from CG on a 3,200-acre pasture to a 10-paddock rotational system reduced weekly cattle-checking time from 7.5 to 3 hours, despite roughly 10 additional seasonal hours required for livestock movements.
The benefits of RG and MIG include both private on-farm gains and payments tied to broader environmental services. On-farm economic benefits arise from improved forage utilization, higher stocking rates, and greater livestock productivity, which can enhance long-run profitability through increased output or reduced supplemental feed costs (Roche et al., Reference Roche, Cutts, Derner, Lubell and Tate2015; Teague et al., Reference Teague, Provenza, Kreuter, Steffens and Barnes2013; Wang et al., Reference Wang, Jin, Kreuter and Teague2022). Evidence from a hypothetical 300-acre Minnesota farm illustrates these gains: transitioning from CG to RG increased cow–calf units from 28 to 46 and raised returns to labor and management from $3,538 to $8,103, while further transitioning to MIG increased stocking capacity to 108 units and returns to $28,765 (Boody, Reference Boody2018).
Additionally, government conservation programs help reduce both upfront and ongoing costs of adopting RG and MIG. Environmental Quality Incentives Program (EQIP) lowers initial investment barriers by covering up to 75% of Natural Resources Conservation Services (NRCS)-estimated costs for practices such as fencing, water development, and grazing planning (USDA NRCS, 2021). Conservation Stewardship Program (CSP) complements this by supporting long-term maintenance, with rates varying by land type (USDA NRCS, 2023). In practice, many producers use EQIP for establishment and then shift to CSP for maintenance once EQIP contracts end.
3. Data
3.1. Survey description
In 2018 and 2022, we conducted two mail surveys among cattle producers in North Dakota, South Dakota, and Texas to assess ranchers’ adoption status of different grazing management strategies. Grasslands in these states collectively cover nearly 30% of the non-Federal land in the United States, with grazing land representing 34% of rural land in North Dakota, 55% in South Dakota, and 72% in Texas (US Department of Agriculture [USDA], 2020). Our surveys targeted operations with at least 100 non-feedlot cattle, as smaller operations are less likely to find RG profitable due to a lack of economies of scale and higher adoption barriers (Gillespie, Kim, Paudel, Reference Gillespie, Kim and Paudel2007; Wang et al., Reference Wang, Teague, Park and Bevers2018). The study area spans regions with substantial climatic heterogeneity, characterized by north-to-south temperature and east-to-west precipitation gradients.
The 2018 survey was administered to a representative sample of 4,500 producers (1,500 per state) using proportional sampling to ensure county-level representation. A total of 874 producers responded (Wang et al., Reference Wang, Jin, Kreuter, Feng, Hennessy, Teague and Che2020, Reference Wang, Jin, Kreuter and Teague2022). Excluding four respondents who removed their identifier numbers, 870 were resurveyed during January–March 2022. The survey followed a modified tailored design method with up to four mailings (Dillman, Smyth, and Christian, Reference Dillman, Smyth and Christian2014). After removing 54 producers no longer operating a cattle enterprise and 35 with invalid mailing addresses, the eligible sample was reduced to 781. From this pool, 334 completed questionnaires were returned, yielding a 42.8% response rate (Wang and Kreuter, Reference Wang and Kreuter2025). Figure 1 maps the county-level distribution of these respondents.
Distribution of survey respondents across the surveyed counties in North Dakota, South Dakota, and Texas.

To evaluate the representativeness of our data, we compared survey responses with the 2022 Census of Agriculture (USDA NASS, 2024). Average gross sales in beef farming ranged from $100,000 to $249,000 among respondents, falling within the census range of $108,095–$237,072 across the three states. The median farm size in our sample was 1,300 acres, closely aligning with census averages of 541–2,368 acres for beef cattle operations. In contrast, the mean farm size of 2,674 acres was substantially larger than the census averages (P<0.01), indicating the presence of large operations that extend the upper tail of the distribution. The median therefore provides a more representative benchmark for typical producers, while the elevated mean reflects the right-skewed structure of the sample.
3.2. Data description
The 2018 and 2022 surveys used largely consistent questions about the adoption status of the RG and MIG adoption status, with clear definitions of CG, RG, and MIG provided in the survey. The surveys also included questions on the factors that possibly influence their adoption decisions of these practices, such as farmer and farm characteristics, farmer-perceived importance of different information sources and management goals, and benefits and challenges associated with RG/MIG practices.
For both surveys, producers were provided with three response options for both RG and MIG practices: not adopted yet, currently practicing, or discontinued. Based on their responses for each survey, producers were classified into three categories: non-adopters, RG adopters, and MIG adopters. Based on grazing management practices reported in 2018 and 2022, upward transitioners are producers who moved to a more intensive grazing system between 2018 and 2022, such as shifting from CG to RG or from RG to MIG. In contrast, downward transitioners are producers who reported using a more intensive system in 2018 but shifted to a less intensive practice by 2022, such as from MIG to RG, or from RG to CG.
This study uses three dependent variables capturing transitions in grazing management between 2018 and 2022. Each is specified as a binary indicator for its respective model: RG Transition (1 = upward transition from CG to RG, 0 = remain non-adopter); MIG Transition (1 = upward transition from RG to MIG, 0 = remain RG adopter); and Downward Transition (1 = moved from RG or MIG to a less intensive system, 0 = remain RG or MIG adopter).
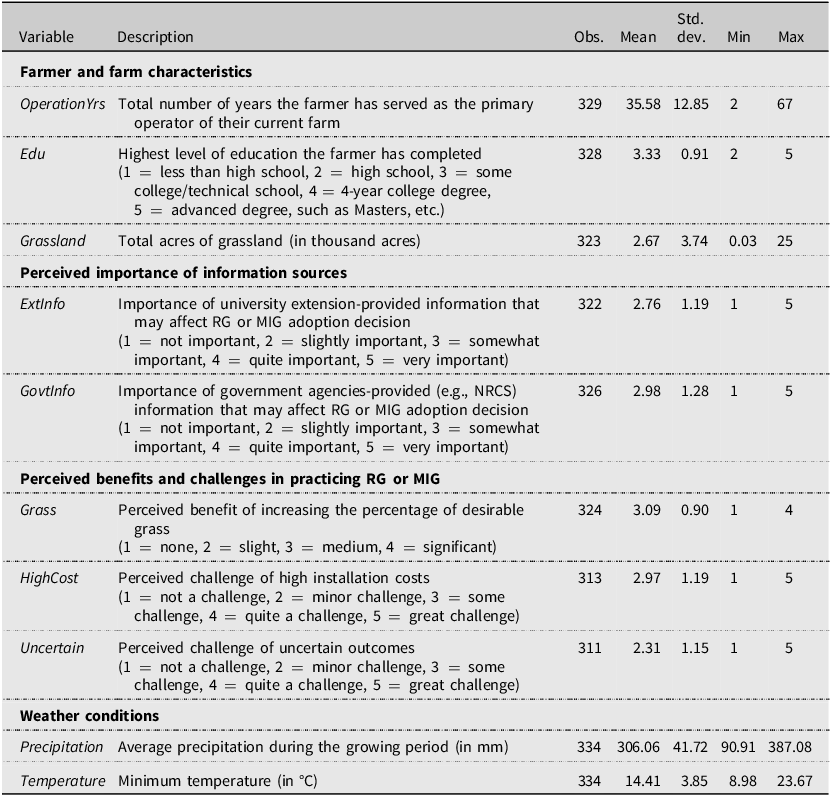
To understand the factors that influence adoption and transitions in grazing strategies, we included explanatory variables that fall into four categories: farmer and farm characteristics, perceived importance of information sources, perceived benefits and challenges, and weather conditions (Table 1). To avoid simultaneity bias and strengthen causal interpretation (Wooldridge, Reference Jeffrey2016), all explanatory variables were drawn from the 2018 survey rather than the 2022 wave. Using pre-period covariates ensures clear temporal ordering between the independent variables and the 2022 transition outcomes. This approach follows established empirical practice in agricultural technology adoption research, which relies on pre-period characteristics to explain subsequent adoption decisions (Walton et al., Reference Walton, Larson, Roberts, Lambert, English, Larkin, Marra, Martin, Paxton and Reeves2010; Wang et al., Reference Wang, Jin, Kreuter and Teague2022).
Description and summary statistics of independent variables

Table 1. Long description
A table with four rows and three columns describing independent variables. The table is divided into four categories: farmer and farm characteristics, perceived importance of information sources, perceived benefits and challenges, and weather conditions. Each row lists a variable, its description, and summary statistics including the number of observations, mean, standard deviation, minimum, and maximum values. The variables include OperationYrs, Edu, Grassland, Extinfo, Govtinfo, Grass, HighCost, Uncertain, Precipitation, and Temperature. Each variable is described with specific details such as the total number of years the farmer has operated their farm, the highest level of education completed, total acres of grassland, importance of various information sources, perceived benefits and challenges, and average precipitation and temperature during the growing period.
Notes: RG = rotational grazing; MIG = management-intensive grazing.
Among farmer characteristics, we include the number of years the respondent has served as the primary operator of their current farm (OperationYrs). The effect of farming experience remains ambiguous (Sapbamrer and Thammachai, Reference Sapbamrer and Thammachai2021): while some studies suggest that more experienced operators may be less likely to adopt new practices due to established routines, sunk investments, and greater risk aversion (Feder, Just, and Zilberman, Reference Feder, Just and Zilberman1985; Quintana-Ashwell et al., Reference Quintana-Ashwell, Gholson, Kaur, Singh, Massey, Krutz, Henry, Cooke, Reba and Locke2022), other research argues that accumulated experience can facilitate adoption by expanding producers’ knowledge base and improving managerial skill and information use (Caswell et al., Reference Caswell, Fuglie, Ingram, Jans and Kascak2001; Prokopy et al., Reference Prokopy, Floress, Klotthor-Weinkauf and Baumgart-Getz2008).
In addition, we considered the highest level of education the farmer has completed (Edu), an ordinal variable ranging from 1 to 5, corresponding to “less than high school,” “high school,” “some college/technical school,” “4-year college degree,” and “advanced degree,” respectively. Higher educational attainment is generally associated with greater adoption of best management practices, including RG and MIG (Hyland et al., Reference Hyland, Heanue, McKillop and Micha2018; Prokopy et al., Reference Prokopy, Floress, Klotthor-Weinkauf and Baumgart-Getz2008; Walton et al., Reference Walton, Larson, Roberts, Lambert, English, Larkin, Marra, Martin, Paxton and Reeves2010). However, other studies suggest that higher-educated farmers are also more likely to participate in off-farm employment, which can reduce the time available for on-farm management and make time-intensive practices less attractive (Chao et al., Reference Chao, Li, Yin and Wang2024; Fernandez-Cornejo et al., Reference Fernandez-Cornejo, Mishra, Nehring, Hendricks, Southern and Gregory2007; Kassie et al., Reference Kassie, Jaleta, Shiferaw, Mmbando and Mekuria2013). As a result, the relationship between education and the adoption of RG and MIG remains empirically uncertain in our context.
Total acres of grassland (Grassland), measured in thousand acres, captures the scale of a producer’s grazing operation. Larger grassland holdings may offer greater flexibility for subdividing pastures and implementing alternative grazing systems (Teague et al., Reference Teague, Provenza, Kreuter, Steffens and Barnes2013; Wang et al., Reference Wang, Teague, Park and Bevers2018). In contrast, producers with limited grassland may perceive higher cost constraints and lower profit gain from adopting more intensive grazing systems (Teague et al., Reference Teague, Provenza, Kreuter, Steffens and Barnes2013; Wang et al., Reference Wang, Jin, Kreuter, Feng, Hennessy, Teague and Che2020).
The importance of information sources, including university extension (ExtInfo) and government agencies (GovtInfo), was included to assess the role of institutional support and technical guidance. Responses were recorded on a five-point Likert scale, where 1 = not important, 2 = slightly important, 3 = somewhat important, 4 = quite important, and 5 = very important. Producers who place greater value on government information sources may face lower information and learning costs, increasing their likelihood of adopting new management practices (Liu, Bruins, and Heberling, Reference Liu, Bruins and Heberling2018; Reimer, Thompson, and Prokopy, Reference Reimer, Thompson and Prokopy2012).
Producer-perceived benefits of RG and MIG, such as an increase in the percentage of desirable grass (Grass), capture producers’ anticipated productivity gains and may also play an important role in shaping grazing management adoption decisions (Roche et al., Reference Roche, Cutts, Derner, Lubell and Tate2015; Wang et al., Reference Wang, Jin, Kreuter and Teague2022). Respondents rated their perceived benefits of RG or MIG on a four-point scale: 1 = none, 2 = slight, 3 = medium, and 4 = significant. It is expected to be positively associated with upward transitions and negatively associated with downward transitions.
Conversely, perceived challenges, regardless of their objective validity, may hinder ranchers’ land management adoption decisions (Che, Feng, and Hennessy, Reference Che, Feng and Hennessy2023; Wang et al., Reference Wang, Jin, Kreuter, Feng, Hennessy, Teague and Che2020). To capture these barriers, we include perceived challenges related to uncertain outcomes (Uncertain) and high installation costs (HighCost), each measured on a 1–5 scale indicating “not a challenge,” “minor challenge,” “some challenge,” “quite a challenge,” and “great challenge,” respectively. Incorporating perceived challenges allows us to more directly measure producers’ subjective assessments of risk and cost. This approach is supported by Gormsen and Huber (Reference Gormsen and Huber2025), who show that investment decisions are strongly shaped by firms’ perceptions of costs and risks rather than by objective measures alone. Both challenges are expected to be negatively associated with upward transitions and positively associated with downward transitions.
Lastly, weather conditions may influence producers’ adoption decisions (Foltz and Lang, Reference Foltz and Lang2005; Wang et al., Reference Wang, Jin, Kreuter and Teague2022; Wang and Kreuter, Reference Wang and Kreuter2025). Producers in warmer, drier, and more drought-prone regions are often more likely to perceive benefits from RG, particularly in terms of drought resilience and extended grazing seasons (Wang et al., Reference Wang, Jin, Kreuter and Teague2022). In regions with lower precipitation, producers may adopt more intensive grazing practices to optimize forage use, improve vegetation recovery, and enhance drought resilience (Wang and Kreuter, Reference Wang and Kreuter2025). To capture these agroecological differences, we include average growing-season precipitation (Precipitation) and average minimum temperature (Temperature) as indicators of local climatic conditions that affect forage growth, stocking density, and the potential returns to RG and MIG practices.
4. Empirical model
Three binary logistic regression models were used to examine factors influencing producers’ grazing-management transition decisions. Each model is grounded in the agricultural technology adoption framework, in which producers weigh the expected private benefits of transitioning to a more intensive grazing system against the fixed costs of adoption, perceived risks, and their available financial resources. Model I analyzes transitions from CG to RG, while Model II examines transitions from RG to MIG. Model III evaluates factors associated with disadoption decisions, defined as transitions from more intensive grazing-management practices to less intensive ones. The decision framework is specified using a latent-variable approach:
 $${Y}_{i}^{*}=X_{i}\beta +\varepsilon _{i},$$
 $${Y_i} = \left\{ {\matrix{ {1,} & {{\rm if}\;Y_i^* = {X_i}\beta + {\varepsilon _i} \gt 0} \cr {0,} & \!\!\!\!\!\!\!\!\!\!\!\!\!\!\!\!\!\!\!\!\!\!\!\!\!\!\!\!\!\!\!{\;{\rm if}\;Y_i^* \le 0} \cr } } \right.$$
The empirical framework assumes an underlying latent variable Y i * for each producer, defined in Equation (1), where X i denotes the vector of explanatory variables, β is the parameter vector to be estimated, and ϵ i follows a logistic distribution. The observed binary outcome Y i is equal to 1 when Y i * > 0 and 0 otherwise.
Coefficients of the independent variables were estimated using maximum likelihood, and, to facilitate interpretation of the modeling results, marginal effects were computed to express these coefficients as changes in the predicted probability of adoption. We report average marginal effects, calculated by first deriving the individual marginal effect for each observation and then averaging across the sample. For continuous variables (OperationYrs, Grassland, Precipitation, Temperature), marginal effects measure the change in adoption probability associated with a one-unit increase in the covariate. For categorical variables with more than two levels (Edu, ExtInfo, GovtInfo, Grass, HighCost, and Uncertain), marginal effects were computed relative to a designated reference category; each category-specific effect reflects the change in predicted adoption probability when moving from the reference category to that category.
5. Results and discussion
5.1. Summary of descriptive statistics
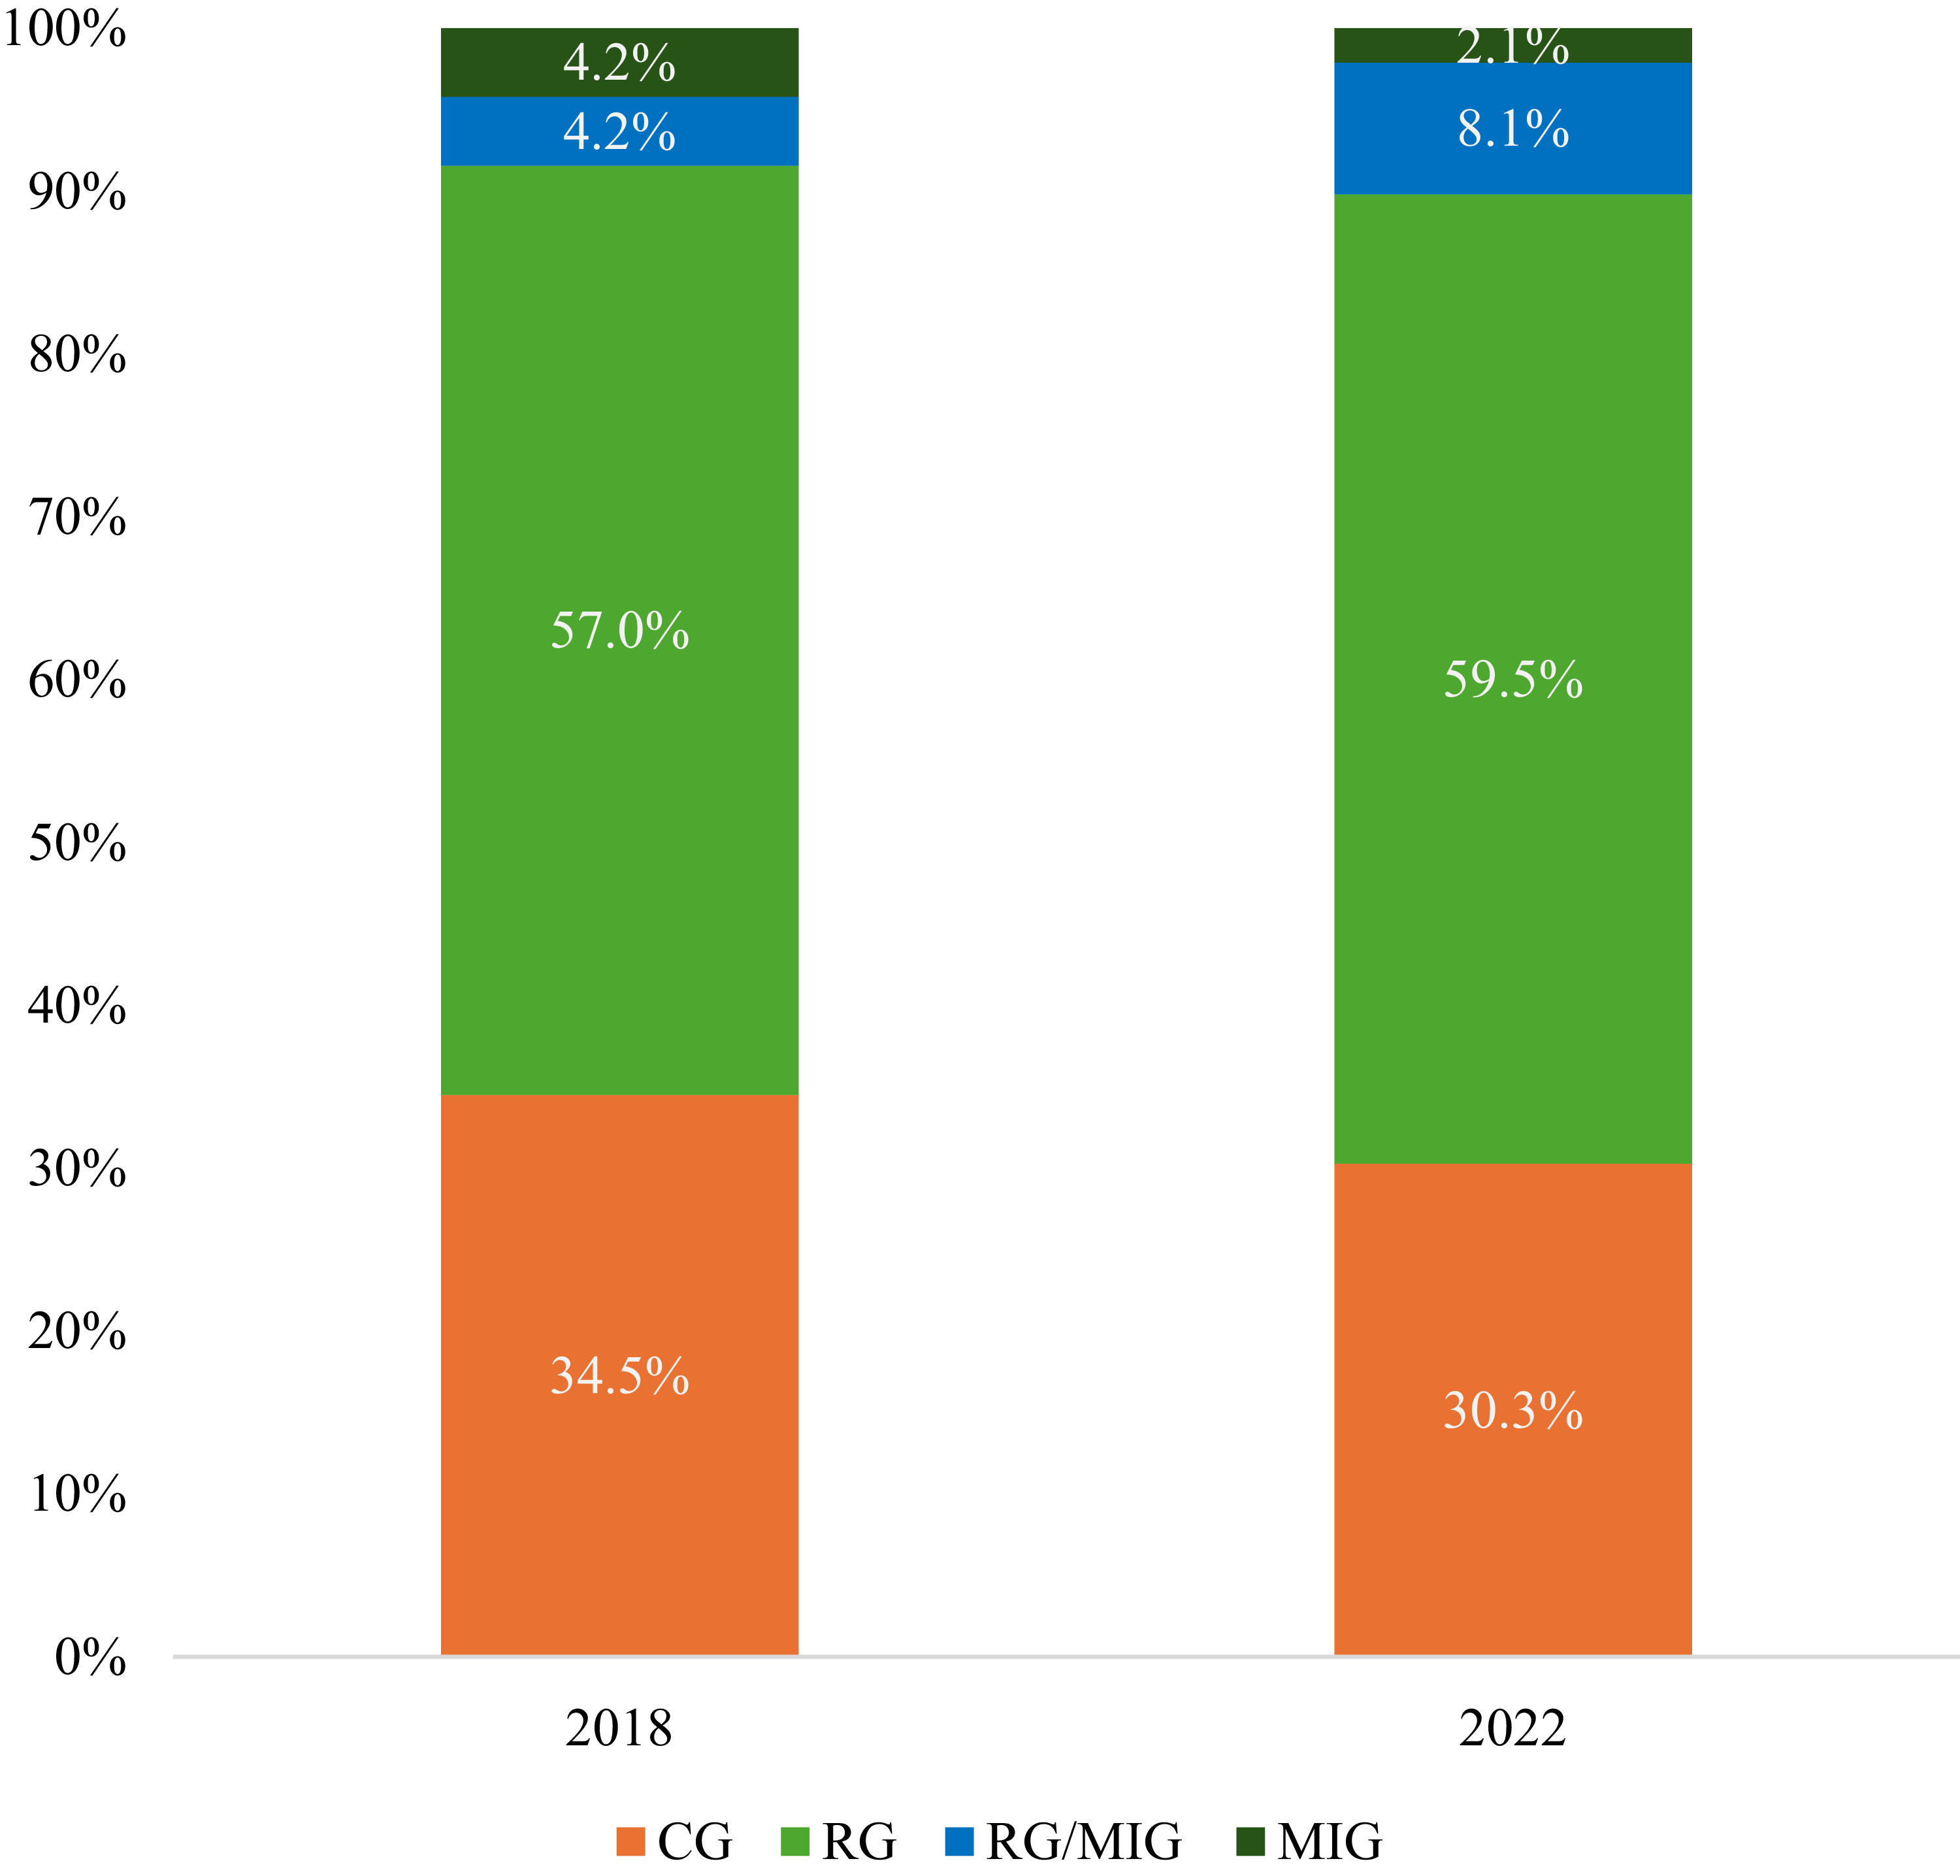
Out of the 334 producers who responded to both the 2018 and 2022 surveys, 284 reported their grazing practices in both years, providing the sample used to examine adoption changes across the two survey periods. Figure 2 shows that in 2018, 34.5% (98 producers) were non-adopters relying exclusively on CG. A majority – 57.0% (162 producers) – practiced only RG, while 4.2% (12 producers) practiced only MIG. An additional 4.2% (12 producers) reported using both RG and MIG in 2018, suggesting that some operations varied their grazing intensity across pastures within the same ranch. By 2022, the proportion of non-adopters declined to 30.3% (86 producers). Meanwhile, the share of producers practicing only RG increased slightly to 59.5% (169 producers). The percentage of producers using only MIG decreased to 2.1% (6 producers), while the proportion adopting both RG and MIG rose significantly to 8.1% (23 producers). This change in percentage over the four-year period reflects ongoing transition dynamics, indicating a general shift toward more intensive or mixed grazing systems.
Distribution of producers across grazing management practices in 2018 and 2022: continuous grazing (CG), rotational grazing (RG) only, management-intensive grazing (MIG) only, and a mixture of RG and MIG.

Table 1 summarizes the descriptive statistics for all independent variables used in the binary logistic regression models to explain grazing management practice transition decisions. On average, producers had been the primary operator of their farms (OperationYrs) for approximately 36 years, had completed at least some college or technical education (Edu), and managed roughly 2,670 acres of total grassland (Grassland).
The perceived importance of information from university extension (ExtInfo) and government agencies (GovtInfo) averaged 2.76 and 2.98, respectively, indicating that producers generally do not rely heavily on these institutional sources for guidance and support in their grazing management decisions. This pattern is consistent with Cantrill’s (Reference Cantrill2003) findings, which document farmer distrust of government agencies and other institutions due to a perceived disconnect from the practical realities of agricultural production. Such distrust can hinder effective communication and reduce participation in conservation programs (Gronewold, Burnett, and Meister, Reference Gronewold, Burnett and Meister2012).
Many producers recognized benefits associated with RG and MIG implementation, as reflected in their ratings. When asked about their perceptions of whether RG/MIG increases the percentage of desirable grass (Grass), producers reported an average rating of 3.09, indicating that they generally expected moderate improvement in this aspect of forage quality. At the same time, producers also identified several challenges related to RG and MIG adoption. Among the potential challenges, high installation costs (HighCost) received an average rating of 2.97, suggesting that producers viewed installation expenses as a notable barrier. The perceived challenge of uncertain outcomes (Uncertain) was rated somewhat lower, with a mean of 2.31, indicating that uncertainty surrounding the results of RG/MIG adoption may still pose concerns for some producers.
Climatic conditions varied substantially across the study area. Average growing-season precipitation (Precipitation) was 306.06 mm, ranging from 90.91 mm to 387.08 mm, while average minimum temperature (Temperature) was 14.41°C, with values ranging from 8.98°C to 23.67°C. This considerable variation in precipitation and temperature reflects the diverse environmental conditions under which beef cattle producers operate and may influence grazing management decisions and adoption behavior.
5.2. Observed transition patterns across grazing management practices
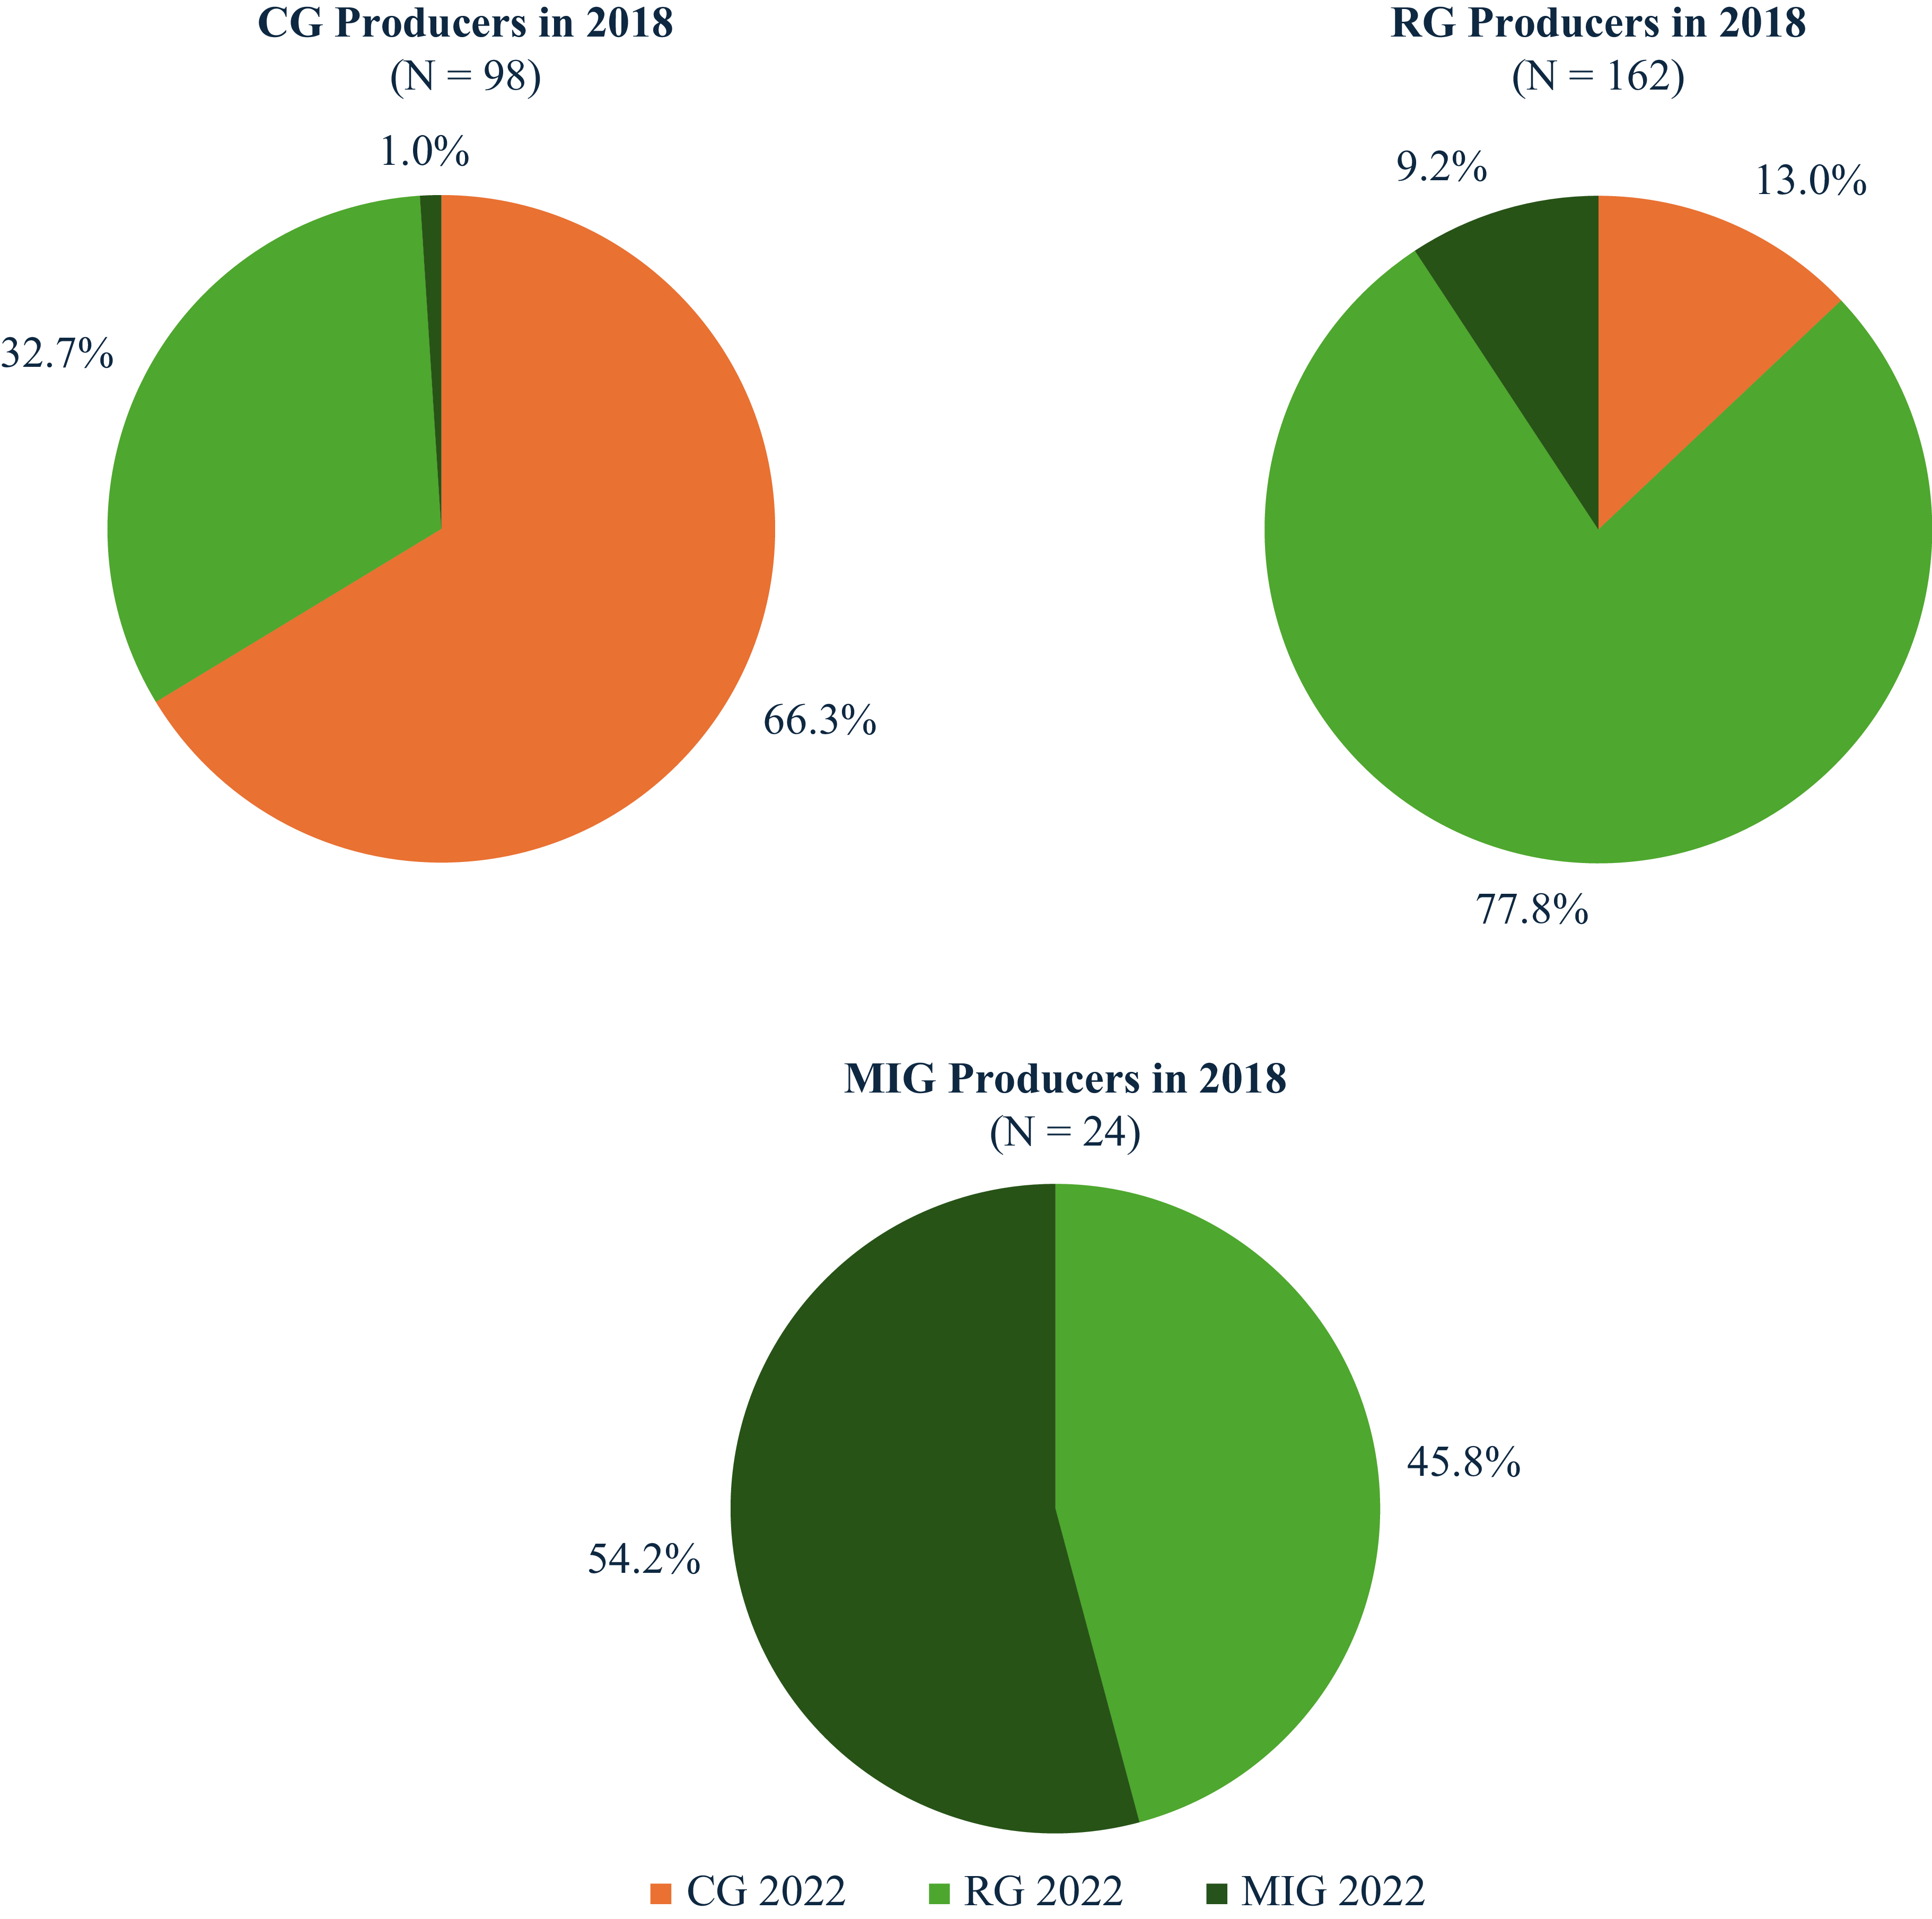
Figure 3 illustrates how producers with different baseline grazing systems, CG, RG, and MIG, shifted across management intensities over the four-year period. Given the relatively small number of producers in the RG/MIG mixture and MIG only categories, these two groups were combined into a single MIG category for subsequent discussion and analyses. Under this classification approach, any producer managing some or all portions of their land under MIG is treated as an MIG adopter.
Transitions in grazing management intensity from 2018 to 2022 across continuous grazing (CG), rotational grazing (RG), and management-intensive grazing (MIG), categorized by producers’ 2018 adoption status.

Among 2018 non-adopters who reported their adoption status in 2022 (N = 98), two-thirds (66.3%) continued CG, and about one-third (32.7%) transitioned upward to RG. Only one producer (1.0%) reported a direct transition from CG to MIG. This relatively high share of upward transitions from CG to RG or MIG indicates growing interest in more sustainable grazing systems. This pattern aligns with adoption frameworks in which producers update beliefs and adjust management when new information and anticipated benefits shift the perceived net returns in favor of adoption (Pannell et al., Reference Pannell, Marshall, Barr, Curtis, Vanclay and Wilkinson2006; Wang et al., Reference Wang, Jin, Kasu, Jacquet and Kumar2019).
Among 2018 RG adopters who reported their adoption status in 2022 (N = 162), approximately 77.8% continued their RG practice, indicating that retention of RG is common. Among the remaining producers, 9.2% further intensified their systems and incorporated MIG on some or all portions of their land. At the same time, 13.0% of 2018 RG adopters disadopted the RG practice and transitioned downward to CG. These transition patterns suggest that some RG adopters – likely those who have observed tangible benefits – are gradually intensifying their management strategies for improved outcomes, consistent with Wang et al. (Reference Wang, Jin, Kreuter and Teague2022). Yet the downward transitions indicate that some producers may also have encountered challenges or constraints that prompted them to discontinue RG.
Among the producers who practiced only MIG in 2018 and reported their adoption status in 2022 (N = 24), just over half (54.2%) continued to practice MIG. The remaining 45.8% disadopted MIG and transitioned down to RG. This shift may reflect the greater management complexity and increased labor demands associated with MIG relative to less intensive RG systems, as documented by Teague et al. (Reference Teague, Provenza, Kreuter, Steffens and Barnes2013) and Undersander et al. (Reference Undersander, Albert, Cosgrove, Johnson and Peterson2002). As a result, some producers may conclude that MIG does not align well with their operational needs.
5.3. Factors affecting grazing practice transitions
As of 2022, many producers continued using the same grazing strategy they reported in 2018, yet a notable subset transitioned between grazing systems, revealing meaningful variation in management behavior. These transitions offer insight into how producers adjust grazing practices over time and the factors that shape those adjustments. We focus on the determinants of both upward and downward movement across grazing-management intensity. Specifically, we examine the drivers of the transition from CG to RG (Model I), the intensification from RG to MIG (Model II), and the downward shift from RG or MIG to less management-intensive systems (Model III). Each transition is modeled as a binary outcome, and the relationship between the transition indicator and explanatory variables is estimated using logistic regression. Note that the sample sizes across ModelsI–III do not sum to the total number of respondents because 2018 RG adopters are included in both ModelII and ModelIII. This reflects the transition structure in which RG producers may move upward to MIG (ModelII) or downward to CG (ModelIII). Consequently, the combined model samples exceed the total number of respondents.
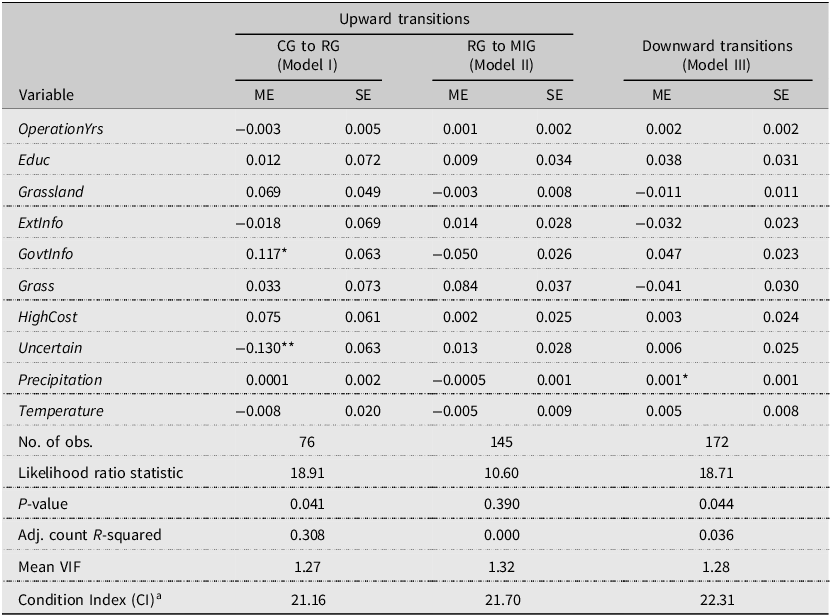
The resulting marginal effects, reported in Table 2, summarize how each factor influences the probability of transitioning between grazing systems. Mean variance inflation factors across the three models range from 1.27 to 1.32, and condition index (CI) values range from 21.16 to 22.31. Both diagnostics fall well below commonly accepted thresholds of 10 for VIF and 30 for CI (Belsley, Kuh, and Welsch, Reference Belsley, Kuh and Welsch1980), indicating that multicollinearity is not a concern in these specifications.
Marginal effects (ME) and standard errors (SE) for the factors affecting the continuous grazing (CG), rotational grazing (RG), and management-intensive grazing (MIG) transitions among farmers

Table 2. Long description
The table presents marginal effects (ME) and standard errors (SE) for factors affecting transitions between continuous grazing (CG), rotational grazing (RG), and management-intensive grazing (MIG) systems. The table is divided into three main sections: Upward transitions (CG to RG and RG to MIG) and Downward transitions (Model III). Each section lists variables such as OperationYrs, Educ, Grassland, ExtInfo, GovtInfo, Grass, HighCost, Uncertain, Precipitation, and Temperature, along with their corresponding ME and SE values. The table also includes summary statistics such as the number of observations, likelihood ratio statistic, P-value, adjusted count R-squared, mean variance inflation factor (VIF), and condition index (CI).
Note: single and double asterisks (* and **) indicate P < 0.10 and P < 0.05, respectively.
a The CI was computed excluding the constant following Belsley, Kuh, and Welsch (Reference Belsley, Kuh and Welsch1980) to avoid intercept-induced collinearity inflation.
Model I examines the factors that encouraged producers to transition from CG to RG. The model includes 76 farmers who were CG users in 2018, representing 22.8% of respondents who completed both survey waves, and compares continuing CG users with RG transitioners who adopted RG by 2022. The adjusted count R-squared of 0.308 indicates that Model I improves classification accuracy by 30.8% beyond always predicting the dominant outcome, producers continuing with their existing grazing practice, a category that already yields high baseline accuracy due to its predominance.
The results show that producers who viewed government-provided information as important were 11.7% more likely to transition from CG to RG (P < 0.10). This finding is consistent with prior research on best management practices, where trust in and reliance on government information sources have been associated with higher adoption rates (Prokopy et al., Reference Prokopy, Floress, Klotthor-Weinkauf and Baumgart-Getz2008; Westra and Olson, Reference Westra and Olson1997).
In contrast, perceived challenges related to uncertainty about RG outcomes significantly reduced the likelihood of transition from CG to RG by 13.0% (P < 0.05). This aligns with Wang et al. (Reference Wang, Jin, Kreuter, Feng, Hennessy, Teague and Che2020), who identify uncertainty as a major barrier among non-adopters of RG. Feder and Umali (Reference Feder and Umali1993) similarly argue that uncertainties related to output variability, input costs, and the effectiveness of new technologies can delay or limit adoption due to risk aversion. More recent work highlights how subjective risk perceptions can make new grazing practices appear economically unviable, reducing producers’ willingness to invest in them (Gormsen and Huber, Reference Gormsen and Huber2025).
Model II analyzed the factors associated with transitioning from RG to MIG between the two survey years. This analysis involves 145 RG adopters in 2018 – 43.4% of respondents who completed both surveys – and compares Continuing RG Adopters with MIG Transitioners, defined as producers who shifted partly or fully toward MIG by 2022. ModelII exhibited a weak overall fit, with an adjusted count R-squared of zero, indicating no improvement over always predicting the dominant outcome – producers continuing their RG practices. Consistently, the model yielded no statistically significant effects for the variables examined, which could be attributed to the complexity and gradual nature of RG-to-MIG transitions.
Among the 15 MIG transitioners, most continued to devote the majority of their acreage to RG rather than MIG: six allocated more land to RG than MIG, six allocated equal proportions to both practices, and only three allocated more land to MIG. These patterns suggest that transitioning from RG to MIG is typically a gradual, incremental process, rather than a discrete shift. Paine and Gildersleeve (Reference Paine and Gildersleeve2011) note that producers often require 10 to 20+ years to fully transition to MIG, suggesting that the four-year interval between the 2018 and 2022 surveys is too short to observe large-scale conversion. In addition, some of the continuing RG adopters may have intensified their management within RG, for example, from 4–8 paddocks to 9–15 paddocks, but still within the RG category. Such within-category intensification is not captured by the binary transition measure, potentially obscuring the relationships between factors analyzed and the likelihood of RG to MIG transition.
Model III assessed the determinants of disadoption decisions among the RG and MIG adopters to identify the factors that challenged producers’ continuity of these two grazing management practices. This model included 172 adopters of RG and MIG as of 2018, representing 51.5% of the total number of respondents who answered both surveys, contrasting Continuing Adopters with Downward Transitioners who shifted to a less intensive practice by 2022. ModelIII’s adjusted count R-squared of 0.036 indicates that the model provided only a 3.6% improvement in classification accuracy over always predicting the dominant outcome, i.e., continuation of RG or MIG practices.
As indicated in Table 2, Model III findings show that producers in regions with higher precipitation are more likely to disadopt RG or MIG, with every additional millimeter of rainfall increasing the likelihood of disadoption by 0.1% (P < 0.10). The pattern can be attributed to the diminished benefits of RG and MIG on vegetation and overall land management in regions with higher precipitation (Wang and Kreuter, Reference Wang and Kreuter2025; Wang et al., Reference Wang, Jin, Kreuter and Teague2022). Additionally, high-stocking-density grazing, which typically occurred under RG and MIG, can lead to severe soil compaction in wet conditions (Blanco-Canqui et al., Reference Blanco-Canqui, Wilke, Holman, Creech, Obour and Anderson2023). This compaction damages soil structure, reduces water infiltration, and inhibits vegetation growth (Centeri, Reference Centeri2022; Franzluebbers, Reference Franzluebbers2002; Greenwood and McKenzie, Reference Greenwood and McKenzie2001), increasing management difficulty and potentially prompting producers to revert to less intensive grazing systems.
A key consideration in interpreting the transition models is that only a small subset of producers experienced the specific movements across grazing systems being analyzed. Upward transitions to MIG are particularly uncommon, with only fifteen producers intensifying from RG to MIG between 2018 and 2022. Downward transitions from MIG to RG also involve few producers, and transitions from RG to CG, while more frequent, still represent a minority of RG adopters. When transition events are scarce, coefficient variances increase, constraining statistical power, which depends on the number of observed transitions rather than the total number of producers included in the models. As King and Zeng (Reference King and Zeng2001) demonstrate, rare events substantially reduce the effective sample size in logistic regression, making it difficult to detect significant marginal effects. This helps explain why relatively few covariates reach conventional significance thresholds in models analyzing infrequent transitions.
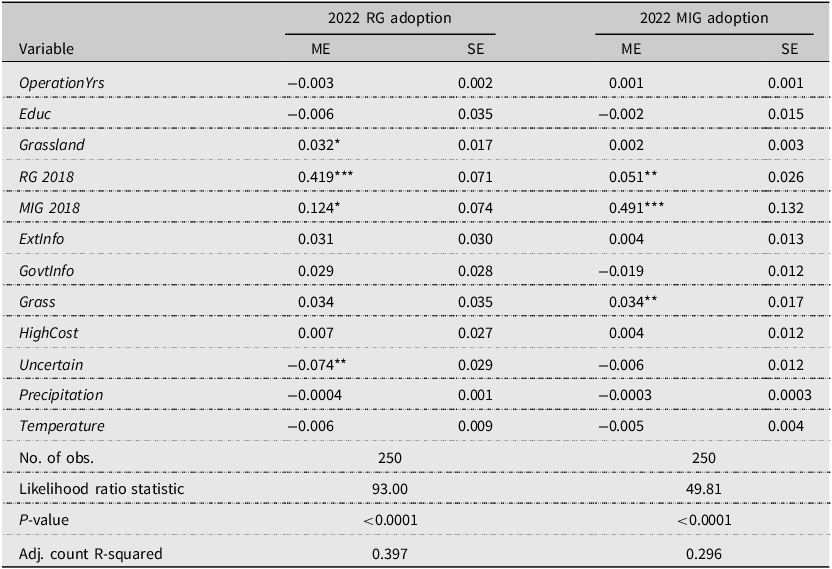
To determine whether the relationships identified in the transition-based framework remain consistent under different empirical formulations, we implemented sensitivity analyses to verify the reliability of the major findings. Specifically, we estimated two logistic models using 2022 RG and MIG adoption status, each coded as a binary indicator of adoption, as the dependent variables (Table A1). These models evaluate whether the relationships observed in the main specifications persist when adoption is modeled directly as a binary outcome rather than through the transition-based framework. Both models include the same set of independent variables reported in Table 2, along with indicators of 2018 adoption status. The models yield a reasonable overall fit to the data. The adjusted count R-squared of 0.397 indicates that the 2022 RG adoption model enhances classification accuracy by 39.7% beyond always predicting that the rancher is an RG adopter. While the 2022 MIG adoption model, with an adjusted count R-squared of 0.296, achieved a 29.6% increase in accuracy compared to assuming a rancher is an MIG non-adopter all the time. Overall, the main results closely align with the primary findings.
The first model evaluates RG adoption status in 2022 and shows that prior RG adoption in 2018 was associated with a 41.9% higher likelihood of continued adoption (P < 0.01), reinforcing the strong path dependence observed in the transition patterns. MIG adoption in 2018 was also associated with a 12.4% higher likelihood of RG adoption in 2022, suggesting that some producers continued to use MIG practices alongside RG. Producers with greater grassland area were 3.2% more likely to adopt RG in 2022 (P < 0.10), yet producers who perceived uncertainty about RG and MIG outcomes as a challenge in 2018 were 7.4% less likely to adopt RG in 2022 (P < 0.05). The second model evaluates MIG adoption status in 2022 and shows that RG adopters in 2018 were 5.1% more likely to transition upward to MIG in 2022 (P < 0.05), while MIG adopters in 2018 were 49.1% more likely to continue with MIG (P < 0.01). The perceived benefit of increasing desirable grass was also associated with a 3.4% higher likelihood of MIG adoption (P < 0.05).
Although the R-squared values indicate that the models capture meaningful patterns in grazing transition decisions, their modest size suggests that additional unmeasured factors also shape producers’ movement across grazing management practices. This is consistent with research emphasizing the complexity of grazing adoption, where decisions are influenced by interacting elements such as management strategies, ecological conditions, and climate variability (Wang et al., Reference Wang, Jin, Kreuter, Feng, Hennessy, Teague and Che2020). It is therefore expected that the variables included in our analysis explain only part of the broader decision environment surrounding grazing transitions.
6. Conclusion
This study provides the first producer-level evidence on how grazing-management practices evolve over time across CG, RG, and MIG. By linking two waves of survey data from 2018 to 2022, we document substantial heterogeneity in producers’ adoption trajectories and identify the factors shaping both upward and downward transitions in grazing intensity. The results demonstrate that grazing management is not a static choice but a dynamic process.
Importantly, our producer-level evidence indicates a clear shift toward more intensive grazing systems among producers. Over the four-year period (2018–2022), we observed on the individual farm level that one-third of CG users transitioned to RG, 9.2% of RG adopters had further progressed toward MIG; meanwhile, the retention rate of RG adopters was high (77.8%). These patterns suggest a broad willingness among producers to improve their ranching performance by implementing more intensive grazing management practices.
Our study identified the factors influencing the upward and downward transitions in grazing management intensity. Access to credible information, such as government resources, encourages transitions from CG to RG. Conversely, uncertainty about RG outcomes is a barrier to such transitions. Downward transitions from higher to lower levels of management intensity, such as from MIG to RG, or from RG to CG, are primarily influenced by climate factors, with a higher precipitation rate leading to an increased likelihood of disadoption, suggesting RG/MIG benefits could vary across different precipitation levels.
Given that adoption is not a single, irreversible decision but reflects ongoing transition dynamics, policies aimed at promoting sustainable grazing should address both the initial barriers to adoption and the continuing challenges that shape long-run retention. Expanding trusted information channels and reducing uncertainties surrounding RG implementation are essential for facilitating early transitions into RG. In contexts where RG or MIG is less suitable, CG may remain a more efficient option, as producers in these environments are more likely to disadopt intensive systems. However, in regions and operations where RG offers unrealized potential benefits, targeted outreach, technical support, and well-designed incentives can help accelerate adoption and strengthen grazing-system performance.
One limitation of our analysis is the relatively short interval between the two survey periods (2018–2022), which may not fully capture long-term changes in grazing-management adoption. A longer-horizon longitudinal dataset would allow future research to examine more gradual adjustments in producers’ grazing strategies and provide deeper insight into long-term adoption dynamics. Additionally, because our study focuses on producers in three states in the Northern and Southern Great Plains, extending similar surveys to other regions with substantial grazing-based beef production could help identify regional variation in adoption behavior and transition patterns.
Data availability statement
The data that support the findings of this study are not publicly available.
Author contribution
Airish Lou Yago: Data curation-Lead, Formal analysis-Lead, Investigation-Lead, Writing – original draft-Lead; Tong Wang: Conceptualization-Lead, Formal analysis-Supporting, Funding acquisition-Lead, Investigation-Supporting, Methodology-Equal, Resources-Lead, Supervision-Lead, Writing – original draft-Supporting, Writing – review & editing-Lead.
Financial support
This work was supported by the U.S. Department of Agriculture’s National Institute of Food and Agriculture (NIFA) under project award number 2017-67024-26279, and by the NIFA Inter-disciplinary Engagement in Animal Systems (IDEAS) program under award number 2021-10904.
Competing interests
The authors declare no competing interests.
AI contributions to research
Microsoft Copilot was used exclusively for language polishing and grammar refinement during manuscript preparation.
Appendix
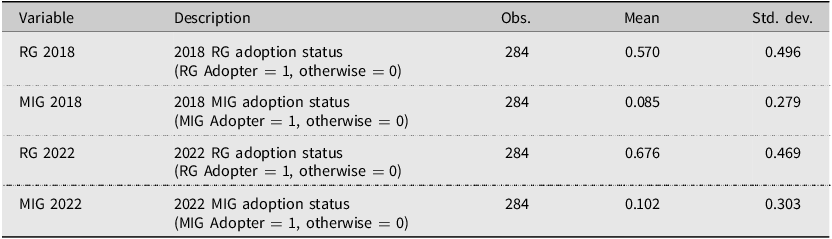
Description and summary statistics of 2018 and 2022 rotational grazing (RG) and management-intensive grazing (MIG) adoption status

Table A1 Long description
The table presents the description and summary statistics of the adoption status of rotational grazing (RG) and management-intensive grazing (MIG) for the years 2018 and 2022. It includes four rows and five columns. The columns are labeled Variable, Description, Obs., Mean, and Std. dev. The rows are labeled RG 2018, MIG 2018, RG 2022, and MIG 2022. Each row provides the adoption status, the number of observations, the mean, and the standard deviation. For RG 2018, the mean is 0.570 and the standard deviation is 0.496. For MIG 2018, the mean is 0.085 and the standard deviation is 0.279. For RG 2022, the mean is 0.676 and the standard deviation is 0.469. For MIG 2022, the mean is 0.102 and the standard deviation is 0.303.
Marginal effects (ME) and standard errors (SE) for the factors affecting the 2022 rotational grazing (RG) and management-intensive grazing (MIG) adoption status

Table A2 Long description
A table comparing factors affecting the 2022 rotational grazing (RG) and management-intensive grazing (MIG) adoption status. The table has 17 rows and 5 columns. Column headers are Variable, 2022 RG adoption ME, 2022 RG adoption SE, 2022 MIG adoption ME, and 2022 MIG adoption SE. Row labels include OperationYrs, Educ, Grassland, RG 2018, MIG 2018, ExtInfo, GovtInfo, Grass, HighCost, Uncertain, Precipitation, Temperature, No. of obs., Likelihood ratio statistic, P-value, and Adj. count R-squared. Notable trends include significant values for Grassland, RG 2018, MIG 2018, Grass, and Uncertain in affecting RG and MIG adoption status. The table also includes statistical measures like the likelihood ratio statistic, P-value, and adjusted count R-squared.
Note: single, double, and triple asterisks (*, **, and ***) indicate P < 0.10, P < 0.05, and P < 0.01, respectively.


 Open access

