






1. Introduction
Identifying the flow structure that dominates the evolution of a turbulent boundary layer is a topic of intense historical and contemporary research. The perspective held by a number of researchers is that the boundary layer is instantaneously populated by a set of coherent motions that dominate the distribution of Reynolds shear stress and transport in a turbulent boundary layer (TBL) (Theodorsen Reference Theodorsen1952; Head & Bandyopadhyay Reference Head and Bandyopadhyay1981; Zhou et al. Reference Zhou, Adrian, Balachandar and Kendall1999; Adrian, Meinhart & Tomkins Reference Adrian, Meinhart and Tomkins2000; Ganapathisubramani, Longmire & Marusic Reference Ganapathisubramani, Longmire and Marusic2003; Dong et al. Reference Dong, Lozano-Durán, Sekimoto and Jiménez2017; Baidya et al. Reference Baidya2019). These motions have been shown to extend for several boundary layer turnovers and ‘meander’ in the spanwise direction (Hutchins & Marusic Reference Hutchins and Marusic2007). In a streamwise–wall-normal plane, these structures manifest as regions of approximately uniform momentum typically referred to as uniform momentum zones (UMZs) (Meinhart & Adrian Reference Meinhart and Adrian1995; Adrian et al. Reference Adrian, Meinhart and Tomkins2000; de Silva, Hutchins & Marusic Reference de Silva, Hutchins and Marusic2016; de Silva et al. Reference de Silva, Philip, Hutchins and Marusic2017; Laskari et al. Reference Laskari, de Kat, Hearst and Ganapathisubramani2018). These zones are believed to represent the velocity entrained beneath a packet of hairpin vortices and are separated by sharp shear events that create a layered instantaneous structure in a TBL (Eisma et al. Reference Eisma, Westerweel, Ooms and Elsinga2015; de Silva et al. Reference de Silva, Philip, Hutchins and Marusic2017). Recent works have examined the time evolution of these structures (Laskari et al. Reference Laskari, de Kat, Hearst and Ganapathisubramani2018), and their characteristics as a function of friction velocity Reynolds number  $Re_{\tau } = U_\tau \delta / \nu$ (de Silva et al. Reference de Silva, Hutchins and Marusic2016), where
 $U_\tau$ is the friction velocity,
 $\delta$ is the boundary layer thickness and
 $\nu$ is the kinematic viscosity. These instantaneous flow features were also observed through reduced-order models of the large-scale coherence in TBLs based on the Navier–Stokes equations (Saxton-Fox & McKeon Reference Saxton-Fox and McKeon2017; McKeon Reference McKeon2019). Furthermore, UMZs have been used in models that are able to reproduce boundary layer statistics up to fourth order (Bautista et al. Reference Bautista, Ebadi, White, Chini and Klewicki2019).
The general flow structure of UMZs located immediately above a wall with a bulk of fluid moving above them is not limited to zero-pressure-gradient TBLs. UMZs have been reported above the walls for turbulent channel (Kwon et al. Reference Kwon, Philip, de Silva, Hutchins and Monty2014; Anderson & Salesky Reference Anderson and Salesky2021) and pipe flows (Chen, Chung & Wan Reference Chen, Chung and Wan2020; Gul, Elsinga & Westerweel Reference Gul, Elsinga and Westerweel2020), both of which have a ‘core’ region that is also turbulent. However, the existence of UMZs has not been rigorously assessed for a TBL subjected to freestream turbulence (FST). This flow is perhaps of more practical interest than the canonical zero-pressure-gradient TBL because most engineering flows experience some degree of FST. Moreover, Hearst, Dogan & Ganapathisubramani (Reference Hearst, Dogan and Ganapathisubramani2018) have shown that one can achieve Reynolds numbers up to  $Re_{\tau } \approx 5400$ in a laboratory-scale (4 m long) wind tunnel by generating high intensity FST above a TBL; such
 $Re_{\tau }$ are typically only achievable in specialised facilities, e.g. Nickels et al. (Reference Nickels, Marusic, Hafez and Chong2005, Reference Nickels, Marusic, Hafez, Hutchins and Chong2007), Klewicki (Reference Klewicki2010) and Vincenti et al. (Reference Vincenti, Klewicki, Morrill-Winter, White and Wosnik2013). These flows also exhibit qualitatively similar spectrograms (Sharp, Neuscamman & Warhaft Reference Sharp, Neuscamman and Warhaft2009; Dogan, Hanson & Ganapathisubramani Reference Dogan, Hanson and Ganapathisubramani2016; Hearst et al. Reference Hearst, Dogan and Ganapathisubramani2018), amplitude modulation (Dogan, Hearst & Ganapathisubramani Reference Dogan, Hearst and Ganapathisubramani2017) and spatial coherence (Dogan et al. Reference Dogan, Hearst, Hanson and Ganapathisubramani2019) to canonical TBLs at similar
 $Re_{\tau }$; thus, they may be a useful way for fluid mechanics experimentalist to simulate high
 $Re_{\tau }$ conditions in a typical size facility.
Given the aforementioned similarities between a TBL subjected to FST and a canonical TBL, one might expect to see similar instantaneous structures. To date, the only instantaneous images available for these flows are the flow visualisations of Hancock & Bradshaw (Reference Hancock and Bradshaw1989) and instantaneous fields extracted from the direct numerical simulations (DNS) of You & Zaki (Reference You and Zaki2019), Wu, Wallace & Hickey (Reference Wu, Wallace and Hickey2019) and Kozul et al. (Reference Kozul, Hearst, Monty, Ganapathisubramani and Chung2020); while Dogan et al. (Reference Dogan, Hearst, Hanson and Ganapathisubramani2019) had instantaneous flow fields, their work focussed on the spatial statistics. The visualisations of Hancock & Bradshaw (Reference Hancock and Bradshaw1989) appear to show a more jagged interface with the freestream for the turbulent case compared to the approximately laminar freestream. However, these images did not allow for analysis of the internal boundary layer structure, nor were they quantitative. Kozul et al. (Reference Kozul, Hearst, Monty, Ganapathisubramani and Chung2020) explicitly compared their instantaneous structure to that of Hancock & Bradshaw (Reference Hancock and Bradshaw1989) and found qualitatively good agreement, however, the main focus of their study was the statistics of the temporal boundary layer subject to a sudden injection of FST. The DNS studies of You & Zaki (Reference You and Zaki2019) and Wu et al. (Reference Wu, Wallace and Hickey2019) roughly echo these results, however, they investigate only a single FST case at limited Reynolds numbers. This is understandable as it is computationally expensive to compare multiple cases and achieve higher Reynolds numbers. Moreover, there was no particular focus on UMZs, although Wu et al. (Reference Wu, Wallace and Hickey2019) did identify an instantaneous ‘boundary layer turbulence and freestream turbulence interface’ separating the two flow regions for their one case. There is thus a need to perform detailed quantitative analysis on the instantaneous structure within these TBLs subjected to different levels of FST.
While investigating wall-bounded UMZs, de Silva et al. (Reference de Silva, Hutchins and Marusic2016) found that it was important to exclude the velocity field above the instantaneous separation between the wall-bounded flow and the approximately laminar freestream. This was done to improve the detectability of UMZs present at the edge of the boundary layer, which would otherwise be masked by the freestream velocity distribution. The primary reason for this is that the freestream itself presents as a large UMZ when using the histogram modal velocity process that has become common for this type of analysis, cf. Meinhart & Adrian (Reference Meinhart and Adrian1995), de Silva et al. (Reference de Silva, Hutchins and Marusic2016) and Appendix A. In fact, this idea is exploited by those studying the ‘quiescent core’ of turbulent channel flow to identify the edges of the core because it is itself a UMZ (Kwon et al. Reference Kwon, Philip, de Silva, Hutchins and Monty2014; Yang, Hwang & Sung Reference Yang, Hwang and Sung2016; Jie et al. Reference Jie, Xu, Dawson, Andersson and Zhao2019).
Given the existing body of work, an open question is how does the instantaneous flow near a wall manifest beneath FST. We know that a canonical TBL has UMZs, and that their number is  $Re_{\tau }$ dependent (de Silva et al. Reference de Silva, Hutchins and Marusic2016). UMZs also exist in internal flows, which feature a quiescent, but turbulent, core that is separate from the flow structure immediately adjacent to the walls (Kwon et al. Reference Kwon, Philip, de Silva, Hutchins and Monty2014; Yang et al. Reference Yang, Hwang and Sung2016; Jie et al. Reference Jie, Xu, Dawson, Andersson and Zhao2019; Chen et al. Reference Chen, Chung and Wan2020; Gul et al. Reference Gul, Elsinga and Westerweel2020). Moreover, the TBL experiments of Laskari et al. (Reference Laskari, de Kat, Hearst and Ganapathisubramani2018) detected UMZs beneath a freestream of approximately 3 % turbulence. Finally, the recent study of Wu et al. (Reference Wu, Wallace and Hickey2019) also identified an instantaneous separation between the freestream and the wall-bounded flow in DNS of a zero-pressure-gradient TBL. Thus, UMZs exist in flows with turbulence in the freestream, and the flow may be separated into the flow directly influenced by the wall and the turbulent flow in the freestream or core. This has symmetries with the mean velocity profiles of the various wall-bounded flows (zero-pressure-gradient TBLs, internal flows, TBLs subject to FST), which share similar viscous sub-layers, buffer layers and log regions, and primarily differ in the wake region. For the flows with some degree of turbulence in the freestream or core, there is still an instantaneous separation between the UMZs next to the wall and the freestream/core, and this is the top edge of the upper-most UMZ. The problem which remains unaddressed is how the level of FST influences the structure of the UMZs and the height to which they exist. This problem cannot be addressed by internal flows whose centreline conditions are set by the inlet and boundary conditions.
Accordingly, the present study seeks to examine the instantaneous structure of a TBL over a flat plate subjected to FST in the streamwise–wall-normal plane using planar particle image velocimetry (PIV). In particular, a canonical TBL is compared to two flows with increasing FST intensity ( $u'_{\infty }/ U_{\infty }$). Section 2 details the experimental set-up. Section 3 details the flow characteristics and identifies the mean differences between the produced flows. Section 4 describes the detection methodologies for UMZs. Section 5 investigates the existence of a zonal structure (composed of UMZs and shear layers) in all three flows and comments on their differences. Section 6 discusses the top edge of the upper-most UMZ. Section 7 examines if a simple model where isotropic turbulence is superimposed on a canonical TBL can replicate some of the phenomena observed in a TBL with FST. Finally, § 8 provides a summary of our findings.
2. Experimental procedure
The physical design of the present experiments is the same as that of Dogan et al. (Reference Dogan, Hearst, Hanson and Ganapathisubramani2019). As such, the experiments are only briefly reviewed here and we refer the reader to the aforementioned work for greater detail. All measurements were performed in the  $0.9\ \textrm {m} \times 0.6\ \textrm {m} \times 4.5\ \textrm {m}$ suction wind tunnel at the University of Southampton. The freestream turbulence was generated by an active grid inspired by the original design of Makita (Reference Makita1991). This apparatus features a series of square wings mounted to rotating round rods that are actuated by stepper motors. By changing the grid parameters (e.g. speed of rotation, incoming flow velocity, wing blockage) a certain degree of control authority can be exerted over the turbulence intensity, anisotropy and length scales (Hearst & Lavoie Reference Hearst and Lavoie2015; Hearst & Ganapathisubramani Reference Hearst and Ganapathisubramani2017). The present grid is made up of a
 $11 \times 7$ array of square wings mounted to the round rods. The spacing between grid rods is
 $M = 81\ \textrm {mm}$, and the wings themselves are
 $55.9\ \textrm {mm}\times 55.9\ \textrm {mm}$. A picture of the grid outside of the wind tunnel is presented in figure 1(a). The boundary layer was formed on a flat plate suspended above the wind tunnel floor. The flat plate began 300 mm downstream of the grid and extended 4.1 m downstream. The boundary layer was tripped by a zig–zag wire placed 90 mm from the leading edge of the flat plate. A schematic of the set-up along with the reference coordinate system is provided in figure 1(b).
Details of the experimental set-up: (a) active grid positioned outside of the wind tunnel, and (b) schematic of wind tunnel test section.

In the present study, three different cases are investigated: (i) a low turbulence intensity case to represent a canonical TBL (REF), (ii) a moderate turbulence intensity case (FST-8) and (iii) a high turbulence intensity case (FST-13). FST-8 and FST-13 are equivalent to cases ‘B’ and ‘D’, respectively, from Dogan et al. (Reference Dogan, Hanson and Ganapathisubramani2016, Reference Dogan, Hearst and Ganapathisubramani2017, Reference Dogan, Hearst, Hanson and Ganapathisubramani2019). For the two FST cases, the active grid wing rotational rate is randomly varied between 2 and 6 Hz (modelled after ‘case 14’ from Larssen & Devenport Reference Larssen and Devenport2011), and the operational parameters for the two cases differ only in that they use wings with different blockage. FST-8 employed square wings with holes, while FST-13 employed solid square wings. The square wings with holes have approximately 75 % of the surface area of the solid square wings. Using the same rotational parameters but changing the wing geometry results in FST with similar length scales and isotropy, but different turbulence intensity (Hearst & Lavoie Reference Hearst and Lavoie2015). All three test cases were performed at  $U_\infty = 10\ \textrm {m}\,\textrm {s}^{-1}$ at a location starting
 $40M$ from the grid; here
 $\cdot _\infty$ denotes a freestream quantity and
 $U$ is the mean velocity in the streamwise direction. This velocity results in the same
 $Re_x = U_\infty x / \nu = 2.3 \times 10^6$ for all cases. A summary of the flow parameters for each test case is provided in table 1. The Taylor microscale Reynolds number,
 $Re_{\lambda ,\infty } = u'_\infty \lambda _\infty / \nu$, and
 $U_\tau$ are taken from Dogan et al. (Reference Dogan, Hanson and Ganapathisubramani2016), where they were measured with a hot-wire probe and a Preston tube, respectively. The friction velocity measurements were later confirmed with oil-film interferometry (Esteban et al. Reference Esteban, Dogan, Rodríguez-López and Ganapathisubramani2017).
Test case parameters.

Planar PIV was used to capture the flow physics for each test case. The light sheet was illuminated by a Litron Lasers Nano L200 15PIV Nd:YAG laser (532 nm wavelength,  $200\ \textrm {mJ}\,\textrm {pulse}^{-1}$, 15 Hz repetition rate). For the FST cases, three LaVision ImagerProLX CCD 16 mega-pixel cameras fitted with Nikon Nikkor 200 mm lenses were oriented in a T-shaped formation (figure 2a) to acquire both the boundary layer and the freestream (figure 2b); however, in the present analysis we focus on a
 $0.5 \delta \times 1.4 \delta$ window from the centre of the field of view. For REF, the same field of view was achieved with a single camera because
 $\delta$ is nearly a factor of three smaller than the FST cases (table 1).
(a) Camera arrangement and (b) captured field of view. The black dashed area is the investigated region in the present study. The full field of view was investigated in the study by Dogan et al. (Reference Dogan, Hearst, Hanson and Ganapathisubramani2019).

The images were processed with LaVision DaVis 8.2.2. The final vector spacing was 8.5 viscous units, or 1.7 Kolmogorov microscales, or better for all cases (using the smallest Kolmogorov scale anywhere in the flow as estimated from the previous hot-wire measurements of Hearst et al. Reference Hearst, Dogan and Ganapathisubramani2018); 50 % overlap was used, thus the spatial resolution is twice the vector spacing. Pixel locking has been identified as having an adverse influence on the present analysis (Kwon et al. Reference Kwon, Philip, de Silva, Hutchins and Monty2014). As such, care was taken throughout processing to mitigate the effects of pixel locking using the approach described by Hearst & Ganapathisubramani (Reference Hearst and Ganapathisubramani2015). Specific details on the processing and post-processing of the data can be found in Dogan et al. (Reference Dogan, Hearst, Hanson and Ganapathisubramani2019).
3. Flow characterisation
Dogan et al. (Reference Dogan, Hanson and Ganapathisubramani2016, Reference Dogan, Hearst and Ganapathisubramani2017) and Hearst et al. (Reference Hearst, Dogan and Ganapathisubramani2018) explored the effects of FST on a TBL in detail with hot-wire anemometry, including cases FST-8 and FST-13 used here. The same cases were later explored in greater depth by Dogan et al. (Reference Dogan, Hearst, Hanson and Ganapathisubramani2019) through the same PIV data used herein. In this section, some key differences between the canonical TBL case (REF) and the two FST cases are highlighted. Particular emphasis is placed on instantaneous effects; see Dogan et al. (Reference Dogan, Hanson and Ganapathisubramani2016, Reference Dogan, Hearst and Ganapathisubramani2017) for details on the single-point statistics and amplitude modulation, and Dogan et al. (Reference Dogan, Hearst, Hanson and Ganapathisubramani2019) for statistical information on the spatial data. The minor discrepancies in the reported length scales and Reynolds numbers between the previous and present work are related to the difference in measurement techniques used to measure the flow and minor changes to the definitions of certain parameters.
Instantaneous streamwise velocity, denoted  $\tilde {U}$, snapshots of the flow field with and without FST are presented in figure 3(a–c), which reveals clear qualitative differences in the flows. Specifically, for the canonical case (REF), the TBL is characterised by a velocity deficit near the wall that decreases with increasing
 $y$ until the freestream, where the flow moves uniformly at
 $U_{\infty }$ (with very minor fluctuations). On the other hand, the two FST cases are markedly different as they both exhibit a velocity deficit region near the wall, however, the flow above this region is composed of patches of
 $\tilde {U} > U_{\infty }$ and
 $\tilde {U} < U_{\infty }$. In this sense, the concept of
 $U_{\infty }$ exists only as the mean of the instantaneous fluctuations in the freestream velocity, and does not describe a coherent region instantaneously. While this result is expected, it will play largely into the analysis that follows. This result also makes it difficult or impossible to instantaneously separate the freestream from the boundary layer using the local seeding approach (because information is needed for the freestream as well) or instantaneous homogeneity approach (because the freestream is not instantaneously homogeneous) of Reuther & Kähler (Reference Reuther and Kähler2018).
Instantaneous streamwise velocity flow fields for (a) REF, (b) FST-8 and (c) FST-13. Profiles of the (d) mean velocity, and (e) turbulence intensity normalised by the FST intensity. For (d,e), (—) REF, ( $--$, red) FST-8 and (
 $- \cdot -$, blue) FST-13.

The mean velocity profiles normalised by outer variables are presented in figure 3(d) for each case. When comparing the canonical REF profile to that of FST-8 and FST-13, it is evident that the boundary layer has become ‘fuller’ with the addition of FST; here we use the term ‘fuller’ to describe the situation where there is more streamwise momentum closer to the wall. The same phenomenon was identified by Hearst, Gomit & Ganapathisubramani (Reference Hearst, Gomit and Ganapathisubramani2016) who used FST to adjust the boundary layer profile in a study focussing on the wake of cubes.
The representation in figure 3(d) may lead to the impression that  $\delta$ is smaller for the FST cases, however, the opposite is true. Table 1 indicates that as
 $u'_{\infty }/ U_{\infty }$ is increased,
 $\delta$ grows. Here, the boundary layer thickness (
 $\delta$) is defined as the height at which the mean turbulence intensity profile (
 $u'/U$) is within 1 % of the turbulence intensity in the freestream (
 $u'_{\infty }/ U_{\infty }$); profiles of the turbulence intensity are given in figure 3(e). This boundary layer definition was chosen because a traditional
 $\delta _{0.99}$ definition based on the mean profiles did not produce an estimate of the boundary layer thickness that captured the entirety of the region influenced by the wall and iterative methods – such as that of Perry & Li (Reference Perry and Li1990), which was used by Dogan et al. (Reference Dogan, Hanson and Ganapathisubramani2016) – could not be used effectively due to insufficient near-wall resolution to converge the integral scheme. The present
 $\delta$ estimation approach was also adopted by Dogan et al. (Reference Dogan, Hearst, Hanson and Ganapathisubramani2019).
The boundary layer profiles normalised by wall units were presented by Dogan et al. (Reference Dogan, Hearst, Hanson and Ganapathisubramani2019), and figure 2(a) therein shows results from both the present PIV and earlier hot-wire anemometry; these are shown to be in good agreement. In general, the law of the wall is observed for the cases with FST that agree with DNS and canonical TBL measurements from the wall up until the start of the wake region. The wake region is destroyed by the presence of FST. Details on the inner-unit-normalised velocity profiles and the wake are topics of other works (Dogan et al. Reference Dogan, Hanson and Ganapathisubramani2016, Reference Dogan, Hearst and Ganapathisubramani2017, Reference Dogan, Hearst, Hanson and Ganapathisubramani2019; Hearst et al. Reference Hearst, Dogan and Ganapathisubramani2018), and are not discussed further here.
We previously remarked that the instantaneous distribution of velocity in the freestream was one of the major differences between canonical TBLs and the cases with FST. This is illustrated in figure 4 where instantaneous fields of the signed (by vorticity) swirling strength,  $\lambda _s$, are provided for each case; the contours plotted in this figure as well as a deeper analysis of
 $\lambda _s$ will be addressed later in this work. For REF, all swirling strength is contained near the wall and is predominantly signed by the wall (i.e. clockwise rotation in the present coordinate system results in
 $\lambda _s < 0$). For the two FST cases, there is a region near the wall where the swirling strength is predominantly signed by the wall, but as one moves up into the freestream there is an equal distribution of clockwise and counter-clockwise swirl. Thus, if one is in search of an instantaneous limit to the boundary layer, one cannot use an approach where the limit is associated with approximately zero enstrophy because there is enstrophy instantaneously in the freestream.
Instantaneous signed swirling strength fields for (a) REF, (b) FST-8 and (c) FST-13. The black contour line marks the top edge of the upper-most UMZ.

4. Detection methodologies
4.1. Detecting the top of the UMZs
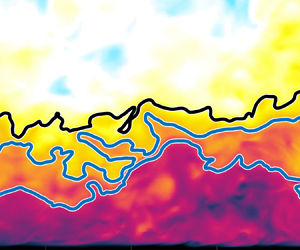
de Silva et al. (Reference de Silva, Hutchins and Marusic2016) identified that it is important to remove velocity vectors associated with the freestream when using a histogram-based approach to detect the UMZs within the boundary layer. The reason for this is that the freestream presents as a large UMZ and some low velocity vectors within it mask the instantaneous histogram of the flow near the wall. In their work, vectors above the turbulent/non-turbulence interface (TNTI) were removed from the modal velocity analysis. The TNTI can alternatively be thought of as the top of the upper-most UMZ in the flow. This is the context in which we approach the problem as our entire flow is turbulent. In the present study, if vectors associated with the freestream flow are not removed, then the high levels of turbulence in the freestream mask any zonal structure in the boundary layer (Appendix A).
The problem of identifying the limiting contour for UMZ detection for a TBL with a turbulent freestream has actually already been addressed by Laskari et al. (Reference Laskari, de Kat, Hearst and Ganapathisubramani2018) for a freestream with 3 % turbulence intensity and we follow a similar approach. They used a modified form of the kinetic energy deficit approach of Chauhan et al. (Reference Chauhan, Philip, de Silva, Hutchins and Marusic2014a); Chauhan, Philip & Marusic (Reference Chauhan, Philip and Marusic2014b), who defined the kinetic energy deficit as,
 \begin{equation} \tilde{k} = 100 \times \frac{1}{9 U_\infty^2} \sum^{1}_{m,n={-}1} [(\tilde{U}_{m,n} - U_{\infty})^2 + \tilde{V}_{m,n}^2], \end{equation}
where  $\tilde {\cdot }$ denotes an instantaneous quantity, the indices represent position in the PIV field and the sum is in effect an average over a
 $3 \times 3$ window. Laskari et al. (Reference Laskari, de Kat, Hearst and Ganapathisubramani2018) redefined the thresholding of
 $\tilde {k}$ to accommodate the significant background energy in the freestream by setting it to be at a level where the intermittency profile became constant (but not necessarily 0) above
 $\delta$. Without this step, their TNTI statistics were significantly different from those measured in earlier studies.
In this spirit, we investigated the effect of several threshold levels on the present analysis. Figure 5(a) shows contours drawn at six arbitrary threshold levels ( $1.0 \le k_{th}/k_\infty \le 6.0$) over a normalised instantaneous kinetic energy deficit map (
 $\tilde {k}/k_\infty$) for FST-8 (which is a representative example of all cases);
 $k_\infty$ is the mean value of
 $\tilde {k}$ in the freestream across all images and positions for a particular case. The figure illustrates that despite changes in the threshold of 60 %, 100 %, 300 %, 400 % and 500 %, the instantaneous contours are still grouped into only two distinct sets. The higher three thresholds are grouped together closer to the surface than the lower three thresholds which are grouped farther from the wall. Between them is an area of approximately uniform momentum. Figure 5(b) identifies that the reason for this preferential positioning of the contours near each other is a result of their alignment with shear events. In effect, the contour lines trace a path from one shear event to the next across the field of view. Similar observations were made by Adrian et al. (Reference Adrian, Meinhart and Tomkins2000, figure 17), Eisma et al. (Reference Eisma, Westerweel, Ooms and Elsinga2015, figure 3) and de Silva et al. (Reference de Silva, Hutchins and Marusic2016, figure 4), and have been discussed or hypothesised in a general sense for some time, e.g. Hunt & Carruthers (Reference Hunt and Carruthers1990), Hunt & Durbin (Reference Hunt and Durbin1999) and Hunt et al. (Reference Hunt, Eames, da Silva and Westerweel2011). It should be noted though that the shear events that the contours track are discontinuous, and thus while the contours connect the shear events, they do not represent a continuous shear event.
Instantaneous (a) kinetic energy deficit and (b) wall-normal shear fields with continuous contours at  $k_{th}/k_\infty = 1.0$, 1.6, 2.0, 4.0, 5.0 and 6.0 with increasing thresholds being the lines closer to the wall.

In figure 6, probability density functions (p.d.f.s) are presented for the location of the contours for the same thresholding levels as above. The figure illustrates that, while the variation in the contour position does change as a function of  $k_{th}$, its most common position (i.e. the peak in the p.d.f.) is relatively fixed for a 500 % increase to the threshold value for the FST cases; consider that the
 $y$-axis is a log scale. Specifically, for the illustrated threshold levels (
 $1.0 \le k_{th}/k_\infty \le 5.0$), the peak in the instantaneous distribution of the contour for the FST cases is relatively insensitive to
 $k_{th}$, changing by
 $0.03\delta$ for the worst case.
The p.d.f.s of the instantaneous location of the interface for different threshold levels:  $k_{th}/k_\infty = 1$, 1.6, 2, 3, 4 and 5 (from darkest to lightest). The selected threshold level is identified with a thicker line.

This phenomenon of the alignment of contours along shear events and subsequent mean position insensitivity highlights a certain degree of robustness in the analysis, i.e. a degree of leniency with respect to the selection of a threshold level can be taken without influencing the conclusions drawn in the present work. This is discussed in greater detail in Appendix A. This realisation echoes the sentiment that the threshold is in fact a range rather than a specific value as stated explicitly by Wu et al. (Reference Wu, Wallace and Hickey2019) and implicitly by Borrell & Jiménez (Reference Borrell and Jiménez2016) and Watanabe, Zhang & Nagata (Reference Watanabe, Zhang and Nagata2018).
A key difference between the REF case and the FST cases is that a continuous contour is not guaranteed to exist for every threshold level in the flows with FST. This is illustrated for various thresholds in figure 7, which shows the percentage of snapshots with a continuous contour across a  $0.5\delta$ field of view at a given threshold level. For REF, thresholds in the range
 $4 \le k_{th}/k_\infty \le 150$ occur in every snapshot. However, no
 $k_{th}$ results in a continuous contour in all snapshots for the FST cases. Maxima exist at
 $k_{th}/k_\infty = 1.6$ for FST-8 with the threshold existing in 96.5 % of snapshots, and
 $k_{th}/k_\infty = 1$ for FST-13 with the threshold existing in 88.2 % of snapshots.
Percentage of images that a continuous contour exists at  $k_{th}$ over a
 $0.5\delta$ window for (—) REF, (
 $--$, red) FST-8 and (
 $- \cdot -$, blue) FST-13.

Given that for the FST cases the most likely position of the contour is not strongly dependent on  $k_{th}/k_\infty$ (figure 6), and the instantaneous contours tend to cluster in approximately the same location for several threshold levels (figure 5), we select the threshold level
 $k_{th}/k_\infty$ to be the value that represents the most common contour in the present measurements; i.e.
 $k_{th}/k_\infty = 1.6$ for FST-8 and
 $k_{th}/k_\infty = 1.0$ for FST-13. Similarly, for consistency, we choose the lowest threshold value that occurs in 100 % of the snapshots for REF, i.e.
 $k_{th}/k_\infty = 4.0$. These contours represent events that occur the most frequently in the present dataset and in fact also result in the detection of the most UMZs in the boundary layer region (Appendix A). The selected contours are highlighted in figure 6 and instantaneous examples of their variation for a
 ${\pm }50\,\%$ change in thresholding value are presented in figure 8. In the latter figure, it can be seen that the instantaneous location of the contour does not significantly change for at least a
 ${\pm }30\,\%$ change in threshold and is still broadly in a similar position for even a
 ${\pm }50\,\%$ change. The changes that are perceptible do not result in the isolation of a new UMZ, and thus do not significantly influence that analysis. Moreover, the variation in the mean position of the identified contour with thresholding level is small compared to the typical thickness of a UMZ, e.g.
 $>0.1\delta$ (Laskari et al. Reference Laskari, de Kat, Hearst and Ganapathisubramani2018). Nonetheless, it is important to note that it is the general trends between cases that we seek to address with this analysis rather than specific quantitative reporting.
Instantaneous velocity maps for all cases with the identified top edge of the upper-most UMZ drawn in red. Additional contours are drawn for a  ${\pm }10\,\%$,
 $20\,\%$,
 $30\,\%$,
 $40\,\%$ and
 $50\,\%$ change in the thresholding value in decreasing shades of grey as a reference for the variation of the contour with thresholding value.

4.2. Detecting UMZs
UMZs layered above the wall were detected using a similar methodology to that described by Adrian et al. (Reference Adrian, Meinhart and Tomkins2000), de Silva et al. (Reference de Silva, Hutchins and Marusic2016) and Laskari et al. (Reference Laskari, de Kat, Hearst and Ganapathisubramani2018). The steps used herein are:
(i) A window with a streamwise length of 2000 viscous units (
 $\mathcal {L}_x^+ = 2000$) in the centre of each vector field is selected; $\mathcal {L}_x^+$ was chosen based on the analysis of de Silva et al. (Reference de Silva, Hutchins and Marusic2016), who suggested that it should scale with viscous units. They further showed that for $Re_{\tau } \lesssim 14\,500$ the average number of UMZs detected, $\langle N_{UMZ}\rangle$, for a canonical TBL was approximately invariant for $200 \lesssim \mathcal {L}_x^+ \lesssim 2500$. The effect of changing $\mathcal {L}_x^+$ in the present study is discussed in the next section.
(ii) A p.d.f. is composed from the streamwise velocity vectors in a given image as depicted on the right-hand side of figure 9.
(iii) Vectors above the most common continuous contour (identified in § 4.1) are excluded from the p.d.f.s; without this step, the turbulent variations in the freestream dwarf the wall-bounded flow for the FST cases (Appendix A).
(iv) Modal velocities of the UMZs,
$U_{UMZ}$, are identified as the peaks in the p.d.f. and thresholds are drawn at the mid-point between two adjacent modal velocities to detect the edges of the UMZs (de Silva et al. Reference de Silva, Hutchins and Marusic2016).


Sample instantaneous snapshots of streamwise velocity with corresponding p.d.f.s for each of the three test cases. The peaks in the p.d.f.s are circled, and the thresholds are drawn equidistant from the adjacent p.d.f. peaks. These thresholds are drawn onto the instantaneous velocity fields to identify the UMZs.

When the thresholds from step (iv) are mapped onto the instantaneous velocity field (figure 9), it can be seen that the modal velocities represent the local velocity in regions of approximately uniform momentum. It is important to note that the UMZs detected using this methodology are only those that form a layered structure above the wall. There is evidence that regions of uniform momentum also exist in homogeneous isotropic turbulence detached from a wall (Elsinga & Marusic Reference Elsinga and Marusic2010), but this is not the focus herein.
5. Impact of freestream turbulence on uniform momentum zones
Earlier works showed that the spectrograms, amplitude modulation and spatial correlations functions of the wall-bounded flows subjected to FST are qualitatively similar to those in canonical TBLs (Dogan et al. Reference Dogan, Hanson and Ganapathisubramani2016, Reference Dogan, Hearst and Ganapathisubramani2017, Reference Dogan, Hearst, Hanson and Ganapathisubramani2019; Hearst et al. Reference Hearst, Dogan and Ganapathisubramani2018). This leads us to wonder if the instantaneous structure near the wall is also comparable between the canonical case and ones with FST. To address this question, we search for UMZs which are markers of the hairpin mechanisms that produce low- and high-momentum pathways in TBLs (Adrian et al. Reference Adrian, Meinhart and Tomkins2000).
Figure 9 is a single example of the flow fields in each case, but it illustrates some of the global trends present in these flows. All the flow field axes are set to represent an area that is  $x^+ = 2000$ by
 $y^+ = 1300$, and the right-hand axis of the flow fields corresponds to outer units. The results reveal that in both viscous and outer units the UMZs are housed closer to the wall with increasing FST; this agrees with figure 6 and is discussed in greater detail in § 6. The closer proximity of the UMZs to the wall in both inner and outer units, despite the slight increase in
 $Re_{\tau }$ with
 $u'_{\infty }/ U_{\infty }$, suggests that this trend is robust to these changes in
 $Re_{\tau }$ and is an effect of the presence of the FST. Perhaps more significantly, UMZs are observed for all three cases despite the fact that they occupy successively less physical space with increasing FST. This emphasises the robustness of the zonal-like arrangement of velocity present in wall-bounded flows, as they exist even in this flow with significant turbulence away from the wall.
As remarked in previous works on the topic, the analysis of UMZs and their detection is dependent on the criteria used to identify them (de Silva et al. Reference de Silva, Hutchins and Marusic2016; Laskari et al. Reference Laskari, de Kat, Hearst and Ganapathisubramani2018). In practice, this means that more emphasis should be placed on the trends identified in the analysis rather than the specific values of its output. A parameter with significant impact on the present analysis is the length of the interrogation window ( $\mathcal {L}_x$). The dependence of
 $\langle N_{UMZ}\rangle$ on
 $\mathcal {L}_x$ is presented in figure 10. While
 $\langle N_{UMZ}\rangle$ is approximately invariant for
 $\mathcal {L}_x^+ > 500$ for the canonical REF case, in agreement with de Silva et al. (Reference de Silva, Hutchins and Marusic2016), there is a strong dependence of
 $\langle N_{UMZ}\rangle$ on
 $\mathcal {L}_x$ for the FST cases. Nonetheless, the trends when comparing the cases to one-another are unaffected by the size of the chosen window, i.e.
 $\langle N_{UMZ}\rangle$ decreases with increasing FST intensity regardless of the chosen
 $\mathcal {L}_x$. The fact that
 $\langle N_{UMZ}\rangle$ continues to decrease with increasing
 $\mathcal {L}_x$ for the FST cases but not for the canonical case suggests that the physical extent of the UMZs is shorter when FST is present.
The influence of window size on the estimation of the number of UMZs in the frame. The vertical dashed line represents the value of  $\mathcal {L}_x^+$ used to estimate the UMZ statistics herein; (
 $-\triangle -$) REF, (
 , red) FST-8, (
 $-\blacksquare -$, blue) FST-13.

While figure 9 provides a picture of the instantaneous structure for the three cases, more meaning can be drawn from the statistics accumulated across all fields acquired in the present experiment. In figure 10, the general trend observed for all detection parameters tested is that  $\langle N_{UMZ}\rangle$ decreases with increasing
 $u'_{\infty }/ U_{\infty }$. Specifically, for the chosen parameters:
 $\langle {N_{UMZ}} \rangle = 3.9$, 2.0 and 1.8, for REF, FST-8 and FST-13, respectively. More information on the detected UMZs is given by the p.d.f.s of
 $N_{UMZ}$ for the three cases, illustrated in figure 11(a). The peak of the p.d.f. moves from 4, to 2 to 1, for increasing
 $u'_{\infty }/ U_{\infty }$. Significantly, there are always more fields with
 $N_{UMZ} \ge 2$ than
 $N_{UMZ} < 2$ for all cases, suggesting that UMZs do exist in these flows. It is also worthwhile to note that there are recorded fields where
 $N_{UMZ} = 0$ instantaneously for FST-8 and FST-13, but not REF.
 $N_{UMZ} = 0$ for the FST cases identifies fields where continuous contours across the field of view could not be detected. This occurs in 0 %, 3.5 % and 11.8 % of the acquired images for REF, FST-8 and FST-13, respectively, again demonstrating that in the majority of realisations UMZs are detected.
The p.d.f.s of the (a) number of UMZs and (b) normalised modal velocities for each case; ( $-\triangle -$) REF, (
 , red) FST-8, (
 $-\blacksquare -$, blue) FST-13.

The p.d.f.s of the modal velocities ( $U_{UMZ}$) for each case are provided in figure 11(b). This figure illustrates the likelihood that a UMZ with a given modal velocity will exist in a given instantaneous field. The first prominent feature of this figure is the maximum for each case that decreases in
 $U_{UMZ} / U_{\infty }$ for increasing
 $u'_{\infty }/ U_{\infty }$. This is an artefact of the thresholds used to identify the upper-most edge of the UMZs, and simply identifies that there is typically a UMZ with the same momentum as the threshold. What is perhaps more interesting in figure 11(b) is that the p.d.f.s are very similar for
 $U_{UMZ} / U_{\infty } < 0.75$. The significance of this is it identifies that the distribution of modal velocities is practically unchanged by the presence of the FST. This in turn tells us that the primary impact of the FST is to reorganise the outer regions of the boundary layer, while leaving the near-wall structure intact. This thus corroborates the results from the spectra (Dogan et al. Reference Dogan, Hanson and Ganapathisubramani2016; Hearst et al. Reference Hearst, Dogan and Ganapathisubramani2018) and amplitude modulation (Dogan et al. Reference Dogan, Hearst and Ganapathisubramani2017) analyses that conclude that qualitatively the near-wall structure of the flows is unaffected (other than the change in
 $U_\tau$).
6. The upper-most UMZ edge
In the previous section it was demonstrated that UMZs exist near the wall for TBLs subjected to FST in much the same way as they do for canonical TBLs. We now turn our attention to what happens where the UMZs stop. In particular, we focus on the top edge of the upper-most UMZ, representing the last continuous contour that exists when moving away from the wall. In principle, this is a similar idea to the TNTI, which separates the UMZs from the freestream for a canonical TBL, however, FST above the TBL means the flow is completely populated by turbulence. Thus, the top edge of the UMZs is likely more similar to an internal shear layer within the TBL (Eisma et al. Reference Eisma, Westerweel, Ooms and Elsinga2015), or the interfaces demarking the quiescent core of a channel (Kwon et al. Reference Kwon, Philip, de Silva, Hutchins and Monty2014; Yang et al. Reference Yang, Hwang and Sung2016; Jie et al. Reference Jie, Xu, Dawson, Andersson and Zhao2019) or central UMZ of a pipe (Chen et al. Reference Chen, Chung and Wan2020; Gul et al. Reference Gul, Elsinga and Westerweel2020) than to a TNTI. An interface separating the wall turbulence over a flat plate from FST above it has previously been detected by Wu et al. (Reference Wu, Wallace and Hickey2019) who referred to it as the ‘boundary layer turbulence and freestream turbulence interface’. While their interface was not framed in the same way, it provides a precedent that a meaningful contour exists that distinguishes wall-bounded turbulent structures from the flow above.
As was qualitatively demonstrated in figures 3(a–c), 4 and 9, the instantaneous velocity deficit and wall-signed vorticity regions, as well as the UMZs themselves, all appear to be contained closer to the wall for the FST cases compared to the canonical case. Figure 12(a) shows the p.d.f.s of the location of the top UMZ edge for the three cases, explicitly illustrating that it statistically moves closer to the wall with increasing FST. Figure 12(a) also identifies some key differences between the three cases. For REF, the p.d.f. is approximately Gaussian, as observed in previous studies for the TNTI of canonical TBLs (Chauhan et al. Reference Chauhan, Philip, de Silva, Hutchins and Marusic2014a; Eisma et al. Reference Eisma, Westerweel, Ooms and Elsinga2015). However, for the two FST cases, the distributions are markedly skewed towards the wall. This links directly to differences in the intermittency,  $\gamma$, profiles provided in figure 12(b). The intermittency profiles are calculated by creating a binary field for each velocity field where 1 is assigned to all vectors in the UMZ region (below the upper-most UMZ edge) and 0 is assigned to all values that are not part of the UMZs. Taking the average of these fields yields the curves provided in figure 12(b), where
 $\gamma = 1$ represents flow that is always occupied by UMZs and
 $\gamma = 0$ represents flow that is never occupied by UMZs. The intermittency profile for REF is approximately an error function in agreement with previous studies, e.g. Chauhan et al. (Reference Chauhan, Philip, de Silva, Hutchins and Marusic2014a). The error function parameterisation does not hold for the FST cases. This means that there are instantaneous flow fields that have no UMZs. Moreover,
 $\gamma >0$ until
 $y/\delta \approx 1.4$ for the FST cases, suggesting that there is significant variability in the position of the top edge of the UMZs for these cases. In particular, if the p.d.f.s in figure 12(a) are integrated from the peak value up, it demonstrates that 86.7 % and 94.6 % of the time the top of the UMZs is above the peak location of the p.d.f. for cases FST-8 and FST-13, respectively. This is in sharp contrast to REF where the peak in the p.d.f. is essentially the centre of the distribution. In all, the p.d.f.s and intermittency profiles in figure 12 demonstrate that the top edge of the UMZs moves closer to the wall with increasing FST and that its positional variability increases with FST.
Wall-normal profiles of the (a) p.d.f. of the location of the upper-most UMZ edge,  $y_i$, and (b) the intermittency,
 $\gamma$, profile for each case; (
 $-\triangle -$) REF, (
 , red) FST-8, (
 $-\blacksquare -$, blue) FST-13.

If the top edge of the upper-most UMZ is truly a contour of significance, then one would expect to see jump flow characteristics across it (Wu et al. Reference Wu, Wallace and Hickey2019). This is assessed through conditional averages taken about the aforementioned contour. In general, we focus on the differences and similarities for cases FST-8 and FST-13. The REF results are omitted from this section because the  $Re_\tau$ is much lower. For detailed investigations on canonical TBLs and the effect of
 $Re_\tau$ in those flows, see Chauhan et al. (Reference Chauhan, Philip, de Silva, Hutchins and Marusic2014a,Reference Chauhan, Philip and Marusicb) and de Silva et al. (Reference de Silva, Philip, Hutchins and Marusic2017). The conditional averages are calculated by conditioning the wall-normal position,
 $y$ on the position of the upper-most UMZ edge,
 $y_i$, i.e.
 $y-y_i = 0$ is the position of the UMZ edge. Each vertical profile from each image for a specific case is then averaged in this way. In figure 13(a), mean velocity jumps across the top UMZ edge are illustrated for the FST cases, similar to observations for canonical TBLs made by Chauhan et al. (Reference Chauhan, Philip and Marusic2014b). The change in slope of the profile of
 $\langle {\tilde {U}} \rangle _i$ above and below the contour is greater for FST-13 compared to FST-8, suggesting that the severity of the discontinuity is a function of the FST intensity and is higher than the canonical case. In order to quantify this, linear fits were made to the various sections of the curve in figure 13(a) to illustrate the change to the velocity jump across the upper edge of the top UMZ,
 $D[U_\tau ]$. Chauhan et al. (Reference Chauhan, Philip and Marusic2014b) found that for sufficient
 $Re_\tau$ the velocity jump,
 $D[U_\tau ]$, was approximately invariant for canonical TBLs. We measure
 $D[U_\tau ] \approx$ 1.87 and 1.94 for cases FST-8 and FST-13, respectively. This confirms that increasing the FST has the function of increasing the velocity jump across the top edge of the upper-most UMZ. This idea is also consistent with the notion that increasing the FST makes the boundary layer ‘fuller’. Wu et al. (Reference Wu, Wallace and Hickey2019) composed conditional averages across their interface but their conditional averages were performed in the interface-normal direction rather than the wall-normal direction. Nonetheless, their results also show a velocity jump, albeit less severe than presented here. Their FST was closer to 3 % and thus their results support the hypothesis that the velocity jump scales with the FST intensity when combined with the present findings.
Conditional averages across the instantaneous location of the top edge of the upper-most UMZ: (a) mean streamwise velocity and (b) mean wall-normal velocity; ( , red) FST-8, (
 $-\blacksquare -$, blue) FST-13.

The conditional wall-normal velocity profile is similar to that observed for the canonical cases (Chauhan et al. Reference Chauhan, Philip, de Silva, Hutchins and Marusic2014a) in that below the interface the flow direction is away from the wall, while above the interface fluid is entrained down, consistent with the idea that flow is entrained down into the turbulent wall region. The difference between the cases presented here is that the incoming and exiting profiles are more uniform for FST-13 relative to FST-8, again suggesting that a stronger discontinuity is present for the increased level of FST.
Further insight into the mechanics at the edge of the UMZs can be obtained from the conditionally averaged swirling strength signed by vorticity, which is provided in figure 14(a). Below the top UMZ upper edge the swirl is negative, while it approaches zero above the highest UMZ. The results for the two different turbulence levels are similar, and the conditional statistics corroborate the qualitative observation made with respect to figure 4 that above the UMZs there is an approximately equal distribution of positive and negative vortices while below there is a bias towards the wall-signed vorticity. This adds further weight to the idea that the identified threshold represents a physically meaningful interface that demarcates the two flow regions because statistically these isolines behave in a similar way to one identified directly with vorticity. Note that a fundamentally similar results was presented by Wu et al. (Reference Wu, Wallace and Hickey2019) for their slightly different conditional averaging process.
Conditional averages across the instantaneous location of the top edge of the upper-most UMZ: (a) signed swirling strength and (b) Reynolds shear stress; ( , red) FST-8, (
 $-\blacksquare -$, blue) FST-13.

The conditionally averaged Reynolds shear stress is shown in figure 14(b) where a peak is visible at the upper-most UMZ edge contour. The fluctuating velocities are estimated in the usual sense where they are the difference between the mean field and the instantaneous field. Of note is that the  $u'v'$ profile through the contour more closely resembles the internal layers detected by Eisma et al. (Reference Eisma, Westerweel, Ooms and Elsinga2015) than the TNTI profile of Chauhan et al. (Reference Chauhan, Philip, de Silva, Hutchins and Marusic2014a). Moreover, Wu et al. (Reference Wu, Wallace and Hickey2019) also found that their interface was a local peak in the Reynolds shear stress. This result is consistent with the idea that there is turbulence and mean shear on both sides of the contour, which results in production.
The general picture painted by the UMZ analysis and observations made on the edge of the upper-most UMZ is that the primary impact of the FST is on the outer regions of the boundary layer. Specifically, with increasing FST, the top of the highest UMZ is pushed towards the wall and there is less area for the boundary layer structure or UMZs to manifest. Increasing  $u'_{\infty }/ U_{\infty }$ results in an increase in
 $Re_{\tau }$, primarily via a change in
 $\delta$ as the changes to
 $U_\tau$ between cases are around 5 % while
 $\delta$ changes by a factor of three (table 1). In a canonical TBL an increase in
 $Re_{\tau }$ is correlated to an increase in
 $\langle N_{UMZ}\rangle$ (de Silva et al. Reference de Silva, Hutchins and Marusic2016), however, the present analysis demonstrates that increasing
 $u'_{\infty }/ U_{\infty }$ also brings the top of the highest UMZ closer to the wall, and that
 $\langle N_{UMZ}\rangle$ decreases. Thus, one can conclude that the impact of the FST on the outer regions of the boundary layer is more significant for the instantaneous structure of the boundary layer than the increase in
 $Re_{\tau }$. This may initially seem at odds with the idea that the presence of FST causes
 $\delta$ to grow, however, it is important to note that Chauhan et al. (Reference Chauhan, Philip, de Silva, Hutchins and Marusic2014a) also found that the TNTI (for canonical TBLs) lay below
 $\delta$ at approximately
 $\frac {2}{3} \delta$. As such, the present results could be interpreted as FST causing an increase to the size of the intermittent region between the edge of the boundary layer,
 $\delta$, and the interface bounding the UMZs. This is explicitly demonstrated in figure 12(b). Regardless, UMZs exist for FST levels up to
 $u'_{\infty }/ U_{\infty } = 12.8\,\%$, which, in combination with earlier spectral (Dogan et al. Reference Dogan, Hanson and Ganapathisubramani2016; Hearst et al. Reference Hearst, Dogan and Ganapathisubramani2018), amplitude modulation (Dogan et al. Reference Dogan, Hearst and Ganapathisubramani2017) and spatial correlation (Dogan et al. Reference Dogan, Hearst, Hanson and Ganapathisubramani2019) results, suggests that the primary impact of changing
 $u'_{\infty }/ U_{\infty }$ is to change the outer regions of the boundary layer while approximately preserving the near-wall region flow features.
7. A simplified model of a boundary layer with freestream turbulence
The interaction between FST and a TBL is extremely complex, and measurements at any specific downstream location are in fact a result of the integrated influence of the two flows on one another over the entire development length up to the measurement point (Kozul et al. Reference Kozul, Hearst, Monty, Ganapathisubramani and Chung2020; Jooss et al. Reference Jooss, Li, Bracchi and Hearst2021). Based on our observations so far, it is evident that a TBL with FST appears to show characteristics of the superposition of two turbulent flows. Specifically, we observe a region close to the wall that exhibits purely TBL characteristics, while above the UMZs we observe an altered structure resulting from the presence of FST. Even farther away from the wall, the flow behaves purely as FST. In order to test this hypothesis, we aim to utilise a simple model where we superimpose an isotropic turbulence field over a TBL to see if the preceding trends are reproducible.
7.1. Model formulation
This idea was realised by superimposing instantaneous fields from a scaled periodic turbulent box (Cao, Chen & Doolen Reference Cao, Chen and Doolen1999) – accessed through the John Hopkins Turbulence Database – on the turbulent boundary layer DNS of Sillero, Jiménez & Moser (Reference Sillero, Jiménez and Moser2013, Reference Sillero, Jiménez and Moser2014) at  $Re_{\tau } = 2000$. Functionally, this was accomplished by interpolating the isotropic DNS fields to an equivalent grid as the TBL DNS and then scaling the velocity magnitudes based on the turbulence intensity of the empirical FST for each case. Blending was performed in two ways: (i) by simply superimposing the two fields, and (ii) by using the empirical intermittency profiles (figure 12b) as a relative weighting between the two flows. The subsequent figures are shown using approach (ii), however, the results did not substantially differ between the two approaches. The synthetic field generation process is illustrated in figure 15 for approach (ii) and the output image is qualitatively similar to those for cases FST-8 and FST-13 in figure 3. Particularly, the freestream is composed of packets of velocity that are both
 $\tilde {U} < U_\infty$ and
 $\tilde {U} > U_\infty$, and there is a velocity deficit region near the wall. One hundred synthetic images were generated to mirror each of the experimental datasets (REF, FST-8, FST-13), and the modelled flows are referred to as mREF, mFST-8 and mFST-13, respectively. The 100 fields for each case are composed of the same baseline TBL fields, and differ only in that isotropic fields with varying magnitudes are superimposed on to them. To this end, the approach isolates the effects of FST in that mFST-8 and mFST-13 differ only in the magnitude of the superimposed turbulent field, but not in their instantaneous boundary layer or freestream structure; as such, the impact of the magnitude of the FST on the instantaneous TBL structure can be assessed for the exact same fields (figure 16). In the particular instantaneous fields of figure 16 it is evident that the top of the upper-most UMZ moves towards the wall and
 $N_{UMZ}$ decreases with increasing
 $u'_{\infty }/ U_{\infty }$, akin to the experimental results.
Schematic of the superposition model using the weighted blending: an isotropic turbulence field, weighted by the empirical intermittency function, is added to a TBL field to generate the synthetic TBL field with FST. Note that the same process was also performed without the intermittency profile to ensure the results were not an artefact of the specific intermittency profile.

Instantaneous velocity fields and streamwise velocity p.d.f.s composed using the superposition model. Each case is made up of the same instantaneous TBL field with differing levels of turbulence superimposed from the same isotropic turbulence field.

7.2. Model output
The synthetic fields are investigated in the same way as the experimental data. First, values for the UMZ bounding interface threshold,  $k_{th}/k_\infty$, of the mFST cases are found using the same approach as for the experiments (described in § 4.1). For mREF, a different approach is used because
 $k_\infty \approx 0$ in the DNS, unlike in the experimental PIV data where the background noise is higher. For mREF,
 $k_{th}/k_\infty$ is chosen such that it represents the kinetic energy deficit when
 $V = 0$ and
 $U/U_{\infty } = 0.97$; the latter is the velocity that corresponds to the
 $k_{th}/k_\infty$ chosen for the REF experimental case. The p.d.f.s of the wall-normal location of the contours resulting from these thresholds are shown in figure 17(a), where it can be seen that the upper-most UMZ edge approaches the wall with increasing FST, also matching the trend observed with PIV. This trend is also present when the same threshold level is used for both mFST-8 and mFST-13, signifying that it is not simply a result of using a different threshold between cases but rather is a consequence of the change in
 $u'_{\infty }/ U_{\infty }$. Moreover, the same analysis was performed using blending approach (i) as well, i.e. by directly blending the two fields without the empirical intermittency profile, and the wall-ward trend of the edge of the UMZs was still present. This identifies that this trend is not a consequence of our choice of blending function. It thus appears that as the magnitude of the FST is increased, the upper-most continuous interface approaches the wall in both the PIV measurements and the synthetic analogue.
Statistical output of the DNS superposition model. (a) The p.d.f. of the instantaneous location of the top edge of the upper-most UMZ with log-scaled  $y$-axis inset. (b) Average number of detected UMZs as a function of the interrogation window length; the
 $y$-axis range is deliberately chosen to mirror that in figure 10; (
 $-\triangle -$) mREF, (
 , red) mFST-8, (
 $-\blacksquare -$, blue) mFST-13.

Modal velocities and UMZs are depicted in figure 16 using the same approach as described in § 4.2. Vectors below  $y^+ = 100$ were omitted from the model UMZ analysis in order to make it comparable to the vast majority of PIV experiments, which have insufficient resolution to identify UMZs below this height. The average number of UMZs (
 $\langle N_{UMZ}\rangle$) found for each case is presented in figure 17(b) for
 $\mathcal {L}_x^+ \le 2000$, which is the maximum extent available from the employed public databases. Here, we have set
 $U_\tau$ to be the same for all three cases and equal to the mREF value. While this assumption is demonstrably false, the change for the same experimental cases is of the order of 5 % (table 1) and the assumption does not impact the global trends. Moreover, other fitting approaches that could be used to attempt to extract
 $U_\tau$ from mFST-8 and mFST-13 would have uncertainties of the same order (Esteban et al. Reference Esteban, Dogan, Rodríguez-López and Ganapathisubramani2017). Generally, figures 16 and 17(b) show the same trend as observed in figure 10 with PIV:
 $\langle N_{UMZ}\rangle$ decreases with increasing FST.
While the model has captured the trends in the number of UMZs and the height they reach, it does not quantitatively match the experimental results. For instance, the peak in the p.d.f. of the upper-most UMZ edge location is much farther from the wall for mFST-8 and mFST-13 compared to their experimental counterparts, shifting upward by  $0.29\delta$ and
 $0.21\delta$, respectively. This is a result of the model failing to capture the mechanism by which the FST changes
 $\delta$ via momentum transport (Dogan et al. Reference Dogan, Hanson and Ganapathisubramani2016) and rather imposes a qualitatively similar structure via superposition. Furthermore, while
 $\langle N_{UMZ}\rangle$ predicted by the model is quite similar for the turbulent freestream cases, it is lower for mREF compared to REF.
This simplistic model is not meant to supersede any actual DNS of a flow of the nature studied here, e.g. You & Zaki (Reference You and Zaki2019), Wu et al. (Reference Wu, Wallace and Hickey2019) and Kozul et al. (Reference Kozul, Hearst, Monty, Ganapathisubramani and Chung2020). Instead, it is meant as a tool to investigate if instantaneous phenomena can be replicated by linear superposition of two flows, which in turn provides insight into the driving mechanisms of the flow. This simple model is able to replicate two key phenomena observed in the PIV measurements. First, the wall-normal position of the top of the highest UMZ approaches the wall with increasing FST. In the model, it was shown that this is not influenced by the intermittency profile of the superimposed turbulence or the chosen threshold, but rather is a result of the increase in the magnitude of the freestream fluctuations. Second,  $\langle N_{UMZ}\rangle$ decreases with increasing
 $u'_{\infty }/ U_{\infty }$. The significance of this point is twofold: (i) it corroborates the experimentally measured results, and (ii) it suggests that there is an underlying structure to the TBL that is simply masked by the FST. When the fluctuations in the FST are of comparable magnitude to the fluctuations in the TBL at a specific wall-normal location, they dominate and destroy (or hide) the underlying UMZs. When the fluctuations of the TBL are higher, the UMZ structure persists.
8. Conclusions
The instantaneous structure of a TBL subjected to FST was investigated with planar PIV. Three different cases with increasing  $u'_{\infty }/ U_{\infty }$ were measured at the same downstream location. UMZs were detected for all cases. The average number of continuous UMZs layered above the wall was found to decrease with increasing
 $u'_{\infty }/ U_{\infty }$. This trend was shown to be robust to the detection criteria used to identify the UMZs. The results also suggest that increasing
 $u'_{\infty }/ U_{\infty }$ has a stronger impact on the number of UMZs than
 $Re_{\tau }$ because the cases investigated here increase from
 $Re_{\tau } = 1100$ to 4700, which should result in an increase in
 $\langle N_{UMZ}\rangle$ (de Silva et al. Reference de Silva, Hutchins and Marusic2016), but instead a decrease is observed because the turbulence intensity increases from
 $u'_{\infty }/ U_{\infty } \approx 0$ to 12.8 % for the same cases. Our results also revealed that the distribution of modal velocities associated with the UMZs closest to the wall was comparable for all cases, indicating the near-wall flow structure remains largely intact despite the presence of FST.
Given that UMZs were detected, we found it interesting to track the behaviour of the top edge of the upper-most UMZ. In a canonical TBL, this contour is synonymous with the TNTI and generally separates rotational wall-bounded fluid from irrotational freestream fluid. However, when FST is present, the top of the upper-most UMZ separates fluid with vorticity signed by the wall from where the flow has an approximately even distribution of vortices with both signs. This was confirmed via conditional averaging across the top edge of the highest UMZ. Furthermore, our results revealed that as  $u'_{\infty }/ U_{\infty }$ was increased, the top UMZ edge moved closer to the wall.
A superposition model – whereby scaled isotropic turbulence fields were combined with DNS of a TBL – was able to replicate key phenomena observed in the experiments. In particular, the model showed that the average position of the upper most UMZ moved towards the wall and that  $\langle N_{UMZ}\rangle$ decreased with increasing
 $u'_{\infty }/ U_{\infty }$. Given that these results can be replicated with a simple superposition of turbulent fields, it suggests that the driving mechanism in the flow might be the magnitude of the turbulence intensity rather than other factors – for instance, the change in
 $U_\tau$, which cannot be captured with this simple model.
In closing, we summarise the picture that the present results paint of the instantaneous structure of a TBL subjected to FST: as  $u'_{\infty }/ U_{\infty }$ is increased, the top of the upper-most UMZ moves closer to the wall and the number of UMZs decreases. When taken in light of previous results showing qualitative similarities between canonical TBLs and these flows with respect to the spectrograms (Dogan et al. Reference Dogan, Hanson and Ganapathisubramani2016; Hearst et al. Reference Hearst, Dogan and Ganapathisubramani2018), amplitude modulation (Dogan et al. Reference Dogan, Hearst and Ganapathisubramani2017) and spatial correlations (Dogan et al. Reference Dogan, Hearst, Hanson and Ganapathisubramani2019), it suggests that the near-wall structure and mechanisms are robust to the presence of the FST, but that the boundary conditions (for the same
 $Re_{\tau }$) have changed.
Acknowledgements
The authors are grateful to Dr G. Gomit who acquired the benchmarking dataset, Professor R.E. Hanson for his support during the FST measurement campaign, Dr R. Bleischwitz for invaluable aid designing and building the active grid and Dr A. Laskari for insightful discussions on interfaces. The supporting data for this work are openly available from the University of Southampton repository at https://doi.org/10.5258/SOTON/D1729.
Funding
The authors acknowledge the financial support of the European Research Council (ERC Grant agreement No. 277472), and the Engineering and Physical Sciences Research Council of the United Kingdom (EPSRC Grant Ref. No. EP/I037717/1). R.J.H. acknowledges the financial support of the Natural Sciences and Engineering Research Council of Canada (NSERC) while at the University of Southampton, and this on-going work is support by the Research Council of Norway (RCN Project No.s: 280578 and 288046). E.D. acknowledges the financial support of Zonta International while at the University of Southampton.
Declaration of interests
The authors report no conflict of interest.
Appendix A. Influence of kinetic energy deficit threshold
The necessity of thresholding the velocity field to identify UMZs using the histogram approach is illustrated in figure 18. A representative velocity field from FST-8 is shown in figure 18(a) with thresholding lines drawn at the identified kinetic energy deficit location as well as arbitrarily at fixed wall-normal positions  $y/\delta = 0.6$, 1.0 and 1.4. These positions are chosen to be equally spaced and are arbitrary because, as is evident in the figure, continuous contours across the domain at unique kinetic energy deficit (or velocity) threshold values do not exist significantly above the identified threshold. The corresponding histograms, calculated from all vectors below the drawn contours, are provided in figure 18(b). In all, figure 18 illustrates that without the thresholding, the histogram is dominated by vectors associated with the freestream that dwarf the distribution of velocities near the wall. Moreover, the histogram of low velocities is also affected by thresholding because some of these low velocity vectors exist in the freestream. Thus, as suggested by de Silva et al. (Reference de Silva, Hutchins and Marusic2016), vectors that are not associated with UMZs in the boundary layer must be removed to accurately identify the modal velocities near the wall.
The effect of thresholding illustrated through the (a) instantaneous velocity and (b) histograms of a representative field from FST-8. The solid lines in (a) represent the position under which the histograms of corresponding colour in (b) are computed. The inset in (b) magnifies the area highlighted by the dashed line.

Turning to the influence of the specific thresholding value on the calculation of the number of UMZs, figure 19(a) shows the effect of thresholding value on  $\langle N_{UMZ}\rangle$ for windows of different lengths,
 $\mathcal {L}_x^+$. In particular, for each case lines are plotted for
 $k_{th}/k_\infty = 0.5$, 0.9, 1.0, 1.6 and 4.0. The thickest lines identify the chosen thresholds and are in fact the same data provided in figure 10. For the present analysis we observe that the trends with
 $\mathcal {L}_x^+$ do not change with threshold value identifying that the specific choice of threshold does not change the global trends when comparing different freestream conditions. Furthermore, the selected thresholds typically result in the highest number of UMZs detected on average. The latter result is perhaps not surprising given the thresholds were selected for the very reason that continuous contours with those values occur the most frequently in the captured fields. This is illustrated in figure 7 and in the background of figure 19(b).
Dependence of the average number of detected UMZs on (a) interrogation window length for multiple thresholds and (b) threshold value for a fixed interrogation window length of 2000 viscous units. For both figures, ( $-\triangle -$, black) REF, (
 , red) FST-8, (
 $-\blacksquare -$, blue) FST-13. In (a), the lines from lightest to darkest represent thresholds of
 $k_{th}/k_\infty = 0.5$, 0.9, 1.0, 1.6 and 4.0 for each flow case. The case that was selected for this study is the thicker line. In (b), the dark lines represent the average number of UMZs,
 $\langle N_{UMZ} \rangle$, (left-hand axis), and the light lines represent the percentage of images in which a given contour continuously exists across the image (right-hand axis). The dashed lines show the selected thresholds, which are represented by a green circle on the
 $\langle N_{UMZ} \rangle$ curves and by a symbol on the percentage occurrence curves.

Focussing on figure 19(b), the foreground shows how  $\langle N_{UMZ}\rangle$ changes with
 $k_{th}/k_\infty$ when the window length is fixed at
 $\mathcal {L}_x^+ = 2000$, which is used for the main analysis in this work. The selected thresholds are highlighted and always occur within a plateau region where
 $\langle N_{UMZ}\rangle$ changes with
 $k_{th}/k_\infty$ by no more than 1 %. The percentage of fields in which a given threshold exists is provided in the background for reference and to illustrate how the selected thresholds correspond to the peaks in the former quantity; these are the same data as plotted in figure 7 but here are on linear axes as opposed to semilog axes. Figure 19(b) also demonstrates that for
 $k_{th}/k_\infty > 1$ the trend that REF always produces the most UMZs, followed by FST-8 and then FST-13 is preserved, regardless of threshold choice. In figure 19(b) calculations for
 $k_{th}/k_\infty < 1$ are plotted, but this is for reference only. Thresholds in this range do not unambiguously exclude vectors from the freestream, and their inclusion in the histogram contaminates the detection of modal velocities.
In all, the specific value of the thresholds for the limiting contour do impact the specific values found by the analysis, but not the global trends. Moreover, the specific thresholds chosen herein are in a region where the analysis is particularly insensitive to minor changes in the threshold and that represent events that occur most frequently in the presented test cases.
Appendix B. Other interface detection methods
There is merit on providing a short note on other interface identifications techniques. An enstrophy approach, which would likely be ideal, is made moot in the present analysis because there is enstrophy in both the freestream and the boundary layer. Moreover, in experiments we are typically limited to two-dimensional data. Limiting ourselves to two dimensions, vorticity approaches fail in these flows where there is significant FST because of both resolution limitations and because there are significant islands and pockets in the vorticity field on both sides of the interface, as illustrated qualitatively in figure 4 and explicitly compared in figure 10 of Wu et al. (Reference Wu, Wallace and Hickey2019) which was a DNS study without the experimental resolution limitations. The techniques tailored for two-dimensional PIV developed by Reuther & Kähler (Reference Reuther and Kähler2018) whereby they search for when the flow becomes instantaneously homogeneous are not applicable here because the freestream flow is only homogeneous statistically (not instantaneously). Their technique where only the boundary layer is seeded also would not work in the present flow because simultaneous information is needed in the freestream and the boundary layer. Finally, using a histogram approach to identify the freestream, akin to the quiescent core of channel flow (Kwon et al. Reference Kwon, Philip, de Silva, Hutchins and Monty2014; Yang et al. Reference Yang, Hwang and Sung2016; Jie et al. Reference Jie, Xu, Dawson, Andersson and Zhao2019) does not work here again because of the significant FST levels. In a channel or pipe the core is approximately 4 %–5 % turbulent, whereas in the present study the FST intensity is nearly 13 %. Thus, the p.d.f. of freestream velocities dwarfs the boundary layer fluctuations unless those vectors are identified and removed with another technique first. Finally, the approach used herein is very similar to the established technique used in numerous previous studies (Chauhan et al. Reference Chauhan, Philip, de Silva, Hutchins and Marusic2014a,Reference Chauhan, Philip and Marusicb; Philip et al. Reference Philip, Meneveau, de Silva and Marusic2014; de Silva et al. Reference de Silva, Hutchins and Marusic2016, Reference de Silva, Philip, Hutchins and Marusic2017; Laskari et al. Reference Laskari, de Kat, Hearst and Ganapathisubramani2018), and the validity of the identified contours has been confirmed a posteriori with conditional averages across them identifying parameter jumps as suggested by Wu et al. (Reference Wu, Wallace and Hickey2019).


 Open access

