




1. Introduction
The evolution of massive stars in their late phases remains ill understood - in particular, the effects of mass loss on the final fate of these stars (Smith Reference Smith2014; Meynet et al. Reference Meynet2015). A number of factors have been invoked to explain mass loss from massive stars like stellar winds, rotation, radial pulsations, episodic ejections/eruptions and binarity (Woosley et al. Reference Woosley2002; Langer Reference Langer2012), which result in the observed diversity of CCSNe, which are broadly classified as Type I (b/c) – which do not show any hydrogen lines in their spectra – and Type II (P/L/n/b) which do so, but with varying strengths and time evolution of light curves (Filippenko Reference Filippenko1997). There is a growing consensus that a high fraction of Type II SNe are preceded by phases of heavy mass loss (Hinds et al. Reference Hinds2025), with visible signatures in their post-explosion shock interaction with the circumstellar medium (CSM) created by the wind of the SN progenitor (Dwarkadas Reference Dwarkadas2025; Chandra Reference Chandra2025). The circumstellar densities infered from flash-ionization spectroscopy, X-ray and radio observations of SNe like SN 1998S (Chugai et al. Reference Chugai2002) and SN 2023ixf (Chugai et al. Reference Chugai2023) point toward mass loss rates of
 $\sim 10^{-3}-10^{-1}$
M
 $_{\odot}$
 $\rm{yr}^{-1}$
– far exceeding those associated with steady winds of red supergiants (RSGs) and at odds with latest mass loss prescriptions inferred from large samples of observed RSGs (Beasor et al. Reference Beasor2020; Yang et al. Reference Yang2023; Antoniadis et al. Reference Antoniadis2024; Decin et al. Reference Decin2024) as well as empirical mass loss rates derived from much smaller samples of stars (de Jager et al. Reference de Jager1988; Nieuwenhuijzen and de Jager Reference Nieuwenhuijzen and de Jager1990) that are commonly used in stellar evolution codes (Massey et al. Reference Massey2023).
2. Pulsation-driven mass loss from RSGs
Many RSGs exhibit large-amplitude radial pulsations with periods of several hundred days (Soraisam et al. Reference Soraisam2018; Ren et al. Reference Ren2019), driven by the so-called
 $\kappa$
-mechanism (Baker and Kippenhahn Reference Baker and Kippenhahn1965; Gastine and Dintrans Reference Gastine and Dintrans2008) - an interplay between excess radiation pressure and gravitational pull on the outer layers of the RSG envelope. These pulsations can grow in amplitude to produce shocks at the stellar surface that may levitate material above the photosphere, reducing the effective gravity and allowing other processes e.g., radiation pressure on dust and molecules (van Loon Reference van Loon2025) to accelerate the material outward. However, the exact mechanism of mass loss due to the complex interplay of pulsations and convection in RSG envelopes remains ill-understood (Gastine and Dintrans Reference Gastine and Dintrans2010; Goldberg et al. Reference Goldberg2022; Goldberg et al. Reference Goldberg2025; Ma et al. Reference Ma2025).
2.1. Pulsation-driven super-winds (PDSW)
Yoon and Cantiello (Reference Yoon and Cantiello2010) first proposed a pulsation-driven wind mass loss prescription for high mass RSGs with high luminosity-to-mass ratios, which they hypothesized could, in principle, achieve the high rates (
 $\dot M \sim 10^{-2}$
M
 $_{\odot}$
 $\rm{yr}^{-1}$
) required to explain observed properties of CSM around Type IIn SNe (Morozova et al. Reference Morozova2018). Yoon and Cantiello (Reference Yoon and Cantiello2010) showed that the growth rate (
 $\eta$
) of the amplitude of the surface velocities increases with
 $L/M$
ratio and/or decreasing thermal (Kelvin-Helmholtz) time-scale of the envelope (
 $\tau_{KH, env}$
). Using the open-source MESA (Jermyn et al. Reference Jermyn2023) code, we evolve stellar model sequences with initial masses between
 $12 - 18$
M
 $_{\odot}$
using the PDSW prescription of Yoon and Cantiello (Reference Yoon and Cantiello2010) beyond core helium burning for
 $\eta\gt1, ~ T_{\mathrm{eff}}\lt 4000~\mathrm{K}$
, given by:
 \begin{equation} \mathrm{\dot M} = \eta^{\alpha}\mathrm{\dot M}_{\mathrm{Dutch}},\end{equation}
where
 $\alpha$
is a free parameter and
 $\mathrm{\dot M}_{\mathrm{Dutch}}$
is the Dutch wind scheme of MESA scaled with a factor of
 $0.2$
, for the empirical mass loss rate estimates to be consistent with latest observations of RSGs (Beasor et al. Reference Beasor, Davies and Smith2021; Massey et al. Reference Massey2023).
2.2. Shock-driven dynamical ejections
Clayton (Reference Clayton2018) further extended the pulsation-driven mass loss into the shock-dominated regime with hydrodynamic MESA models showing launch of ejections upon the surface breakout of strong compression shocks, followed by sufficiently fast expansion that raises material on to an escape trajectory. Clayton (Reference Clayton2018) proposed the following mass loss prescription for
 $\log((\mathrm{L}/\mathrm{L}_\odot)/(\mathrm{M}/\mathrm{M}_\odot))\gtrsim4.1-4.15$
:
 \begin{equation} \log(\dot{M}/\mathrm{M_\odot}~\rm{yr}^{-1}) = 5.93\times \log[(L/\mathrm{L}_\odot)/(M/\mathrm{M}_\odot)]-26.6,\end{equation}
which we employ to model the possibility of such repeating mass ejections in pulsationally unstable RSG envelopes when the luminosity to mass ratio of the star exceeds the cut-off value of
 $\log((L/\mathrm{L}_\odot)/(M/\mathrm{M}_\odot))=4.15$
.
3. Comparison with multiepoch observations of Type II SNe
We calculate the CSM density and column density of neutral hydrogen along the line of sight assuming spherical symmetric mass loss and an accelerated wind profile from the RSG, given by a simple
 $\beta$
-law (Moriya et al. Reference Moriya2018), with
 $\beta=1.2$
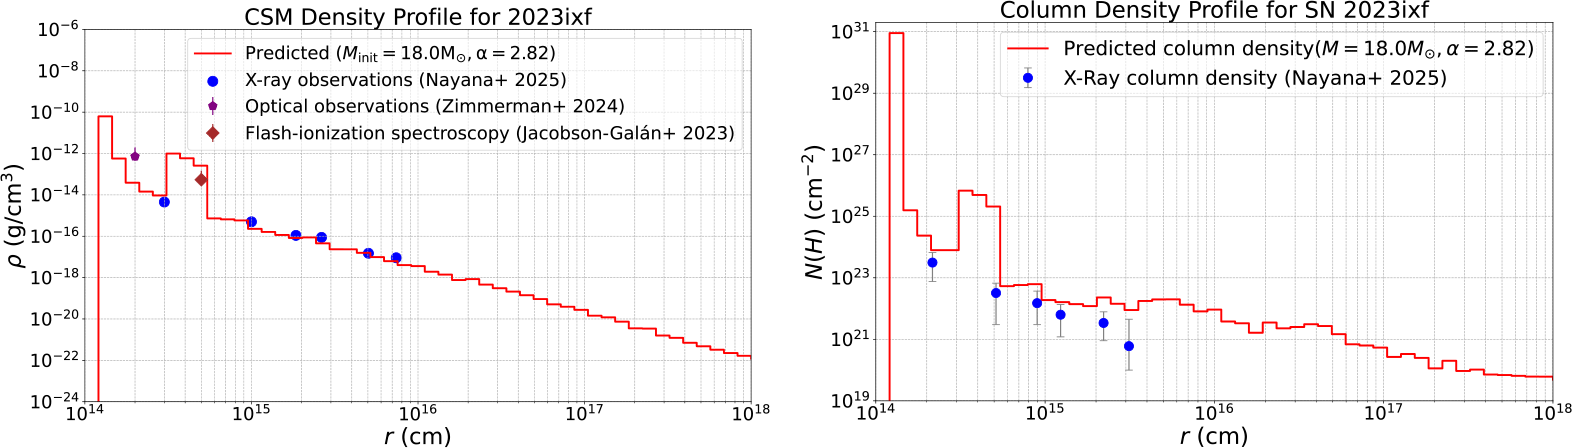
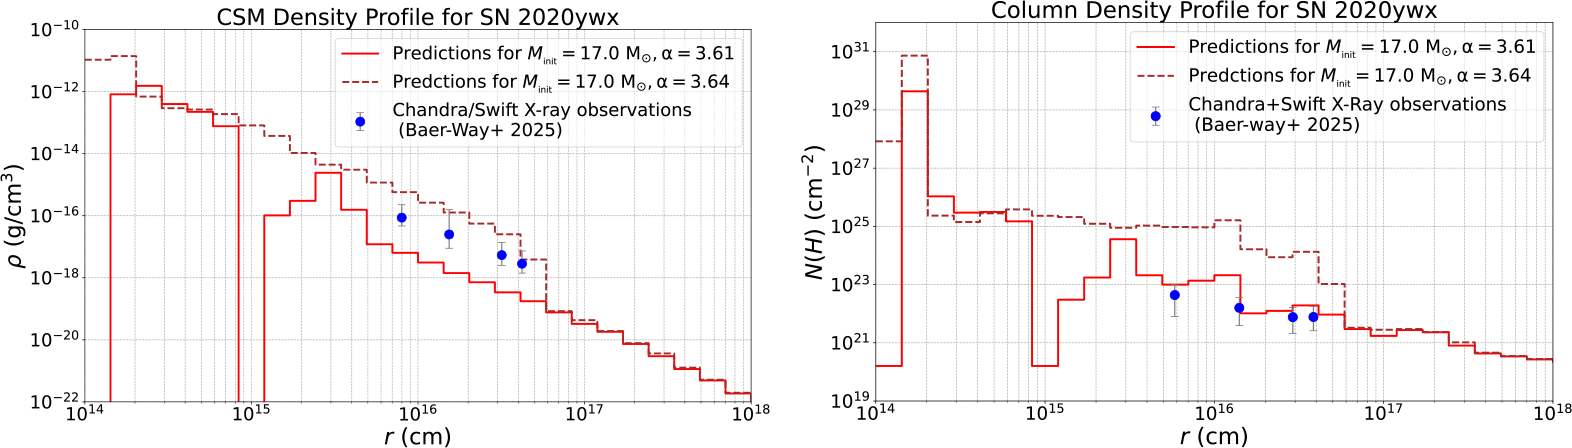
– consistent with observations of single RSGs (Bennett Reference Bennett2010). Our model results are in good agreement with observations of Type II SNe like 1998S, 2005ip, 2017hcc (Sengupta et al. Reference Sengupta2025) as well as multi-epoch observations of more recent events like SNe 2023ixf (see Figure 1) and SN 2020ywx (see Figure 2), although some systematic differences are seen in the column densities which could arise due to explosion asymmetry (Kozyreva et al. Reference Kozyreva2025) or clumping along line of sight effects (Baer-Way et al. Reference Baer-Way2025).
(left) CSM density profiles for the model sequence with
 $M_{init}=18~\rm{M}_\odot,~\alpha=2.82$
(solid red curve), compared with inferred densities from multi-wavelength observations (Jacobson-Galán et al. Reference Jacobson-Galán2023; Zimmerman et al. Reference Zimmerman2024; A. J. et al. 2025) and (right) the column density of neutral hydrogen (solid red) compared to X-ray measurements (in solid blue) for SN 2023ixf (A. J. et al. 2025).

Figure 1 Long description
Panel A: A line graph titled 'CSM Density Profile for 2023ixf' shows the density of the circumstellar medium (CSM) as a function of distance from the star. The x-axis represents the distance (r) in centimeters, ranging from 10^14 to 10^18 cm. The y-axis represents the density (ρ) in grams per cubic centimeter, ranging from 10^-24 to 10^-6 g/cm³. The red solid line represents the predicted density profile for a model with initial mass 18 solar masses and alpha parameter 2.82. Blue circles represent X-ray observations, purple diamonds represent optical observations, and red diamonds represent flash-ionization spectroscopy data. Panel B: A line graph titled 'Column Density Profile for SN 2023ixf' shows the column density of neutral hydrogen as a function of distance from the star. The x-axis represents the distance (r) in centimeters, ranging from 10^14 to 10^18 cm. The y-axis represents the column density (N(H)) in cm^-2, ranging from 10^19 to 10^31 cm^-2. The red solid line represents the predicted column density for the same model. Blue circles represent X-ray measurements.
(left) CSM density profiles for the two MESA model sequences for
 $M_{init}=17~\rm{M}_\odot$
, with
 $\alpha=3.61$
sequence given by the solid red curve and the
 $\alpha=3.64$
sequence given by the dashed brown curve, compared with estimates from measured X-ray luminosities and (right) the column density of neutral hydrogen calculated for the same model sequences, compared to the measured X-ray column densities (blue points) from observations (Baer-Way et al. Reference Baer-Way2025).

 Minit=18 M⊙, α=2.82
 Minit=17 M⊙
 α=3.61
 α=3.64


