1. Introduction
Continuous decline in mortality in the developed world necessitates forecasts of future mortality. In demography, mortality forecasts are crucial to various applications such as population and dependency ratio projections [Reference Lee13,Reference Lee and Tuljapurkar20,Reference Li, Reuser, Kraus and Alho29]. Mortality forecasts are also important to policymakers when evaluating social security and public pension systems [Reference Lee and Tuljapurkar19,Reference Miller34,Reference Parr, Li and Tickle35], and to the life insurance industry when setting premiums and developing risk management strategies [Reference Li and Hardy24,Reference Li, Zhou and Hardy32,Reference Zhou, Wang, Kaufhold, Li and Tan48].
Among all extrapolative approaches for forecasting mortality, the Lee–Carter (LC) model [Reference Lee and Carter17] is probably the most commonly used.Footnote 1 The model assumes that the natural logarithm of the central death rates at all ages are driven by a single time-varying index (typically denoted by  $k(t)$), of which the evolution over time
 $t$ follows a linear stochastic time-series process. The response to the time-varying index at each age
 $x$ is determined by a parameter (usually represented by
 $b(x)$), which is assumed to be invariant over time. In effect, the model implies that central death rates at all ages decline exponentially at constant (but different) rates.
Given how the LC model is specified, it is clear that the model's validity depends heavily on (1) the linearity of the expected trajectory of the time-varying indexes and (2) the invariance of the response parameters over time. The problems associated with assumption (1) have been studied extensively by researchers including Coelho and Nunes [Reference Coelho and Nunes8] and Li and Chan [Reference Li and Chan22] who developed linearity tests for the LC time-varying index, and Van Berkum et al. [Reference Van Berkum, Antonio and Vellekoop40] who examined how the existence of multiple structural breaks in the LC time-varying index may affect mortality projections. The problems associated with assumption (2) have been less extensively studied. Exemplified by the contributions of Booth et al. [Reference Booth, Hyndman, Tickle and De Jong3], Lee and Miller [Reference Lee and Miller18], and Li and Li [Reference Li and Li26], most of the previous studies on assumption (2) focus on the search for a calibration window over which the response parameters can be reasonably assumed to be constant. This approach is very passive, and completely ignores the possibility that the response parameters may vary in the future.
Recently, Li et al. [Reference Li, Lee and Gerland31] approached the problems associated with assumption (2) from a different angle. They attributed the variation in LC response parameters over time to a phenomenon known as “rotation,” which refers to the deceleration (acceleration) of mortality decline at younger (older) ages, a pattern that is anticipated in developed countries where deaths from infectious diseases (which represent a main driver of mortality at younger ages) have been largely eliminated. This phenomenon has been demonstrated by researchers in demographic and medical sciences including Rau et al. [Reference Rau, Soroko, Jasilionis and Vaupel36] who reported increasing annual percentage declines in age-specific death rates over 1970–2005 for Japanese aged between 80 and 99, and Christensen et al. [Reference Christensen, Doblhammer, Rau and Vaupel6] who pointed out that since the 1950s, and especially since the 1970s, mortality at ages 80 years and older in some countries declines at an accelerating pace. Other researchers such as Kannisto et al. [Reference Kannisto, Lauritsen, Thatcher and Vaupel12] and Li and Gerland [Reference Li and Gerland23] have also shown the acceleration (deceleration) of mortality decline at older (younger) ages by graphical means.
Variation in the age distribution of mortality decline over time may also be seen in mortality heat maps, which are often used in actuarial research and practice. A mortality heat map indicates the level of mortality decline at each age and time with a certain color, with a warmer color representing a faster mortality decline and a cooler color representing the opposite. For instance, Li and Liu [Reference Li and Liu27] found that between 1990 and 2010, the color of the mortality heat map for Canadian males aged between 65 and 85 is particular warm, indicating an acceleration of mortality decline at these ages occurred in recent decades.
Building on their previous work [Reference Li and Gerland23], Li et al. [Reference Li, Lee and Gerland31] developed an extension of the LC model that captures rotation of age patterns of mortality decline. In the extended model, the  $b(x)$ schedule shifts gradually over time to an “ultimate”
 $b(x)$ schedule, which is determined primarily by averaging the values of
 $b(x)$ in the original LC model over ages 15–65, and the projected values of
 $k(t)$ are adjusted accordingly in such a way that the life expectancy forecasts produced by the extended model are the same as those generated from the original model. Compared with its original counterpart, the extension yields long-term mortality projections that have more biologically reasonable age patterns, in the sense that they remain U-shaped, reducing from a relatively high level at infancy to a minimum at a certain teen age, and increasing thereafter [Reference Chu, Chien and Lee7,Reference Lee15,Reference Lee16].
Although the contribution of Li et al. [Reference Li, Lee and Gerland31] represents an important breakthrough, a few limitations still remain. First, their model comes with no formal statistical test to support the existence of rotation. In the absence of a formal test for rotation, any long-term mortality projection derived from the model lacks scientific rigor. Arguably, such a formal test is not straightforward to develop, because, as Li et al. [Reference Li, Lee and Gerland31] pointed out, rotation is typically a subtle phenomenon. Although Vékás [Reference Vékás41] recently contributed a method to measure rotation and gauge its statistical significance, the method has no connection to any mortality projection model, thereby leaving the testing and modeling of rotation in a unified framework an open question.
Second, in the model of Li et al. [Reference Li, Lee and Gerland31], the ultimate  $b(x)$ schedule is determined in a rather subjective manner. Also, the adjusted future
 $k(t)$ values do not progress logically from the
 $k(t)$ values over the calibration window, and as such the interpretation of
 $k(t)$ as a time trend of the overall mortality level is weakened, if not lost. More importantly, the way in which the model of Li et al. [Reference Li, Lee and Gerland31] is developed entails some sort of circular reasoning: the model is developed to incorporate rotation into long-term mortality forecasts, but it draws from the life expectancy forecasts produced by the original LC model, which does not take rotation into account. However, we do concur with Li et al. [Reference Li, Lee and Gerland31] in their view that modeling rotation with a data-driven approach is highly challenging. This is in part because of the subtlety of rotation, and in part because allowing a time-varying
 $b(x)$ schedule often involves a substantial relaxation of the model structure, and with a reduced degree of rigidity, the model may result in erroneous forecasts of future mortality rates.
Third, the model of Li et al. [Reference Li, Lee and Gerland31] does not indicate the uncertainty surrounding the best estimate of future mortality rates. Tuljapurkar [Reference Tuljapurkar39] described mortality forecasting as a “bumpy road to Shangri-La,” as the demographic future of any human population is a result of complex and only partially understood mechanisms, and is highly uncertain. It is, therefore, important to quantify the uncertainty associated with a mortality projection, and ideally, a mortality forecasting model should be able to generate “sample paths” of future mortality, allowing the user to understand how an age-specific death rate may possibly evolve from the forecast origin to a certain future time point. However, given the way in which Li et al. [Reference Li, Lee and Gerland31] handle the time-varying index  $k(t)$, it is unclear to us as to how the model of Li et al. [Reference Li, Lee and Gerland31] can be further extended to incorporate forecast uncertainty.
In this paper, we attempt to address these limitations by introducing an alternative mortality forecasting method that incorporates rotation. After a myriad of experiments, we come up with a method that is composed of the following two key components:
1. A new model structure
We develop a parsimonious model structure for capturing rotation in historical and future age patterns of mortality decline. All terms in the new model structure are readily interpretable, and one of them is devoted to measuring the extent of rotation over time. While the new model structure takes rotation into account, it still retains much of the rigidity of the original LC model to avoid the possibility of producing erroneous mortality forecasts.
2. ANCOVA
Given that rotation is typically a subtle phenomenon, a test for its existence should require a “big data” analytic method that pools data from a large collection of developed countries. We synthesize the “rotation component” in the new model structure with a data analytic technique known as ANCOVA, producing a statistical test for the existence of rotation and a stochastic process for extrapolating rotation into the future. With the aid of the stochastic process, we can gauge the uncertainty surrounding the best estimate of future mortality, and even generate sample paths of future mortality rates.
We have applied our proposed method to data from 17 developed countries, and drawn the following major conclusions. First, the new model structure yields a significantly better fit to historical data, even if the use of additional parameters is penalized. Second, the existence of rotation is supported by the statistical test we developed. Third, our proposed method produces long-term mortality forecasts that are (i) more plausible than the original LC forecasts and (ii) comparable to those generated from the extension developed by Li et al. [Reference Li, Lee and Gerland31] but come with measures of uncertainty. Fourth, the proposed method can be generalized easily to a multi-population version, producing nondivergent (coherent) mortality forecasts for a collection of related populations [Reference Li and Lee25].
The rest of this paper is organized as follows. Section 2 reviews the LC method and its extension developed by Li et al. [Reference Li, Lee and Gerland31], and discusses their limitations in further detail. Section 3 presents the new model structure. Section 4 introduces the ANCOVA technique for testing the existence of rotation and modeling rotation over time. Section 5 explains how extrapolative forecasts can be obtained from the estimated model and ANCOVA result. Section 6 evaluates the mortality forecasts produced by our proposed method and discusses the implication of our proposed method on annuity pricing. Finally, Section 7 concludes the paper with a discussion on how our proposed method may be generalized into a coherent multi-population version.
2. A review of the Lee–Carter (LC) and Li–Lee–Gerland (LLG) models
2.1. The LC model
We let  $m(x,t)$ be the central death rate at age
 $x$ and in year
 $t$. The original Lee-Carter (LC model assumes that
 \begin{equation} \ln(m(x,t)) = a(x) + b(x)k(t) + \epsilon(x, t), \end{equation}
where  $a(x)$ is an age-specific parameter representing the average level of mortality at age
 $x$ over the calibration window,
 $k(t)$ is a time-varying index which can be regarded as the (only) driving force of mortality decline,
 $b(x)$ is another age-specific parameter that measures the sensitivity of the log central death rate at age
 $x$ to the time-varying index, and
 $\epsilon (x, t)$ is the error term.
The LC model can be estimated using methods such as singular value decomposition and maximum likelihood. It is well known that the LC model is subject to an identifiability problem in the sense that there exist multiple parameter combinations that give exactly the same fit to historical data. To stipulate parameter uniqueness, the following constraints are often used in the estimation process:
 \begin{equation} \sum_{t=t_{1}}^{t_{n}} k(t)=0, \quad \sum_{x=x_{1}}^{x_{n}} b(x)=1, \end{equation}
where  $[t_1, t_n]$ represents the calibration window and
 $[x_1, x_n]$ denotes the age range to which the model is applied.
To capture the evolution of log mortality rates over time, the time-varying index  $k(t)$ is further modeled by a time-series process. In the original work of Lee and Carter [Reference Lee and Carter17] and many other applications of the LC model, it is assumed that
 $k(t)$ follows a random walk with drift:
 \begin{equation} k(t) = d + k(t - 1) + \varepsilon(t), \end{equation}
where  $d$ is the drift term and
 $\varepsilon (t)$ represents the time-
 $t$ innovation. It is assumed that
 $\varepsilon (t)$ possesses no serial correlation, is uncorrelated with
 $\epsilon (x, t)$, and follows a normal distribution with a zero mean and a constant variance.
Although the LC model has been widely used (see, e.g., [Reference Booth1,Reference Lee14,Reference Wilson and Rees45]), it has received some criticisms, one of which is that it does not permit the age pattern of mortality decline to vary with time. This limitation can be discerned easily by jointly considering equations (1) and (3), which imply that the expected annual rate of mortality decline (in log scale) at age  $x$ is simply
 $-b_x d$, a value that is independent of time
 $t$. A time-invariant age pattern of mortality decline is unconvincing, in part because over the long run the pattern of age-specific death rates will become biologically implausible should the same rates of mortality decline continue indefinitely [Reference Li, Lee and Gerland31] pp. 2018–9, and in part, because it is contrary to researchers’ observation that mortality decline at older ages has accelerated in recent decades while the opposite is true for younger ages [Reference Horiuchi and Wilmoth10,Reference Kannisto, Lauritsen, Thatcher and Vaupel12,Reference Li and Gerland23]. This limitation is particularly significant when the model is used to project mortality far into the future.
2.2. The LLG model
Li et al. [Reference Li, Lee and Gerland31] coined the phenomenon of varying age patterns of mortality decline as rotation. They mitigated the limitation mentioned in the previous subsection by extending the original LC model to incorporate rotation. Throughout the rest of this paper, we call this extension the Li–Lee–Gerland (LLG) model.
By noting that the age pattern of mortality decline is determined exclusively by the  $b(x)$ schedule, Li et al. [Reference Li, Lee and Gerland31] constructed the LLG model by replacing
 $b(x)$ with a time-varying response
 $b(x,t)$, and
 $k(t)$ with another time-varying index
 $k^{\star }(t)$ that is adapted accordingly; that is,
 \begin{equation} \ln(m(x,t)) = a(x) + b(x,t)k^{{\star}}(t) + \epsilon(x, t) \end{equation}
for  $t = t_n + 1, t_n + 2, \ldots$. As in the original LC model,
 $a(x)$ represents the average log central death rate at age
 $x$ over the calibration window, and
 $\epsilon (x,t)$ is the error term. Within the calibration window
 $[t_1, t_n]$, the LLG and LC models are identical.
The time-varying response  $b(x,t)$ is defined as the following weighted average:
 \begin{equation} b(x,t) = (1-w_{s}(t)) b(x)+w_{s}(t) b_{u}(x), \end{equation}
for  $x = x_1, \ldots, x_n$ and
 $t = t_n + 1, t_n + 2, \ldots$, where
 $w_s(t)$ is a smooth time-varying weight function,
 $b(x)$ is the response to
 $k(t)$ in the original LC model, and
 $b_{u}(x)$ is the “ultimate” value of
 $b(x,t)$. The schedule of
 $b_{u}(x)$ governs the age pattern of mortality decline in the distant future.
The values of  $b_{u}(x)$ are obtained by tweaking the values of
 $b(x)$ in the original LC model. Suppose that the LLG model is fitted to data from age
 $x_0 = 0$ to age
 $x_n \geq 70$. The initial estimates of
 $b_{u}(x)$ for
 $x = 0, \ldots, x_n$ are calculated as follows:
 $$\tilde{b}_{u}(x) = \left\{\begin{array}{ll} \displaystyle \dfrac{1}{51}\sum^{65}_{x=15} b(x), & 0\le x \le 65, \\ \tilde{b}_{u}(65), & 66 < x < 70, \\ b(x) \times \tilde{b}_{u}(65)/b(70), & 70 \leq x \leq x_n. \end{array} \right.$$
Notably, for ages 0–65,  $\tilde {b}_{u}(x)$ is simply set to the arithmetic average of
 $b(x)$ in the original LC model over the age range of 15–65. The final estimates of
 $b_{u}(x)$ for
 $x = 0, \ldots, x_n$ are given by
 $$b_{u}(x)=\frac{\tilde{b}_{u}(x)}{\sum_{x=0}^{x_n}\tilde{b}_{u}(x) }, \quad 0\le x \le x_n.$$
Same as the schedule of  $b(x)$ in the original LC model, the sum of
 $b_{u}(x)$ over
 $x = 0$ to
 $x = x_n$ is one.
The smooth time-varying weight function  $w_s(t)$ also takes two steps to construct. First, a crude weight function
 $w(t)$,
 $t = t_n + 1, t_n + 2, \ldots$, is defined as follows:
 \begin{equation} w(t)=\frac{e_{0}(t)-80}{102 - 80} \end{equation}
if  $e_0(t) > 80$,
 $w(t) = 0$ if
 $e_0(t) \leq 80$, and
 $w(t) = 1$ if
 $e_0(t) \geq 102$, where
 $e_{0}(t)$ is the life expectancy at birth in year
 $t$, projected by the original LC model. Next,
 $w(t)$ is smoothed by a trigonometric function to yield the smooth time-varying weight function
 $w_s(t)$:
 \begin{equation} w_{s}(t)=\left\{0.5\left[1+\sin \left(\frac{\pi}{2} ( 2w(t)-1) \right) \right]\right\}^{p}, \end{equation}
for  $t = t_n + 1, \ldots$, where
 $p$ (which is set to 0.5) is a parameter that controls the speed of the rotation.
It is quite clear that  $w_s(t) = 0$ when
 $e_0(t) \leq 80$, so rotation does not begin until the life expectancy at birth becomes greater than 80 years. As
 $e_0(t)$ increases from 80,
 $b(x,t)$ converges smoothly from
 $b(x)$ (the original LC response parameter) to its ultimate value
 $b_u(x)$. Rotation ceases when the
 $e_0(t)$ reaches 102, beyond which
 $w_s(t) = 1$. Empirically,
 $b(x)$ in the original LC model roughly decreases with age. Therefore, given how
 $b_u(x)$ is calculated, it is anticipated that
 $b_u(x)$ is smaller than
 $b(x)$ at younger ages (especially ages lower than 15). Furthermore, because the values of
 $b_u(x)$ over the entire age range sum to one, if
 $b_u(x)$ is smaller than
 $b(x)$ at younger ages, then
 $b_u(x)$ must be greater than
 $b(x)$ at higher ages. Hence, as
 $w_s(t)$ increases from zero to one, mortality decline at younger ages decelerates while mortality decline at older ages accelerates.
Finally, the adjusted time-varying index  $k^{\star }(t)$, for
 $t = t_n + 1, t_n + 2, \ldots$, is determined. As with the calculation of the weight function
 $w(t)$, this step draws from the life expectancy forecasts from the original LC model. In particular, the value of
 $k^{\star }(t)$ in a given year
 $t$ is determined such that the life expectancy at birth implied by
 $k^{\star }(t)$ and the previously estimated values of
 $a(x)$ and
 $b(x,t)$ over the entire age range of age range
 $[x_1,x_n]$ is equal to
 $e_0(t)$, the life expectancy at birth in year
 $t$ projected by the original LC model.
It is clear that after rotation commences (i.e., after year  $t_n$ or the year when the life expectancy at birth exceeds 80, whichever is the latest), the values of
 $k^{\star }(t)$ and
 $k(t)$ are different. The solution to
 $k^{\star }(t)$ takes no analytical form, and thus has to be obtained using numerical methods. Having determined
 $k^{\star }(t)$, the LLG forecasts of age-specific log central death rates can be obtained straightforwardly with Eq. (4).
2.3. Shortcomings of the LLG model
The LLG model represents an important breakthrough, as to date no other extension of the original LC model features a time-varying  $b(x)$ schedule to capture rotation. Nonetheless, we believe that the LLG model is subject to some significant limitations, which we now discuss.
First, the LLG model involves a large extent of subjectivity. In particular, subjective decisions have to be made concerning the form of the  $b_u(x)$ schedule, the life expectancy when rotation begins, the life expectancy when rotation ends, and the weight function that blends
 $b(x)$ into
 $b_u(x)$. There appears to be room to develop a more data-driven approach to incorporate rotation into mortality forecasts.
Second, unlike  $k(t)$ in the original LC model,
 $k^{\star }(t)$ in the LLG model cannot be considered as the (only) driver of mortality dynamics, because both the response
 $b(x,t)$ and the index
 $k^{\star }(t)$ itself are time-varying. More importantly, given how
 $k^{\star }(t)$ is determined, the evolution of
 $k^{\star }(t)$ should deviate from that of
 $k(t)$ (which follows a random walk with drift), but there is no clue as to what stochastic process
 $k^{\star }(t)$ should follow. Without an identifiable stochastic process, we are unable to quantify the uncertainty surrounding the central mortality forecast and to generate sample paths of future mortality rates. A better model for capturing rotation would be one that is more interpretable and is able to produce stochastic mortality forecasts.
Third, the LLG model is purely forward-looking, giving no indication of rotation in the past. Without confirming the statistical significance of rotation, mortality projections featuring rotation lacks scientific rigor. Furthermore, if the life expectancy at birth has already exceeded 80 within the calibration window (i.e., rotation should have already begun within the calibration window, according to the model assumptions), then it follows from Eqs. (5) to (7) that  $k^{\star }(t)$ would not progress logically from the
 $k(t)$ values over the calibration window, resulting in a discontinuation between historical (fitted) and projected mortality rates at the forecast origin (year
 $t_n$) as illustrated later in Section 6. This problem might not be material when considering long-term forecasts only, but is significant if short-term forecasts also matter to the application in question. We believe that an improved approach should feature a statistical test for rotation, and maximize continuity at the forecast origin.
Finally, the LLG model draws heavily from the output of the original LC model. Specifically, the original LC life expectancy forecasts are used as an input in the calculation of  $w_s(t)$, and also as a benchmark in the sense that the values of
 $k^{\star }(t)$ for
 $t > t_n$ are calibrated to ensure that the LLG model produces the exactly the same life expectancy forecasts as the original LC model. The heavy reliance of the output of the original LC model is not very convincing, as the original LC model does not incorporate rotation but rotation is a phenomenon that we believe is important and intend to capture. A more convincing model should be self-contained, without referencing to another model (particularly one that does not take rotation into account).
3. A new model structure
The limitations of the LLG model motivate us to develop an alternative method for capturing rotation. Our proposed method is composed of two key components: a new model structure and the ANCOVA technique. In this section, we present the new model structure and two estimation methods for it. In the next section, we introduce the ANCOVA technique for statistically testing the existence of rotation and modeling the evolution of rotation over time. Finally, in the section after next, we explain how extrapolative forecasts can be obtained from the new model structure and the ANCOVA result.
3.1. Specification
The model structure we propose is given by
 \begin{equation} \ln m(x,t) = a(x) + \tau_{1}(t) + c(x)\tau_{2}(t) + \epsilon(x,t). \end{equation}
As in the original LC model,  $a(x)$ is an age-specific parameter representing the average level of mortality at age
 $x$ over the calibration window, and
 $\epsilon (x,t)$ is the error term. The proposed model structure contains two time-varying indexes. We can interpret the first time-varying index
 $\tau _1(t)$ as the baseline driving force of mortality decline, affecting all ages equally. The other time-varying index
 $\tau _2(t)$ serves an additional driving force of mortality decline. It interacts with an age-specific response parameter
 $c(x)$, thereby permitting the rates of mortality decline at different ages to deviate from the baseline rate of mortality decline.
The proposed model can be seen as an extension of the original LC model in two ways. First, it is obvious that if  $\tau _1(t) = 0$ for every
 $t$, then the proposed model degenerates to the original LC model with
 $b(x) = c(x)$ and
 $k(t) = \tau _2(t)$. It is also clear that if
 $\tau _2(t) = h\tau _1(t)$ for every
 $t$ and some constant
 $h\neq 0$, then the proposed model degenerates to the original LC model with
 $b(x) = 1 + hc(x)$ and
 $k(t) = \tau _1(t)$. Second, by rewriting Eq. (8) as
 \begin{equation} \ln m(x,t) = a(x) + \left(1 + \frac{c(x)\tau_2(t)}{\tau_1(t)}\right)\tau_{1}(t) + \epsilon(x,t), \end{equation}
we can understand the proposed model as the LC model with a time-varying index  $k(t) = \tau _1(t)$ and a time-varying response
 $b(x,t) = 1 + c(x)\tau _2(t)/\tau _1(t)$ to the index. It can also be inferred from Eq. (9) that the proposed model is capable of capturing rotation, provided that the evolution of
 $\tau _2(t)$ over time is specified appropriately. The proposed model structure retains much of the rigidity of the original LC model structure, thereby preventing it from generating implausible forecasts of future mortality rates.
We also remark that the proposed model may be regarded as a special case of the LC variant considered by Renshaw and Haberman [Reference Renshaw and Haberman37], which can be expressed as
 $$\ln m(x,t) = a(x) + b(1,x)k(1,t) + b(2,x)k(2,t) + \epsilon(x,t),$$
where  $a(x)$,
 $b(1,x)$, and
 $b(2,x)$ are age-specific parameters,
 $k(1,t)$ and
 $k(2,t)$ are time-varying indexes, and
 $\epsilon (x,t)$ is the error term.Footnote 2 This LC variant degenerates to our proposed model with
 $\tau _1(t) = k(1,t)$ and
 $\tau _2(t) = k(2,t)$ if
 $b(1,x)$ is set to one for all
 $x = x_1, \ldots, x_n$. However, it should be emphasized that Renshaw and Haberman [Reference Renshaw and Haberman37] focused only on the improvement of fit over the original LC model without considering the issue of rotation. The reason why having
 $b(1,x) = 1$ for all
 $x = x_1, \ldots, x_n$ facilitates us to capture rotation is made clear in Section 4 where the modeling of rotation is detailed.
Furthermore, if  $\tau _2(t)$ is set to a linear deterministic function of time
 $t$, then the proposed model can be seen as the APCI model without a cohort effect [Reference Richards, Currie, Kleinow and Ritchie38]. It should be noted that this variant does not allow any rotation, as it implies that the mortality improvement rate (the change in log central death rate per annum) at any given age
 $x$ is a constant over time.
The proposed model requires three constraints to stipulate parameter uniqueness. This requirement can be explained as follows. If  $a(x)$,
 $c(x)$,
 $\tau _1(t)$, and
 $\tau _2(t)$ are parameters of the proposed model, then
 $a'(x)=a(x)-c_3+c(x)c_2$,
 $\tau '_1(t)=\tau _1(t)+c_3$,
 $c'(x)=c(x)/c_1$, and
 $\tau '_2(t)=c_1(\tau _2(t)-c_2)$ for any constants
 $c_1, c_2$, and
 $c_3$, where
 $c_1 \neq 0$, are equivalent parameters, because
 $$a'(x)+\tau'_{1}(t)+c'(x)\tau'_{2}(t) = a(x) + \tau_1(t) + c(x)\tau_2(t).$$
Consequently, three parameter constraints are needed, so that the three constants  $c_1$,
 $c_2$, and
 $c_3$ can be fixed. We use the following three constraints:
 \begin{equation} \sum_{t=t_{1}}^{t_{n}} \tau_1(t)=0, \quad \sum_{t=t_{1}}^{t_{n}}\tau_2(t)=0, \quad \text{and} \quad \sum_{x=x_{1}}^{x_{n}}(c(x))^2=1. \end{equation}
The last constraint merits some discussions. Unlike  $b(x)$ in the original LC model which is typically positive for every age
 $x$,
 $c(x)$ in the proposed model may be positive or negative, because mortality decline at any age
 $x$ may be faster or slower than the baseline rate of mortality decline. As the deviations from the baseline rate of mortality decline even out, the average (and hence sum) of
 $c(x)$ over the entire age range under consideration should be close to zero, and consequently forcing
 $c(x)$ to sum to one would make the estimation process highly unstable. For this reason, the last constraint is based on the sum of
 $(c(x))^2$ instead.
The constraints above are not sufficient to fix the signs of  $c(x)$ and
 $\tau _2(t)$, because if
 $c(x)$ and
 $\tau _2(t)$ are parameters satisfying the constraints, then correspondingly
 $-c(x)$ and
 $-\tau _2(t)$ must also be parameters satisfying the constraints. We fix the sign of
 $c(x)$ such that
 $\tau _2(t)$ possesses a downward trend over time, thereby preserving the interpretation of
 $\tau _2(t)$ as an additional force of mortality decline.
3.2. Estimation methods
We propose two methods for estimating the proposed model.
Method I: Least Squares and Singular Value Decomposition. In Method I, we first obtain estimates of  $a(x)$ and
 $\tau _1(t)$ by minimizing the following sum of squared errors:
 $$\sum_{x=x_{1}}^{x_{n}}\sum_{t=t_{1}}^{t_{n}} ( \ln \tilde{m}(x,t)-a(x)-\tau_{1}(t) )^2,$$
where  $\tilde {m}(x,t)$ denotes the observed value of
 $m(x,t)$. It can be shown that the solution to this minimization problem is
 \begin{equation} \hat{a}(x)=\frac{\sum_{t=t_{1}}^{t_{n}} \ln \tilde{m}(x,t) }{t_n -t_1+1}, \quad x=x_{1}, \ldots, x_n, \end{equation}
and
 \begin{equation} \hat{\tau}_{1}(t)=\frac{\sum_{x=x_{1}}^{x_{n}}(\ln \tilde{m}(x,t)-\hat{a}(x))}{x_{n}-x_{1}+1}, \quad t=t_{1}, \ldots, t_{n}. \end{equation}
The estimates of  $a(x)$ and
 $\tau _1(t)$ given in Eqs. (11) and (12) satisfy the constraints presented in Section 3.1.
Next,  $c(x)$ and
 $\tau _{2}(t)$ are estimated by applying a singular value decomposition (SVD) to matrix of
 $$\ln \tilde{m}(x,t) - \hat{a}(x)- \hat{\tau}_{1}(t),$$
 $x = x_1, \ldots, x_n$ and
 $t = t_1, \ldots, t_n$. In particular, the estimates of
 $\{c(x); x = x_1, \ldots, x_n\}$ and
 $\{\tau _1(t); t = t_1, \ldots, t_n\}$ are set to the first left and right singular vectors, respectively. The SVD estimates of
 $c(x)$ and
 $\tau _{2}(t)$ are rescaled so that they satisfy the constraints presented in Section 3.1.
Method II: Maximum Likelihood. Method II is based on a likelihood function that is constructed by imposing a distributional assumption on death counts. We let  $D(x,t)$ be the observed death count at age
 $x$ and in year
 $t$, and
 $E(x,t)$ be the corresponding exposure count. Following Wilmoth [Reference Wilmoth43], we assume that
 $D(x,t)$ is a realization from a Poisson distributionFootnote 3 with a mean of
 $$E(x,t) \exp (a(x)+\tau_{1}(t)+c(x)\tau_{2}(t)).$$
Given this distributional assumption, the log-likelihood function of the proposed model is given by
 \begin{align} l & = \sum_{x=x_{1}}^{x_{n}}\sum_{t=t_{1}}^{t_{n}} ( D(x,t) (a(x)+\tau_{1}(t)+c(x)\tau_{2}(t))\nonumber\\ & \quad -E(x,t) \exp(a(x)+\tau_{1}(t)+c(x)\tau_{2}(t))+D(x,t)\ln E(x,t) - \ln (D(x,t)!)). \end{align}
Parameter estimates are obtained by maximizing  $l$ with respect to the model parameters. The maximization can be accomplished by an iterative Newton–Raphson algorithm, which is detailed in Appendix A.
Method II is advantageous of being able to reconcile the total expected and fitted death counts in each year over the calibration window (see [Reference Wilmoth43]). It also enables us to quantify parameter uncertainty through the asymptotic normality of the parameter estimates or parametric bootstrapping methods (see [Reference Li21]). Parameter estimates obtained from Methods I and II are generally very similar.
3.3. Estimation results
We estimate the proposed model to data from 17 developed countries, including Australia, Austria, Belgium, Canada, Denmark, Spain, Finland, France, Ireland, Italy, Japan, the Netherlands, Norway, Sweden, the United Kingdom, Switzerland, and the United States, separately for each gender. The required data are obtained from the Human Mortality Database [11]. For all populations considered, we use an age range of  $x_1 = 0$ to
 $x_n = 100$, and a calibration window from
 $t_1 = 1950$ to
 $t_n = 2010$. Note that Li et al. [Reference Li, Lee and Gerland31] also considered a calibration window that begins in 1950.
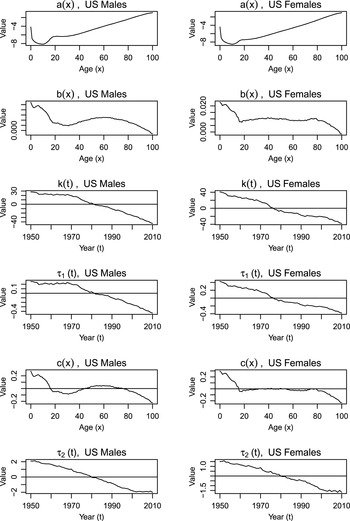
Figure 1 displays the parameter estimates for the United States, obtained using Method II. To ease comparing and contrasting with the original LC model, the estimates of  $b(x)$ and
 $k(t)$ in the original LC model are displayed in tandem. The following observations are made.
1. Similar to the estimates of
 $k(t)$ in the original LC model, the estimates of the primary time-varying index $\tau _1(t)$ in our proposed model possess a downward trend, indicating a steady decline in overall mortality over the calibration window.
2. A downward trend is also observed in the estimates of the other time-varying index
$\tau _{2}(t)$ in the proposed model, so we can regard $\tau _{2}(t)$ as an additional force of mortality change. As $\tau _{2}(t)$ interacts with an age-specific parameter $c(x)$, its impact on different ages are different.3. The estimates of
$c(x)$ are positive for young ages but negative for old ages, suggesting that over the calibration window mortality generally declines faster at younger ages than at older ages.4. The age pattern of mortality decline implied by the parameter estimates can be seen more clearly by considering first differences. We let
$\Delta$ be the first difference operator (with respect to time). Given the patterns of both $\tau _{1}(t)$ and $\tau _{2}(t)$, $\Delta \tau _{1}(t)$ and $\Delta \tau _{2}(t)$ are negative on average. Ignoring the error term in Eq. (8), the proposed model implies that the change in log central death rate from year $t$ to $t-1$ is
with$$\Delta \ln m(x,t)=\Delta \tau_1(t)+c(x)\Delta \tau_2(t),$$
$\Delta \tau _1(t)$ representing the baseline rate of change in $\ln m(x,t)$. The more negative $\Delta \tau _1(t)+c(x)\Delta \tau _2(t)$ is, the faster the mortality decline at age $x$ is.
Figure 1.Estimates of
$a(x)$, $c(x)$, $\tau _1(t)$, and $\tau _2(t)$ in the proposed model and estimates of $b(x)$ and $k(t)$ in the original LC model, US males (left panels) and US females (right panels).At younger ages when the estimates of
$c(x)$ are positive, we have
suggesting that mortality at younger ages improves faster than the baseline rate of mortality decline over the calibration window. Similar reasoning can also be applied to older ages for which the estimates of$$\Delta \tau_1(t)+c(x)\Delta \tau_2(t)<\Delta \tau_1(t),$$
$c(x)$ are negative.
It is interesting to see that the estimates of
$c(x)$ ages 20–60 are very close to zero for female, implying that the rates of mortality decline for these ages are virtually the same as the baseline rate within the calibration window.5. Despite having similar patterns, the estimates of
$\tau _1(t)$ and $\tau _2(t)$ do not follow a proportional relationship; that is, it is not possible find a constant $h$ such that $\tau _2(t) = h\tau _1(t)$ for every $t$. Therefore, the proposed model does not degenerate to the original LC model.


For the sake of space, we only display the parameter estimates for the United States, but we remark that the observations noted above also apply to the other 16 developed countries considered.
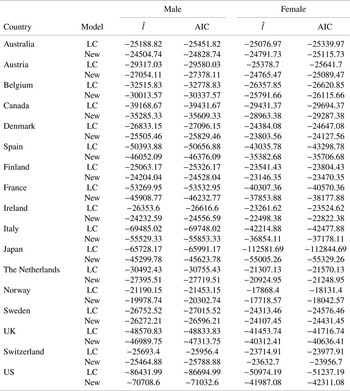
We now evaluate the fit of the proposed model to historical data. Since the proposed model contains  $t_n - t_1 + 1$ extra model parameters, it naturally offers an improvement in statistical fit (in terms of, for example, the maximized log-likelihood value). To fairly compare the proposed model with the original LC model, a penalty for the extra parameters should be taken into consideration. In this regard, we evaluate fit to historical data using the Akaike information criterion (AIC), defined as
 $$\text{AIC} = \hat{l} - n_p,$$
where  $\hat {l}$ is the maximized log-likelihood value, and
 $n_p$ is the number of parameters. In the AIC,
 $\hat {l}$ measures the fit to historical data, while
 $n_p$ represents a penalty that increases with the number of parameters used. It is clear from the definition that we prefer a model with a higher AIC value. Table 1 compares the values of
 $\hat {l}$ and AIC resulting from our proposed model and the original LC model, for all of the 17 developed countries considered with a calibration window [1950, 2010]. The results suggest that our proposed model consistently provide a better fit to historical data compared with the original LC model, even when the use of additional parameters is penalized.
Values of  $\hat {l}$ and AIC from our proposed model and the original LC model.

4. Testing and extrapolating rotation
In this subsection, we explain how the existence of rotation can be statistically tested and how rotation can be extrapolated into the future. As we are about to reveal, the test and extrapolation are based heavily on  $\Delta \tau _2(t)$, the first difference of
 $\tau _2(t)$.
4.1. A statistical test
Let us revisit the annual changes in log central death rates implied by our proposed model. Ignoring the error term in Eq. (8), our proposed model implies that:
 \begin{equation} \Delta \ln m(x,t)=\Delta \tau_1(t)+c(x)\Delta \tau_2(t), \end{equation}
where  $\Delta \tau _1(t)$ and
 $\Delta \tau _2(t)$ within the calibration window are negative on average. The more negative
 $\Delta \ln m(x,t)$ is, the higher the rate of mortality decline at age
 $x$ is. As such, the pattern of the (negative) values of
 $\Delta \ln m(x,t)$ across ages for a given year
 $t$ can thus be interpreted to mean the age pattern of mortality decline in that year.
A change in  $\Delta \tau _1(t)$ over time would lead to a parallel shift in the pattern of
 $\Delta \ln m(x,t)$ across ages. Such a change would not result in any rotation, because it would accelerate or decelerate decline in mortality (in log scale) at all ages by exactly the same amount.
In contrast, through the interaction between  $c(x)$ and
 $\Delta \tau _2(t)$, a change in
 $\Delta \tau _2(t)$ would lead to a rotation in the age pattern of mortality decline. To explain, let us consider the lower end of the age range for which the estimates of
 $c(x)$ are positive. For these ages, if
 $\Delta \tau _2(t)$ rises (becomes closer to zero from a negative value), then the values of
 $c(x)\Delta \tau _2(t)$ would become closer zero, so that the rates of mortality decline would reduce and approach the baseline rate of mortality decline, characterized by
 $\Delta \tau _1(t)$. Using similar arguments, we can deduce that at higher ages for which the estimates of
 $c(x)$ are negative, an increase in
 $\Delta \tau _2(t)$ (which makes
 $\Delta \tau _2(t)$ closer to zero from a negative value) would lead the rates of mortality decline to increase and approach the baseline rate of mortality decline.
It is now clear that a statistical test for the existence of rotation should be based on the trend in the values of  $\Delta \tau _2(t)$. We are particularly interested in an upward trend, which, as explained in the previous paragraph, represents an acceleration of mortality at older ages and a deceleration of mortality at younger ages. In this regard, the test for the existence of rotation boils down to a one-sided test for the significance of the slope of the linear regression of
 $\Delta \tau _2(t)$ against
 $t$. In particular, the null and alternative hypotheses of the test should be formulated as follows:
• Null hypothesis: There is no rotation. Equivalently speaking, the gradient of
$\Delta \tau _2(t)$ against $t$ is zero.• Alternative hypothesis: Rotation exists. Equivalently speaking, the gradient of
$\Delta \tau _2(t)$ against $t$ is positive.


However, this simple test is inadequate. Given that rotation is a subtle phenomenon, running such a test using  $\Delta \tau _2(t)$ for one population only would lead to low-powered results, with a good chance of not rejecting the null hypothesis even if the alternative hypothesis is true. Technically speaking, testing trends in first-order differences involves second-order differences. As second-order differences are typically highly volatile, this simple test would not produce meaningful results if it is not augmented to take additional information into consideration.
To mitigate the inadequacy, we utilize the ANCOVA (analysis of covariance) technique. In the context of our application, the ANCOVA can be expressed as follows:
 \begin{equation} \Delta \tau_{2,i}(t) = \alpha_i + \beta\cdot t + u_i(t), \end{equation}
where  $\tau _{2,i}(t)$ denotes the value of
 $\tau _{2}(t)$ for population
 $i$,
 $\alpha _i$ and
 $\beta$ are parameters, and
 $u_i(t)$ is the error term. The ANCOVA captures the time trends of
 $\tau _{2}(t)$ for all of the populations under consideration with a single slope term (
 $\beta$), but to retain some flexibility the intercept terms for different populations are allowed to be different. We apply the ANCOVA to the 17 developed countries (listed in Section 3.3), leveraging the information contained in all of the 17 data sets to infer the gradient (
 $\beta$) of the underlying trend of
 $\tau _{2}(t)$. With the ANCOVA, the null and alternative hypotheses are refined as follows:
• Null hypothesis: There is no rotation when considering the collection of populations jointly
$(\beta = 0)$.• Alternative hypothesis: Rotation exists when considering the collection of populations jointly
$(\beta > 0)$.


We apply the ANCOVA to the values of  $\tau _{2}(t)$ that are derived using a calibration window of [1950, 2010] (which is the same as that used in Section 3.3) and an age range of
 $[0, x^*]$, where
 $x^* \leq x_n$ represents a certain high age. To examine the sensitivity of the ANCOVA results to the inclusion of old-age data, we repeat the ANCOVA for every
 $x^* = 65, 66, \ldots, 100$. Furthermore, to enhance robustness of the estimated gradient, we implement the ANCOVA with the median regression method instead of ordinary least squares.Footnote 4
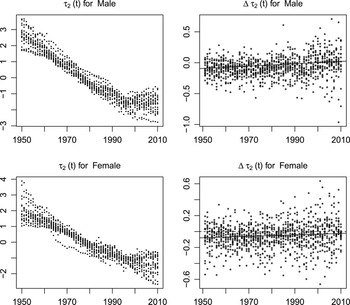
To illustrate, let us consider the case when  $x^* = 70$ (i.e., when the model is fitted to data from age 0 to 70). Figure 2 shows the series of
 $\tau _{2}(t)$ and
 $\Delta \tau _{2}(t)$ that are obtained using data over the age range of
 $x_1 = 0$ to
 $x^* = 70$. It can be observed that the values of
 $\tau _2(t)$ from the 17 populations possess downward trends, but the trends have somewhat slowed down in recent decades. This observation translates to gentle upward trends in
 $\Delta \tau _2(t)$, of which the underlying common gradient
 $\beta$ is the key quantity that we intend to test and estimate. When
 $x^*= 70$, the estimates of
 $\beta$ for male and female are
 $0.00189$ and
 $0.00091$, respectively. For both genders, the
 $p$-values for test of
 $\beta = 0$ against
 $\beta > 0$ are less than 0.00001, suggesting a rejection of the null hypothesis that there is no rotation at any reasonable level of significance. These test results provide strong statistical evidence for the existence of rotation, when considering an age range of
 $[0, 70]$.
Plots of  $\tau _2(t)$ and
 $\Delta \tau _{2}(t)$ for all 17 populations under consideration, based on a calibration window of [1950, 2010] and an age range of
 $x_1 = 0$ to
 $x^* = 70$, males (upper panels) and females (lower panels).

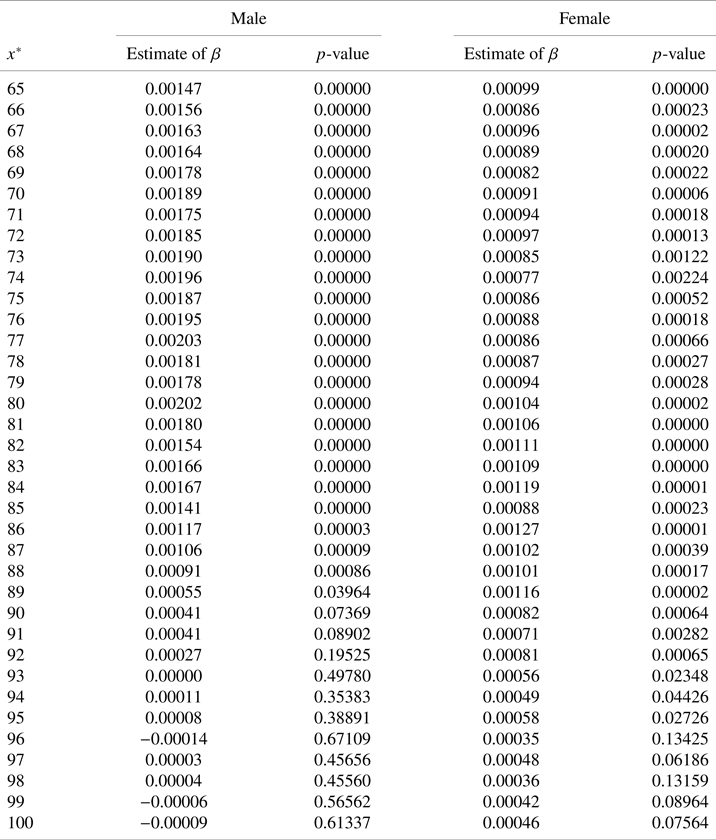
Table 2 reports the test results for other choices of  $x^*$. For all values of
 $x^*$ up to 88 for males and 92 for females, the null hypothesis that there is no rotation is rejected at a 1% level of significance.Footnote 5 These test results suggest that rotation is significant for both genders, when considering all but the very high ages.
Estimates of  $\beta$ and the
 $p$-values for the test of
 $\beta = 0$ against
 $\beta > 0$, based on various choices of
 $x^*$, male and female.

Beyond age 88 for males and 92 for females, the  $p$-values appear to rise with age and they no longer imply, at a 1% level of significance, a rejection of the null hypothesis that there is no rotation. These larger
 $p$-values suggest that when data for the very high ages are included, the statistical evidence for rotation becomes less strong. In other words, the extent of rotation seems to diminish toward extreme ages. This finding is in line with the modeling approach of Li and Gerland [Reference Li and Gerland23], which assumes that rotation starts to diminish at a certain high age. This finding is also incorporated into our extrapolation methods, which we now detail.
4.2. Sensitivity analyses
We now perform two sensitivity analyses. The first sensitivity analysis examines the sensitivity of the ANCOVA test result relative to the beginning and end points of the calibration window, while the second investigates the sensitivity of the ANCOVA test result relative to the number of populations included.
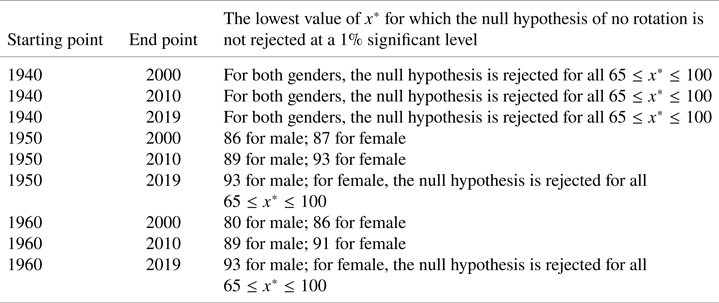
In the first sensitivity analysis, we consider three beginning points (1940, 1950, and 1960) and three end points (2000, 2010, and 2019),Footnote 6 which result in nine different calibration windows. For each of the nine calibration windows, we perform the ANCOVA test for the same collection of 17 populations. The test results are summarized in Table 3, from which the following observations can be made.
Sensitivity of the ANCOVA test result relative to the beginning and end points of the calibration window.

• Rotation is evident for all of the nine calibration windows considered. Specifically, the ANCOVA test is always significant when the upper limit (
$x^*$) of the age range is no greater than 85.• When the starting point of the calibration window is 1940, the extent of rotation indicated by the ANCOVA test is the strongest in the sense that the null hypothesis is rejected for all upper limits of the age range under consideration (
$x^* = 65, 66,\ldots, 100$). The strength may in part be attributed the unusually high mortality at younger ages during and shortly after World War II.


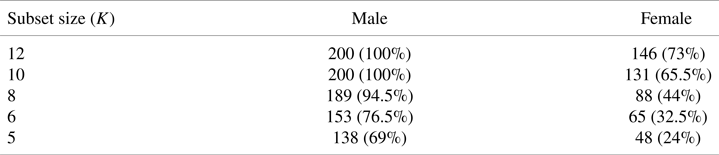
In the second sensitivity analysis, we consider various subsets of the collection of 17 populations. The sizes of these subsets are  $K = 12$, 10, 8, 6, and
 $5$. Performing the ANCOVA test for all possible subsets is extremely computationally demanding. For instance, when the subset size is
 $K = 10$, the number of possible subsets is 19,488. As such, we apply a random sampling procedure in which 200 subsets are chosen randomly for every given
 $K$. To focus on the effect of the number of populations involved, we fix the calibration window to 1950–2010. We also set
 $x^*$ to 65.Footnote 7 To address the aim of this sensitivity analysis, we examine how many of the 200 ANCOVA tests performed for each subset size
 $K$ indicate statistically significant rotation. In particular, we are interested in the relationship between the fraction and the subset size
 $K$.
The result of this sensitivity analysis is tabulated in Table 4. For males, the fraction of the ANCOVA tests that indicate significant rotation remains at 100% when the subset size is reduced to  $K = 10$. However, the fraction decreases as
 $K$ reduces further. A similar pattern is observed for females, but the fraction already drops to lower than 100% when the subset size is
 $K = 12$. The result of this analysis highlights the fact that rotation is a subtle pheonomenon and the need for a joint test that leverage information from a large collection of populations.
Fraction of the 200 ANCOVA tests performed for each subset size  $K$ that indicate significant rotation.

4.3. Comparison with the method of Vékás [Reference Vékás41]
Recently, Vékás [Reference Vékás41] developed a method to test whether rotation of age patterns in mortality improvements is significant. While our proposed test and the test developed by Vékás [Reference Vékás41] have similar objectives, they are fundamentally different from a statistical perspective. First, our proposed test is a joint test, which examines whether rotation is jointly significant among the collection of populations in question; however, the test of Vékás [Reference Vékás41] is an individual test that examines whether rotation is significant for each of the populations in question. Second, our proposed that is parametric, which draws on a parameter in the ANCOVA model (Eq. (15)); in contrast, the test of Vékás [Reference Vékás41] is nonparametric, depending entirely on Spearman's rho and rank correlations.
Using the nonparametric test they developed, Vékás [Reference Vékás41] found that 11 out of 28 populations exhibit significant rotation in mortality decline, whereas 17 do not. Although the results they obtained appear to be somewhat different from ours, the two sets of results are not contradictory to each other when the fundamental differences between the underlying statistical methods are taken into consideration. First and foremost, the test of Vékás [Reference Vékás41] is an individual test whereas our proposed test is a joint test. It is entirely possible that a joint test (for the whole collection of population) suggests significance while individual tests (for individual populations) indicate insignificance for some of the component populations at the same level of significance. Situations like this are commonly encountered in statistical inferences; for example, in a multiple linear regression analysis, a significant F-test result for the overall regression model does not imply that the t-test results for all individual regression coefficients are significant. Second, the test of Vékás [Reference Vékás41] involves advanced ages, including the age group of 100 years and older. However, as previously mentioned, the extent of rotation seems to diminish toward extreme ages and thus including advanced ages in the test may possibly increase the likelihood of not rejecting the null hypothesis that there is no rotation. As a matter of empirical fact, we have demonstrated in Section 4.1 that our test no longer suggests significant rotation at a 1% level of significance if we include ages 89 or above for males and ages 92 or above for females. Finally, because rotation is subtle relative to the variation in mortality improvement rates (changes in log central death rates), it is more difficult for an individual test to detect rotation, compared with a joint test that leverages information from multiple populations. It appears that Vékás [Reference Vékás41] attempted to mitigate this problem by considering grouped data, but the arbitrary age grouping provides no guarantee that the masking effect of the variation in mortality improvement rates is adequately reduced.
5. Extrapolation and forecasting
In our proposed method, forecasts of age-specific central death rates can be obtained by extrapolating  $\tau _1(t)$ and
 $\tau _2(t)$ into the future. As
 $\tau _1(t)$ and
 $\tau _2(t)$ are extrapolated through their respective processes, their values beyond the forecast origin
 $t_n$ progress logically from their values over the calibration window
 $[t_1, t_n]$. This feature differentiates our proposed method from the LLG model, in which the time-varying index
 $k^{\star }(t)$ is obtained by benchmarking against some other life expectancy forecasts.
5.1. Extrapolation of $\tau _1(t)$

Let us first focus on  $\tau _1(t)$. As with the original LC model, we assume that
 $\tau _1(t)$ in our proposed model follows a random walk with drift:
 \begin{equation} \tau_1(t) = d_1 + \tau_1(t-1) + e_1(t), \end{equation}
where  $d_1$ is the drift term, and
 $e_1(t)$ is the time-
 $t$ random innovation. The drift term can be estimated readily as follows:
 $$\hat{d}_1 = \frac{1}{t_n - t_1}\sum_{t = t_1 + 1}^{t_n}\Delta\hat{\tau}_1(t) = \frac{\hat{\tau}_1(t_n) - \hat{\tau}_1(t_1)}{t_n - t_1},$$
where  $\hat {\tau }_1(t_n)$ and
 $\hat {\tau }_1(t_1)$ represent the estimates of
 $\tau _1(t_n)$ and
 $\tau _1(t_1)$ obtained in Section 3.3, respectively.Footnote 8 The central forecast of
 $\tau _1(t)$ for
 $t = t_n + 1, t_n + 2, \ldots$ can be calculated straightforwardly as
 $$\hat{\tau}_1(t) = \hat{d}_1 + \hat{\tau}_1(t - 1).$$
5.2. Extrapolation of $\tau _2(t)$

We then turn to  $\tau _2(t)$. If we assume that rotation does not continue into the future, then it is natural to model the dynamics of
 $\tau _2(t)$ with a random walk with drift, as what we do for the dynamics of
 $\tau _1(t)$:
 \begin{equation} \tau_2(t) = d_2 + \tau_2(t-1) + e_2(t), \end{equation}
where  $e_2(t)$ is the time-
 $t$ random innovation, and
 $d_2$ is the drift term, which can be estimated readily as
 \begin{equation} \hat{d}_2 = \frac{1}{t_n - t_1}\sum_{t = t_1 + 1}^{t_n}\Delta\hat{\tau}_2(t) = \frac{\hat{\tau}_1(t_n) - \hat{\tau}_2(t_1)}{t_n - t_1}, \end{equation}
with  $\hat {\tau }_2(t_n)$ and
 $\hat {\tau }_2(t_1)$ being the estimates of
 $\tau _2(t_n)$ and
 $\tau _2(t_1)$ obtained in Section 3.3, respectively. Accordingly, if there is no rotation beyond the forecast origin, then the central forecast of
 $\tau _2(t)$ for
 $t = t_n + 1, t_n + 2, \ldots$ can be computed as
 \begin{equation} \hat{\tau}_2(t) = \hat{d}_2 + \hat{\tau}_2(t - 1). \end{equation}
To extrapolate the rotation phenomenon into the future, we need a process that captures the upward time trend in  $\Delta \tau _2(t)$. To this end, we incorporate the ANCOVA result described in Section 4.1 into the process specified in Eq. (17) to obtain:
 \begin{equation} \tau_{2}(t) = d_2 + \beta \cdot (t-\bar{t}\,) + \tau_{2}(t-1) + e_{2}(t), \end{equation}
where  $\beta$ is the slope term in the ANCOVA equation (15), and the constant
 $$\bar{t} = \frac{1}{t_n - t_1} \sum_{t = t_1 + 1}^{t_n} t$$
is included to reflect the fact that the value of  $d_2$ is estimated from the values of
 $\Delta \hat {\tau }_2(t)$ over
 $t = t_1 + 1$ to
 $t = t_n$. It can be shown easily that given
 $\beta$, the least square estimate of
 $d_2$ is exactly the same as that shown in Eq. (18) (i.e., the estimate of the drift in random walk for
 $\tau _2(t)$ without the linear trend term). It should be noted that while the value of
 $\beta$ is the same for all of the 17 populations under consideration, the values of
 $\hat {\tau }_2(t)$,
 $t = t_1, \ldots, t_n$ and hence the estimates of
 $d_2$ for different populations are different.
As previously discussed, the test results shown in Table 2 are a reflection of the empirical fact that the extent of rotation tapers off as age  $x$ approaches the maximum attainable age. Hence, beyond a certain threshold age, say
 $x^T$, where
 $x^T < x_n$, the extrapolation of
 $\tau _2(t)$ should be performed in a slightly different manner. In our forecasting work, the threshold age
 $x^T$ is determined such that the null hypothesis of no rotation is rejected at a 1% significance level for all
 $x^* = 65, 66, \ldots, x^T$; that is, we set
 $x^T = 88$ for males and
 $x^T = 92$ for females. As shown in Table 2, the corresponding estimates of
 $\beta$ for males and females are
 $\hat {\beta } = 0.00085$ and
 $\hat {\beta } = 0.00072$, respectively. The extrapolation of
 $\tau _2(t)$ for
 $x\le x^T$ and
 $x> x^T$ is described below.
•
$x_1 \le x\le x^T$For
$x\le x^T$, the central forecast of $\tau _2(t)$ for a given population and gender follows directly from Eq. (20), and can be calculated recursively as follows:
(21)where the initial value of the recursion\begin{equation} \hat{\tau}_2(t) = \min \{ \hat{d_2} + \hat{\beta} \cdot (t- \bar{t}) , 0 \} + \hat{\tau}_2(t-1), \quad t=t_n+1, t_n+2,\ldots, \end{equation}
$\hat {\tau }_2(t_n)$ is the estimate of $\tau _2(t_n)$ obtained in Section 3.3. We bound $\hat {d_2} + \hat {\beta } \cdot (t- \bar {t}\,)$ above by zero, because, as we now explain, rotation should have reached completion when $\hat {\tau }_2(t) = \hat {\tau }_2(t-1)$.
When the extrapolation of
$\tau _2(t)$ begins in year $t = t_n + 1$, $\hat {d_2} + \hat {\beta } \cdot (t- \bar {t}\,)$ and hence $\Delta \hat {\tau }_2(t)$ are negative. As $t$ increases, $\hat {d_2} + \hat {\beta } \cdot (t- \bar {t}\,)$ becomes less negative (since $\hat {\beta }$ is positive), and so does $\Delta \hat {\tau }_2(t)$. This trend results in a continuation of rotation, because, as implied by Eq. (14) and the signs of the estimates of $c(x)$, the projected mortality decline at younger (older) ages would decelerate (accelerate) as $\Delta \hat {\tau }_2(t)$ approaches zero from below. When $\Delta \hat {\tau }_2(t)$ reaches zero, the projected rates of change in $\ln (m(x,t))$ for all ages below the selected threshold age $x^T$ would become $\Delta \hat {\tau }_1(t)$, that is, the baseline rate of change in mortality, and rotation should cease.•
$x^T < x \leq x_n$When
$x > x^T$, rotation may still take place, but, as previously discussed, the pace of reduction is likely to reduce as $x$ becomes higher. Therefore, the extrapolation of $\tau _2(t)$ for this age range should capture the following features: (1) $\Delta \tau _2(t)$ converges to zero as $t$ increases (i.e., the rotation phenomenon in general); (2) the rate of convergence reduces as $x$ increases (i.e., the effect of rotation dampens as $x$ approaches the highest attained age). To this end, we assume that the effect of rotation reduces linearly with age $x$ when $x^T < x < x_n$, and becomes zero when $x = x_n$, where $x_n$ (the upper limit of the age range to which the model is fitted) is 100 in this study. Given these assumptions, we have the following equation for extrapolating $\tau _2(t)$ when $x^T \le x \le x_n$:
(22)for\begin{equation} \hat{\tau}_2(t) = \min \left\{ \hat{d_2} + \hat{\beta} \cdot (t- \bar{t}\,) \cdot\left(\frac{x_n - x}{x_n - x^T}\right) , 0 \right\} + \hat{\tau}_2(t-1), \end{equation}
$t=t_n+1, t_n+2,\ldots$, where ${(x_n - x)}/{(x_n - x^T)}$ is an adjustment factor that captures the linear reduction in the effect of rotation between ages $x^T$ and $x_n$. It is noteworthy that when $x=x_n$, Eq. (22) reduces to Eq. (19),Footnote 9 which implies that rotation ceases when $x$ reaches $x_n$, as what we have assumed.
We remark that the LLG model assumes no rotation for all ages beyond a certain threshold age. Compared with the LLG model, our proposed model seems to provide a smoother phase-out of the effect of rotation over the very high ages.


The extrapolation of  $\tau _2(t)$ formulated in Eqs. (21) and (22) has the following implications on the expected rates of mortality decline. For all ages in the age range
 $[x_1, x_n]$ under consideration, the expected rates of mortality decline (in log scale), defined by
 $$-\Delta \ln m(x,t)={-}\Delta \tau_1(t)-c(x)\Delta \tau_2(t),$$
will converge to a common ultimate value in the long run. The common ultimate value is  $-\hat {d}_1$, the negative of the expected value of
 $\Delta \tau _1(t)$. However, the rates of convergence for different ages are different. For all ages between
 $x_1$ and
 $x^T$, the rate of convergence is
 $|\hat {c}(x)\cdot \hat {\beta }|$, which depends on age through
 $\hat {c}(x)$, the estimate of parameter
 $c(x)$. Then, for
 $x^T < x < x^n$, the rate of convergence is
 $$\left|\hat{c}(x)\cdot\hat{\beta}\left(\frac{x_n - x}{x_n - x^T}\right)\right|,$$
which depends on age through both  $\hat {c}(x)$ and the adjustment factor
 ${(x_n - x)}/{(x_n - x^T)}$ which reduces linearly with age
 $x$. Finally, at age
 $x_n$, the rate of convergence becomes zero, so that it takes infinitely long for the expected rate of mortality decline at age
 $x_n$ to converge to the common ultimate value.
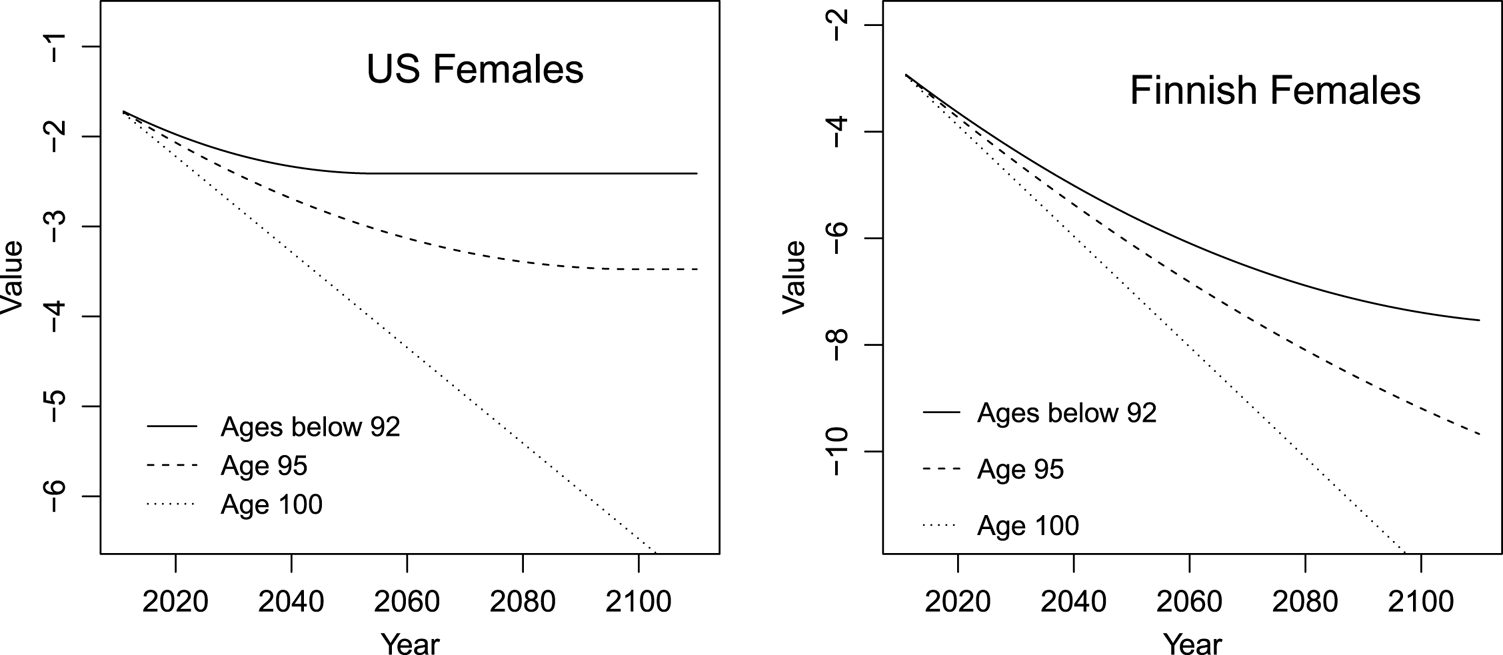
The extrapolation of  $\tau _2(t)$ before and after the threshold age
 $x^T$ is illustrated in Figure 3. Beyond the threshold age
 $x^T$, the extrapolated trajectory of
 $\tau _2(t)$ is less curved, indicating that the effect of rotation becomes lighter as
 $x$ becomes larger than
 $x^T$. For
 $x = x_n$, the extrapolated trajectory of
 $\tau _2(t)$ is a straight line, implying that rotation ceases at age
 $x_n$, as what we have assumed. It is also noteworthy that although all of the 17 populations share a common
 $\beta$ parameter, they may take different amounts of time to complete rotation. From (the solid lines in) Figure 3, we observe that it takes longer for Finnish female population to complete rotation compared with US female population.
An illustration of the extrapolation of  $\tau _2(t)$ for all ages below the threshold age
 $x^T$ and for two ages above
 $x^T$ (
 $x=95, 100$), US females and Finnish females.

5.3. Stochastic forecasts
To produce stochastic forecasts of age-specific log central death rates, we need to make distributional assumptions on  $e_1(t)$ and
 $e_2(t)$. It is assumed that
 $\{e_1(t); t = t_n + 1, t_n + 2, \ldots \}$ and
 $\{e_{2}(t); t = t_n + 1, t_n + 2, \ldots \}$ are sequences of independently and identically distributed zero-mean normal random variables. The variances of
 $e_1(t)$ and
 $e_2(t)$ are
 $\sigma _1^2$ and
 $\sigma _{2}^2$, respectively, and the covariance between
 $e_1(t)$ and
 $e_2(t)$ is
 $\sigma _{1,2}$. In Appendix B, we provide formulas for estimating
 $\sigma _1^2$,
 $\sigma _2^2$, and
 $\sigma _{1,2}$, and explain how prediction intervals and sample paths of future age-specific log central death rates can be produced.
6. Evaluating mortality forecasts and implications
In this section, we present the forecasts of US mortality that are generated from our proposed model. Whenever appropriate, we also compare our forecasts with the LC and/or LLG forecasts. This section is concluded with a brief discussion of the implications of the differences between mortality forecasts generated from our model and the LC and LLG models on the life insurance industry.
6.1. Projected age patterns of mortality decline
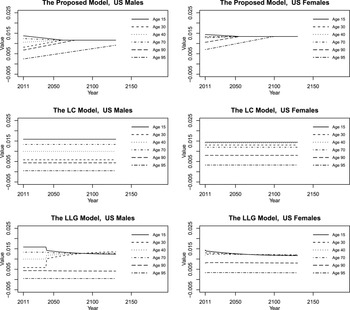
Figure 4 displays the expected age patterns of mortality decline (in log scale) for  $t > t_n = 2010$ implied by our proposed model, the LC model, and the LLG model. They are computed as the expected or inferred valuesFootnote 10 of the following expressions:
• Our proposed model:
$-\Delta \tau _1(t) - c(x)\Delta \tau _2(t)$;• The LC model:
$-b(x)\Delta k(t)$;• The LLG model:
$-b(x,t)\Delta k^{\star }(t)$.


The future age patterns of mortality decline (in log scale) for selected ages implied by our proposed model, the LC model, and the LLG model, US males (left panels) and US females (right panels).

As expected, the LC model yields a constant expected age pattern of mortality decline. In stark contrast, our proposed model leads to an expected age pattern of mortality decline that varies with time. The expected rates of mortality decline for all ages converge to the same ultimate value over the long run; however, the paces of convergence for different ages are not identical. As discussed in Section 5, for ages between  $x_1$ and
 $x^T$, the pace of convergence depends on age
 $x$ through parameter
 $c(x)$, and for ages between
 $x^T$ to
 $x_n$, the pace of convergence depends on age
 $x$ through both parameter
 $c(x)$ and the adjustment factor
 ${(x_n - x)}/{(x_n - x^T)}$. This feature is illustrated in the top panels of Figure 4, from which we observe that for both genders the rate of mortality decline at age 95 converges to the ultimate value notably slower compared to age 90, due primarily to the effect of the adjustment factor (which reduces with age). Note also that depending on the sign on parameter
 $c(x)$, the rates of mortality decline may converge to the ultimate value from above or below.
Similar to our proposed model, the LLG model also results in an expected age pattern of mortality decline that varies with time. However, there are two significant differences. First, for both genders, we observe an abrupt jump in the expected rates of mortality decline produced by the LLG model. According to the specification of the LLG model, such an abrupt jump occurs when rotation begins, at either  $t_n + 1$ if the life expectancy at birth has already reached 80 before the end point
 $t_n$ of the calibration window (the situation that applies to US females), or the time point beyond which the projected life expectancy at birth (implied by the LC model) exceeds 80 years if the life expectancy at birth has not yet reached 80 before
 $t_n$ (the situation that applies to US males). The unintended introduction of such an abrupt jump (which appears to lack demographic intuitions) may be seen as one drawback of the LLG model. Second, even within the age range over which rotation takes full effect,Footnote 11 the expected rates of mortality decline do not converge to a common ultimate value, and as a matter of fact, they begin to diverge after a few decades from the forecast origin. Technically speaking, this outcome arises from the fact that despite the convergence of
 $b(x,t)$ to
 $b_u(x)$ through rotation, the rate of change in
 $k^{\star }(t)$ is generally not a constant as
 $k^{\star }(t)$ is determined exogenously from a LC life expectancy forecast rather than being extrapolated directly through a process with a constant drift.
6.2. Reasonableness of mortality forecasts
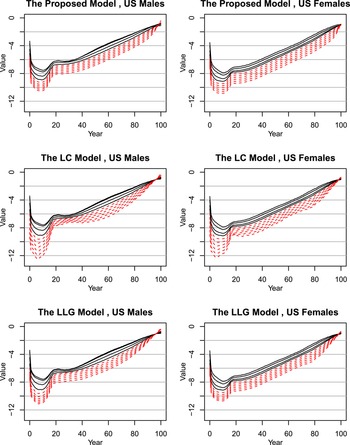
Figure 5 compares the age patterns of projected log central death rates produced by our proposed model, the LC model, and the LLG model, for years 2030, 2050, and so on. To facilitate analyses, historical log central death rates are also shown in the figure. As the LC model implies that infant mortality always declines more rapidly than at other ages, we observe that the LC forecasts of the infant mortality rate over longer horizons are very low. As Li et al. [Reference Li, Lee and Gerland31] pointed out, such low levels of infant mortality may be considered as implausible, as they do not preserve the U-shaped age pattern of mortality that is substantiated by evolutionary theories. Compared with the LC model, our proposed model and the LLG model result in more reasonable age patterns of projected log central death rates.
Projected patterns of  $\ln m(x,t)$ (dashed lines) across age in
 $2030, 2050, \ldots, 2130$, obtained using our proposed model (upper panels), the LC model (middle panels) and the LLG model (lower panels), US males (left panels) and US females (right panels). Note: Fitted values of
 $\ln m(x,t)$ in 1950, 1970, 1990, and 2010 are shown in black solid lines.

Another way to assess the reasonableness of mortality forecasts is to consider the ratio of  $m(0, t)$ to the average of
 $m(x, t)$ over ages
 $x = 15$ to
 $x = 19$. That is,
 \begin{equation} \frac{m(0,t)}{ \bar{m}(15:19,t)}, \end{equation}
where  $\bar {m}(15:19,t)=\frac {1}{5}\sum _{x=15}^{19} m(x,t)$. Li et al. [Reference Li, Lee and Gerland31] argued that this ratio is the most useful in identifying anomalies in the cross-age relationships among projected mortality rates for the following reason:
At infant, child, and young-adult ages, during which the change of death rate is the most complicated, the death rate is known to be highest at age 0 because of the additional risks of birth and congenital problems; the death rate is perhaps the lowest at ages 15–19, older than the age at which additional risks occur from becoming independent. Thus, when the ratio of  $m(0)/\bar {m}(15:19)$ is lower than 1, for example, we would know that it is anomalous because it implies that the risk of death at age 0 is lower than at ages 15–19, a situation we have not observed in history and do not expect to appear in the future.
For all of the three models under consideration, the projected value of this ratio can be expressed in terms of their respective model parameters:
 \begin{align} \text{Our proposed model:} \; \exp[ a(0)-\bar{a}(15:19)+(c(0)-\bar{c}(15:19)) \tau_2(t)], \end{align}
 \begin{align} \text{The LC model:} \; \exp[ a(0)-\bar{a}(15:19)+(b(0)-\bar{b}(15:19)) k(t) ], \end{align}
 \begin{align} \text{The LLG model:} \; \exp[ a(0)-\bar{a}(15:19)+(b(0,t)-\bar{b}(15:19,t))k^{{\star}}(t) ]. \end{align}
In the expressions above, we have  $\bar {a}(15:19)=\frac {1}{5}\sum _{x=15}^{19} a(x)$,
 $\bar {b}(15:19)$,
 $\bar {b}(15:19,t)$, and
 $\bar {c}(15:19)$ are defined in a similar manner.
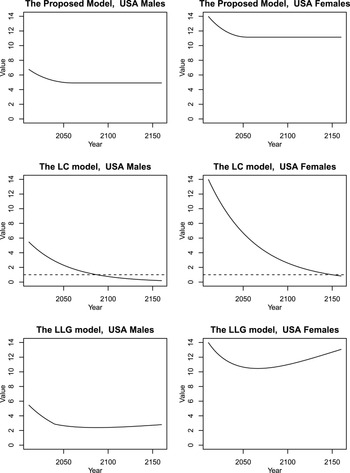
Figure 6 displays the ratios of  $m(0,t)$ to
 $\bar {m}(15:19,t)$, projected from our proposed model, the LC model, and the LLG model. The ratio projected by the LC model tends to zero over the long run, an outcome that would lead to mortality forecasts that are implausible in terms of cross-age relationships. This undesirable outcome can be deduced easily from expression (25), in which
 $b(0)-\bar {b}(15:19)$ is positive and the expected value of
 $k(t)$ reduces indefinitely according to the stochastic process followed by
 $k(t)$.
Ratios of  $m(0, t)$ to the average of
 $m(x, t)$ over ages
 $x = 15$ to
 $x = 19$, for
 $t > t_n = 2010$, produced from our proposed model, the LC model, and the LLG model, US males (left panels) and US females (right panels).

In contrast, the ratio of  $m(0,t)$ to
 $\bar {m}(15:19,t)$ projected by our proposed model tends to a constant that is strictly greater than one, thereby preserving the U-shaped age pattern of mortality that is substantiated by evolutionary theories. This desirable property can be explained using expression (24) along with the following two facts concerning the model parameters: (i) the expected value of
 $\tau _2(t)$ reduces over time and eventually converges to a negative constant when rotation completes (see Figure 3); (ii) both
 $a(0)-\bar {a}(15:19)$ and
 $c(0)-\bar {c}(15:19)$ are positive, with the former being much larger than the latter (see Figure 1).
For the LLG model, the projected ratio of  $m(0,t)$ to
 $\bar {m}(15:19,t)$ first reduces and then increases. This pattern can be explained using expression (26). Specifically, the reduction in the ratio over the first few decades from the forecast origin can be attributed to fact that the implied value of
 $k^{\star }(t)$ decreases (becomes more negative) with time. Noting that
 $b(0,t)-\bar {b}(15:19,t)$ is positive at
 $t = t_n$ (see Figure 1) and that the ultimate values of
 $b(x,t)$ for all ages from 0 to 70 are identical,
 $b(0,t)-\bar {b}(15:19,t)$ reduces from a positive value to zero during the course of rotation. Beyond a certain time point over the forecast horizon, the effect of
 $b(0,t)-\bar {b}(15:19,t)$ outweighs that of
 $k^{\star }(t)$, so that the product of
 $b(0,t)-\bar {b}(15:19,t)$ and
 $k^{\star }(t)$ becomes less negative over time, thereby leading to an increase in the projected ratio of
 $m(0,t)$ to
 $\bar {m}(15:19,t)$. Eventually, as rotation completes,
 $b(0,t)-\bar {b}(15:19,t)$ becomes zero, and hence, the projected ratio of
 $m(0,t)$ to
 $\bar {m}(15:19,t)$ becomes
 $\exp (a(0)-\bar {a}(15:19))$, a constant that is strictly greater than 1.Footnote 12 Although the projected ratio of
 $m(0,t)$ to
 $\bar {m}(15:19,t)$ produced by the LLG model stays desirably above one, the shape of its time trend does not seem to be in line with the steady decreasing trend in the historical ratios of
 $m(0,t)$ to
 $\bar {m}(15:19,t)$ (see Figure 4 in [Reference Li, Lee and Gerland31]).
6.3. Prediction intervals and sample paths
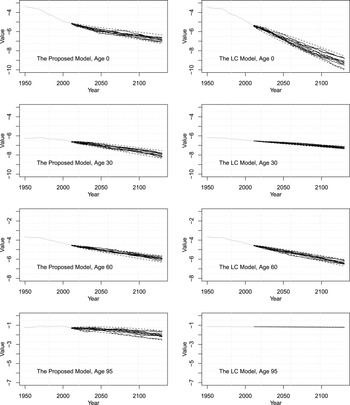
Another advantage of our proposed model over the LLG model is that our proposed model is able to generate stochastic forecasts. The left panels of Figure 7 depict the 95% prediction intervals for the log central death rates at ages 0, 30, 60, and 95, generated using our proposed model that is fitted to data for US males, along with past fitted values. Also shown in the same diagrams are 10 sample paths of log central death rates at each of the selected ages. The impact of rotation on the simulated sample paths is evident. For instance, we observe that the sample paths of  $\ln m(0,t)$ simulated using our proposed model are curved, with a gradient that reduces over time. The right panels of Figure 7 show the corresponding prediction intervals and sample paths that are produced by the LC model fitted to the same data set. As expected, no sign of rotation can be observed from the sample paths simulated using the LC model.
Fitted values (dotted lines), 95% prediction intervals (dashed lines), and 10 sample paths of  $\ln m(x,t)$ (solid lines), for ages 0, 30, 60, and 95, generated using our proposed model (left panels) and the LC model (right panels), US males.

One problem of the LC stochastic forecasts is that the prediction intervals are excessively narrow [Reference Lee and Miller18], especially for high ages. This problem is due in part to the fact that in the LC forecasts, the uncertainty (standard deviation) of log central death rates is proportional to  $b(x)$, which becomes closer to zero as
 $x$ approaches the upper limit of the age range. As shown in Figure 7, this problem is mitigated when our proposed model is used, because in our proposed model, the log central death rates at all ages respond equally to
 $\tau _1(t)$ (which contributes most of the forecast uncertainty).
6.4. Limitations of the LLG model
Despite its empirical advantages over the LC model, the LLG model is subject to a number of limitations. First, while our proposed model is much more data-driven compared with the LLG model, it still requires some subjective inputs, namely, the choice of the collection of populations in the ANCOVA implementation, and the threshold age  $x^T$ beyond which rotation is assumed to taper off. Second, although theoretically speaking our proposed model can be regarded as the LC model with a time-varying
 $b(x)$,
 $$b(x,t) = 1 + \frac{c(x)\tau_2(t)}{\tau_1(t)},$$
in practice the computation of  $b(x,t)$ is not feasible as
 $\tau _1(t)$ equals (or very close to) zero for some
 $t$ within the calibration window
 $[t_1, t_n]$. To visualize the rotation of age-patterns of mortality decline implied by our model, we can use, for example, the plot of
 $-\Delta \tau _1(t) - c(x)\Delta \tau _2(t)$ instead. Third, same as the LLG model, our proposed model results in the same ultimate rates of mortality decline for all ages (up to the threshold age
 $x^T$). This pattern of ultimate rates of mortality decline might be an over-simplification.
6.5. Implications on annuity pricing
We conclude this subsection with an analysis of the implication of the differences between our model and the LC and LLG models on the life insurance industry. Specifically, we consider the fair price (actuarial present value) of a life annuity that pays $1 at the beginning of each year since age 65 as long as the annuitant is alive.
Using a calibration window of 1950–2010 (the baseline calibration window), we obtain the (projected) cohort life tables necessary for pricing purposes. We calculate projected annuity prices in years 2000, 2020, and 2040. For the price in 2000, the cohort life table used is based in part on realized values ( $m(65, 2001), \ldots, m(75, 2010)$) and in part on projected values (
 $m(76, 2011)$ and onwards). For the prices in 2020 and 2040, the cohort life tables used are based entirely on projected values. We consider the US population, and assume a 3% annual rate of return in the calculations.
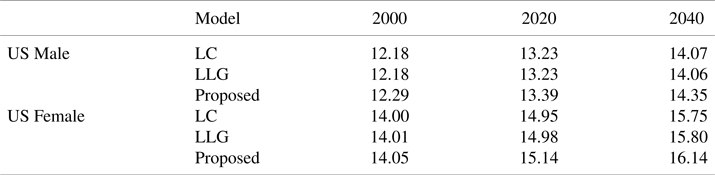
The result of this analysis is presented in Table 5, from which we make the following observations.
Annuity prices in 2000, 2020, and 2040 projected from the LC model, the LLG model, and our proposed model.

1. The annuity prices projected by our proposed model are the highest. This is because our proposed model captures rotation for the entire age range, including the higher ages (at which mortality decline accelerates) that are most relevant to the annuity; however, the LC model does not take rotation into account, and the LLG model does not allow rotation beyond age 70.
2. The annuity price gaps between our proposed model and the other two become wider as we project further into the future.
3. Annuity prices projected from the LC and LLG models are highly similar. This similarly is not unexpected, as the latter model is designed to follow the life expectancy projected by the former model.
7. Conclusion
Although the rotation phenomenon is typically subtle, long-term mortality forecasts may lack reasonableness if it is not adequately taken into account in the forecasting procedure. In this paper, we contribute a method for testing and modeling the rotation phenomenon. The proposed test provides a more rigorous ground for extrapolating the phenomenon into the future, while the proposed model enables us to make the best use historical data in modeling rotation. Compared with the LLG model, in which the time-varying index  $k^{\star }(t)$ has no clear meaning, our proposed model appears to be more intuitive as both of its time-varying indexes
 $\tau _1(t)$ and
 $\tau _2(t)$ can be interpreted readily.
We have applied our proposed testing and modeling methods to data from 17 developed countries. On the basis of the pool of data, the proposed test provides statistical support for the existence of rotation. The proposed model gives a significantly better statistical fit than the LC and LLG models, even if the fact that it uses more parameters is penalized. It also produces long-term mortality forecasts that are more plausible than those generated from the LC model (which ignores rotation), and are comparable to those generated from the LLG model (which takes rotation into account). We have further demonstrated that sample paths and prediction intervals of future mortality rates can be obtained from our proposed model. The ability to produce stochastic forecasts may be seen as an additional advantage of our proposed model over the LLG model.
Since mid-2010s, some developed countries have experienced a deceleration of mortality improvement. This striking phenomenon has recently been studied by researchers in medical science [Reference Hiam, Harrison, McKee and Dorling9,Reference Woolf and Schoomaker46] and actuarial studies [Reference Li and Liu28]. We found that rotation is still significant when the latest data (up to and including 2019) is taken into consideration, but the conclusion may possibly change as mortality experience continues to unfold. Another possible factor that may affect the conclusion of our test is COVID-19. While some researchers in the field of actuarial science treated the effect of COVID-19 on mortality as a “transitory jump” [Reference Chen, Yang and Huang5], others argued that the pandemic may have long-lasting effects on future mortality trends [Reference Cairns, Blake, Kessler and Kessler4,Reference Zhou and Li47]. To more thoroughly examine how these two factors may affect rotation of mortality decline, we recommend revisiting our proposed testing methodology when data for the 2020s becomes available.
We have applied our proposed model to male and female mortality in isolation. This modeling approach may result in an indefinite divergence between the projected trajectories of male and female mortality. Such an outcome is difficult to justify, and appears to be contradictory to the empirical observations made by White [Reference White42] and Wilson [Reference Wilson44]. Following the spirit of the augmented common factor model introduced by Li and Lee [Reference Li and Lee25], we may mitigate this problem is by extending our proposed model to a two-population version as follows:
 \begin{equation} \ln m(x,t,i) = a(x,i) + \tau_{1}(t) + c(x,i)\tau_{2}(t,i) + \epsilon(x,t,i), \end{equation}
for  $i = 1$ (male) and
 $i = 2$ (female), where
 $m(x,t,i)$ represents the central rate of death for age
 $x$, year
 $t$ and subpopulation
 $i$,
 $a(x,i)$ and
 $c(x,i)$ are age-specific parameters for subpopulation
 $i$, and
 $\epsilon (x,t,i)$ is the error term. In this extension,
 $\tau _1(t)$ is a time-varying index that captures the overall decline in mortality, and is shared by both subpopulations being modeled;
 $\tau _2(t,i)$ is a time-varying index that captures rotation, and is specific to subpopulation
 $i$. Processes similar to those specified in Eqs. (16) and (20) can be used to model the dynamics of
 $\tau _1(t)$ and
 $\tau _2(t,i)$. Ignoring the error term
 $\epsilon (x,t,i)$, Eq. (27) implies that the change in the log central death rate for individuals aged
 $x$ in subpopulation
 $i$ between year
 $t - 1$ and
 $t$ is
 $$\Delta \ln m(x,t,i) = \Delta\tau_1(t) + c(x,i)\Delta\tau_2(t,i).$$
When  $t$ tends to infinity, the expected value of
 $\Delta \tau _2(t,i)$ tends to zero, and therefore, the expected rates of mortality decline for both subpopulations are identical, as governed by the drift term in the random walk for modeling the dynamic of
 $\tau _1(t)$. Since both genders are subject to the same long-term rate of mortality decline, their expected trajectories of mortality do not diverge in the long run, thereby satisfying the definition of a “coherent” mortality forecast.
The parameters in Eq. (27) can be estimated using an adapted version of Method 1 in Section 3.2. In more detail, we can first estimate  $a(x, i)$ by setting it to the average of
 $\ln (\tilde {m}(x,t,i))$ over the calibration window (
 $t= t_1$ to
 $t= t_n$), where
 $\tilde {m}(x,t,i)$ denotes the observed value of
 $m(x,t,i)$, and then obtain
 $\tau _{1}(t)$ by averaging
 $\sum _{i=1}^2 w(i)[ \ln (\tilde {m}(x,t,i)) - \hat {a}(x,i)]$ over the age range (
 $x = x_1$ to
 $x = x_n$), where
 $\hat {a}(x,i)$ is the estimate of
 $a(x,i)$ and
 $w(i)$ is the weight on subpopulation
 $i$ which can be set proportional to the size of subpopulation
 $i$. Finally, estimates of
 $c(x,i)$ and
 $\tau _{2}(t,i)$ can be obtained by applying a first-order SVD to the matrix of
 $\ln (\tilde {m}(x,t,i)) - \hat {a}(x,i) - \hat {\tau }_1(t)$, for
 $t = t_1, \ldots, t_n$ and
 $x = x_1 \ldots, x_n$, where
 $\hat {\tau }_1(t)$ denotes the estimate of
 $\tau _1(t)$. A more comprehensive study of the two-population extension of our proposed model is left for future research.
Acknowledgments
J.S.-H. Li acknowledges financial support provided by a Discovery Grant from the Natural Sciences and Engineering Research Council of Canada (RGPIN-2021-02409) and a Centers of Actuarial Excellence research grant from the Society of Actuaries. J.H.T. Kim acknowledges financial support provided by Basic Science Research Program through the National Research Foundation of Korea (NRF, Grant No. 2022R1F1A106357511).
Competing interests
The authors declare no conflict of interest.
Appendix A. Maximization of the log-likelihood function
In this appendix, we explain how the log-likelihood function defined in Eq. (13) can be maximized.
To maximize the log-likelihood function  $l$, we first derive the first-order conditions by differentiating
 $l$ with respect to each of the model parameters. We have
 \begin{align*} & \frac{\partial l}{\partial a(x)} = \sum_{t=t_{1}}^{t_{n}} ( D(x,t)-\widehat{D}(x,t))=0,\\ & \frac{\partial l}{\partial \tau_1(t)} = \sum_{x=x_{1}}^{x_{n}}( D(x,t) - \widehat{D}(x,t))=0,\\ & \frac{\partial l}{\partial c(x)} = \sum_{t=t_{1}}^{t_{n}} ( D(x,t) - \widehat{D}(x,t))\tau_2(t)=0, \\ \end{align*}
and
 $$\frac{\partial l}{\partial \tau_2(t)} = \sum_{x=x_{1}}^{x_{n}}( D(x,t) - \widehat{D}(x,t))c(x)=0,$$
for  $x = x_1, \ldots, x_n$ and
 $t = t_1, \ldots, t_n$, where
 $\widehat {D}(x,t) = E(x,t)\exp (a(x) + \tau _1(t) + c(x)\tau _2(t))$ denotes the expected number of deaths at age
 $x$ and in year
 $t$ implied by our proposed model.
The first-order conditions can be solved using an iterative Newton–Raphson algorithm. In the algorithm, the model parameter estimates in the  $(k+1)$th update are given by
 \begin{align*} & \hat{a}^{(k+1)}(x) = \hat{a}^{(k)}(x) + \frac{\sum_{t=t_{1}}^{t_{n}} ( D(x,t) - \widehat{D}^{(k)}(x,t))}{\sum_{t=t_{1}}^{t_{n}} \widehat{D}^{(k)}(x,t)},\\ & \hat{\tau}_1^{(k+1)}(t) = \hat{\tau}^{(k)}_1(t) +\frac{\sum_{x=x_{1}}^{x_{n}}( D(x,t)-\widehat{D}^{(k)}(x,t))}{\sum_{x=x_{1}}^{x_{n}} \widehat{D}^{(k)}(x,t)},\\ & \hat{c}^{(k+1)}(x) = \hat{c}^{(k)}(x) +\frac{ \sum_{t=t_{1}}^{t_{n}} ( D(x,t) -\widehat{D}^{(k)}(x,t))\hat{\tau}^{(k)}_2(t)}{\sum_{t=t_{1}}^{t_{n}}\widehat{D}^{(k)}(x,t)(\hat{\tau}_2^{(k)}(t))^2}, \end{align*}
and
 $$\hat{\tau}^{(k+1)}_2(t) =\hat{\tau}^{(k)}_2(t) +\frac{\sum_{x=x_{1}}^{x_{n}}( D(x,t)-\widehat{D}^{(k)}(x,t))\hat{c}^{(k+1)}(x)}{\sum_{x=x_{1}}^{x_{n}} \widehat{D}^{(k)}(x,t) \,(\hat{c}^{(k+1)}(x))^2 },$$
for  $x = x_1, \ldots, x_n$ and
 $t = t_1, \ldots, t_n$, where
 $\widehat {D}^{(k)}(x,t) = E(x,t) \exp (\hat {a}(x)^{(k)}+\hat {\tau }^{(k)}_1(t)+\hat {c}^{(k)}(x)\hat {\tau }^{(k)}_2(t))$ denotes the expected number of deaths at age
 $x$ and in year
 $t$ on the basis of the parameter estimates in the
 $k$th update. The algorithm runs over
 $k = 0, 1, \ldots$ until the difference between the values of
 $l$ evaluated at the parameter estimates in the
 $k$th and
 $(k-1)$th iterations becomes sufficiently small, say
 $10^{-6}$.
We use parameter estimates obtained from Method I (least squares and SVD) as the initial values of the algorithm (i.e., the parameter values when  $k=0$). At the end of the
 $(k+1)$th update, where
 $k = 0, 1, \ldots$, we replace
•
$\hat {c}^{(k+1)}(x)$ with $\hat {c}^{(k+1)}(x)/\sqrt {\sum _{x = x_1}^{x_n} (\hat {c}^{(k+1)}(x))^2}$,•
$\hat {\tau }^{(k+1)}_1(t)$ with $\hat {\tau }^{(k+1)}_1(t)-\bar {\tau }^{(k+1)}_1$,•
$\hat {\tau }^{(k+1)}_2(t)$ with $(\hat {\tau }^{(k+1)}_2(t)-\bar {\tau }^{(k+1)}_2)\sqrt {\sum _x (\hat {c}^{(k+1)}(x))^2}$, and•
$\hat {a}^{(k+1)}(x)$ with $\hat {a}^{(k+1)}(x)+\bar {\tau }^{(k+1)}_1+\hat {c}^{(k+1)}(x)\bar {\tau }^{(k+1)}_2$,


where  $\bar {\tau }^{(k+1)}_1$ and
 $\bar {\tau }^{(k+1)}_2$ represent the averages of
 $\hat {\tau }^{(k+1)}_1(t)$ and
 $\hat {\tau }^{(k+1)}_2(t)$ over the calibration window
 $[t_1, t_n]$, respectively. This step ensures that the resulting parameter estimates satisfy the constraints presented in Section 3.1.
Appendix B. Generating confidence intervals and sample paths
To generate stochastic forecasts, we need estimates of  $\sigma _1^2$,
 $\sigma _2^2$, and
 $\sigma _{1,2}$. They can be obtained using the formulas below.
For  $\sigma ^2_1$, we have
 $$\hat{\sigma}_1^2 = \frac{1}{t_n - t_1 }\sum_{t = t_1 + 1}^{t_n}(\hat{\tau}_1(t) - \hat{\tau}_1(t-1) - \hat{d}_1)^2,$$
where  $\hat {\tau }_1(t)$ and
 $\hat {d}_1$ represent the estimates of
 $\tau _1(t)$ and
 $d_1$, respectively.
For  $\sigma _2^2$, we have
 $$\hat{\sigma}_2^2 = \frac{1}{t_n - t_1 }\sum_{t = t_1 + 1}^{t_n} (\hat{\tau}_{2}(t) - \hat{d}_2 - \hat{\beta} (t-{\bar{t} })- \hat{\tau_{2}}(t-1))^2,$$
where  $\hat {\tau }_{2}(t)$,
 $\hat {d}_2$, and
 $\hat {\beta }$ denote the estimates of
 $\tau _{2}(t)$,
 $d_2$, and
 $\beta$, respectively.
For  $\hat {\sigma }_{1,2}$, we have
 $$\hat{\sigma}_{1,2} = \frac{1}{t_n - t_1 }\sum_{t = t_1 + 1}^{t_n} (\hat{\tau}_1(t) - \hat{\tau}_1(t-1) - \hat{d}_1)(\hat{\tau}_{2}(t) - \hat{d}_2 - \hat{\beta} (t-{ \bar{t}})- \hat{\tau_{2}}(t-1)).$$
With  $\hat {\sigma }_1^2$,
 $\hat {\sigma }_2^2$, and
 $\hat {\sigma }_{1,2}$, we obtain
 $$\hat{C} = \left(\begin{array}{cc} \hat{\sigma}^2_1 & \hat{\sigma}_{1,2} \\ \hat{\sigma}_{1,2} & \hat{\sigma}_2^2 \end{array}\right)$$
as an estimate of the variance-covariance matrix for the random vector  $(e_1(t),e_2(t))'$.
We can generate a large number (say  $N$) of sample paths of
 $m(x,t)$ for
 $t = t_n + 1, t_n + 2, \ldots$ using the algorithm below.
1. Simulate realizations of
$(e_1(t),e_2(t))'$ from a bivariate normal distribution with a zero mean vector and a variance-covariance matrix of $\hat {C}$. We use $e^{[i]}_1(t)$ and $e^{[i]}_2(t)$ to represent the simulated values of $e_1(t )$ and $e_2(t)$ in the $i$th iteration, respectively.2. Calculate realizations of
$\tau _1(t)$ for $t = t_n + 1, t_n + 2, \ldots$ with the following equation:
where$$\tau^{[i]}_{1}(t) = \hat{d}_1 + \tau^{[i]}_{1}(t-1) + e^{[i]}_{1}(t),$$
$\tau ^{[i]}_{1}(t)$, for $t = t_n + 1, t_n + 2, \ldots$ , represents the simulated value of $\tau _1(t)$ in the $i$th iteration, and $\tau ^{[i]}_{1}(t_n)$ is set to $\hat {\tau }_1(t_n)$ (the estimate of $\tau _1(t)$ obtained in Section 3.3).3. Calculate realizations of
$\tau _2(t)$ for $t = t_n + 1, t_n + 2, \ldots$ and for ages $x = x_1, \ldots, x_n$ using the following equation:
where$$\tau^{[i]}_{2}(t) = \min \left\{ \hat{d}_2 + \hat{\beta} (t-\bar{t}) \left(\mathbb{I}_{x\leq x^T} + \mathbb{I}_{x > x^T}\left(\frac{x - x^T}{x_n - x^T}\right)\right), 0 \right\}+ \tau^{[i]}_{2}(t-1) + e^{[i]}_{2}(t),$$
$\mathbb {I}_A$ is an indicator function which equals 1 if event $A$ holds true and 0 otherwise, $\tau ^{[i]}_{2}(t)$, for $t = t_n + 1, t_n + 2, \ldots$ , represents the simulated value of $\tau _2(t)$ in the $i$th iteration, and $\tau ^{[i]}_{2}(t_n)$ is set to $\hat {\tau }_2(t_n)$ (the estimate of $\tau _2(t)$ obtained in Section 3.3).4. Calculate a realization of
$m(x, t)$ using the following equation:
where$$m^{[i]}(x,t) = \exp(\hat{a}(x) + \tau^{^{[i]}}_{1}(t) + \hat{c}(x)\tau^{[i]}_{2}(t)),$$
$m^{[i]}(x,t)$ represents the simulated value of $m(x,t)$ in the $i$th iteration.5. Repeat Steps 1 to 5 for
$t = t_n + 1, t_n + 2, \ldots$ to obtain a sample path of $m(x,t)$ over time.6. Repeat Step 5 for
$i = 1, \ldots, N$ to obtain $N$ sample paths of $m(x,t)$ over time.


We can further obtain prediction intervals for future values of  $m(x, t)$. Suppose that we intend to construct 95% prediction intervals for
 $m(x, t)$ at
 $x = x_1, \ldots, x_n$ and
 $t = t_n + 1, t_n + 2, \ldots$, using
 $N = 10{,}000$ simulated sample paths of
 $m(x, t)$. Such prediction intervals can be obtained with the following procedure.
1. For a given age
$x$ and a given year $t$, sort the simulated values of $m(x,t)$, that is, $m^{[1]}(x,t), \ldots, m^{[N]}(x,t)$, from smallest to largest.2. The lower and upper limits of a 95% prediction interval for
$m(x,t)$ can be set to the 250th and 9,750th sorted simulated values of $m(x,t)$, respectively.


Prediction intervals with different coverage probabilities (e.g., 90%, 99%) can be obtained in a similar manner.
Finally, we remark that the sample paths and prediction intervals generated using the methods above do not take the possible randomness in  $\epsilon (x,t)$ (i.e., the error term in the model structure) and the parameter estimates into account. We refer interested readers to Li [Reference Li21] and Liu and Li [Reference Liu and Li33] for methods that enable us to quantify these additional sources of uncertainty.