


1. Introduction
The cyanine dyes are among the oldest and most investigated family of synthetic pigments. Polymethine cyanine dyes are extensively used as photosensitizers in silver halide photography (Sahyun et al. Reference Sahyun, Sharma and Serpone1995; Steiger et al. Reference Steiger, Hediger, Junod, Kuhn and Mobius1980), as mode-locking compounds in laser technology (Ishchenko, Reference Ishchenko1994), and in photovoltaic and solar cells (Ehret et al. Reference Ehret, Stuhl and Spitler2001; Ma et al. Reference Ma, Hua, Wu, Jin, Meng, Zhan and Tian2008). They have also been broadly used in the life sciences and other biologically related disciplines as optical probes of membrane potential (Waggoner, Reference Waggoner1976), organelle stains (Koning et al. Reference Koning, Lum, Williams and Wright1993; Terasaki et al. Reference Terasaki, Song, Wong, Weiss and Chen1984), labels for neuron pathway tracing (Honig & Hume, Reference Honig and Hume1989) and as probes for membrane structure and dynamics (Greenberg & Axelrod, Reference Greenberg and Axelrod1993; Wu et al. Reference Wu, Jacobson and Papahadjopoulos1977). Yet, their popularity has soared in the last two decades due to their applications as fluorescent labels for proteins and nucleic acids in single molecule and other demanding fluorescence microscopy applications. The indocarbocyanines commonly known as Cy3 and Cy5 (Fig. 1) became the fluorophores of choice during the early years of single-molecule spectroscopy primarily due to their remarkable photostability, large absorption cross sections and fluorescence efficiencies, compatibility with common lasers and single-photon counting detectors, and commercial availability as derivatives for covalent labeling of proteins and nucleic acids (Ha, Reference Ha2001; Roy et al. Reference Roy, Hohng and Ha2008). Single-molecule methods are unique in that they provide insights into complex biological processes that are otherwise masked by the asynchronous behavior of the huge number of molecules present in the sample. Representative examples of the many exciting applications of single-molecule spectroscopy that used cyanine dyes include the study of DNA helicases (Ha et al. Reference Ha, Rasnik, Cheng, Babcock, Gauss, Lohman and Chu2002), DNA and RNA four-way junctions (Hohng et al. Reference Hohng, Wilson, Tan, Clegg, Lilley and Ha2004; McKinney et al. Reference McKinney, Tan, Wilson, Nahas, Declais, Clegg, Lilley and Ha2004), kinesin motor proteins (Tomishige et al. Reference Tomishige, Stuurman and Vale2006), ribozyme catalysis (Zhuang et al. Reference Zhuang, Bartley, Babcock, Russell, Ha, Herschlag and Chu2000, Reference Zhuang, Kim, Pereira, Babcock, Walter and Chu2002), the ATPase/synthase motor (Diez et al. Reference Diez, Zimmermann, Borsch, Konig, Schweinberger, Steigmiller, Reuter, Felekyan, Kudryavtsev, Seidel and Graber2004; Yasuda et al. Reference Yasuda, Masaike, Adachi, Noji, Itoh and Kinosita2003), DNA replication (Luo et al. Reference Luo, Wang, Konigsberg and Xie2007), transcription (Kapanidis et al. Reference Kapanidis, Margeat, Laurence, Doose, Ho, Mukhopadhyay, Kortkhonjia, Mekler, Ebright and Weiss2005b, Reference Kapanidis, Margeat, Ho, Kortkhonjia, Weiss and Ebright2006) and translation (Blanchard et al. Reference Blanchard, Gonzalez, Kim, Chu and Puglisi2004; Kim et al. Reference Kim, Puglisi and Chu2007). Most of these examples involve the use of two fluorescent probes, and take advantage of the strong distance-dependence of the Förster resonance energy transfer (FRET) phenomenon as a means to measure molecular distances in single biomolecules. The applications of single-molecule FRET in biochemistry have been reviewed elsewhere (Joo et al. Reference Joo, Balci, Ishitsuka, Buranachai and Ha2008; Zhao & Rueda, Reference Zhao and Rueda2009).
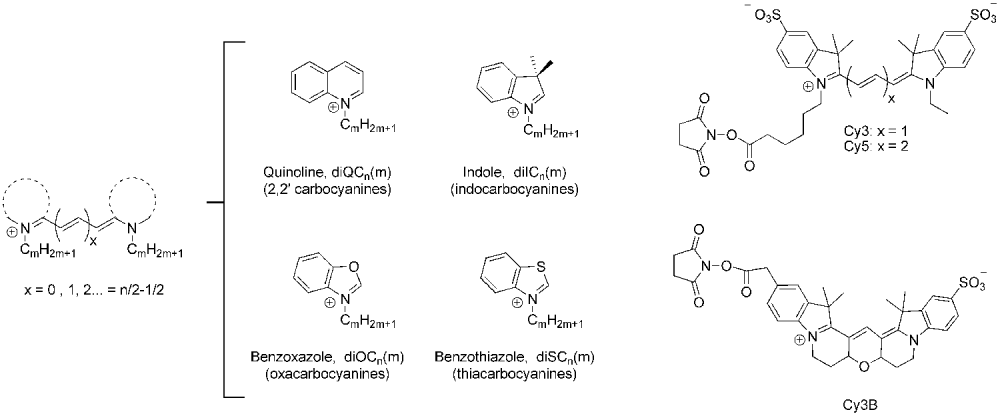
Chemical structure of the cyanine dyes discussed in this work. Left: generic structure of a polymethine cyanine dye-containing alkylic substituents at both nitrogen atoms. The dotted line represents one of the heterocyclic moieties depicted in the middle. Right: succinimidyl ester derivatives of Cy3, Cy5 and Cy3B.
Photoblinking, the transient population of non-fluorescent states, is a major concern in single-molecule spectroscopy because these ‘off’ states can last milliseconds to seconds and therefore interfere with the observation of dynamical processes in these timescales. Blinking does not manifest itself in experiments involving large number of molecules due to its stochastic nature, but can lead to apparent changes in FRET efficiency when a single molecule is observed. Interestingly, the existence of these otherwise detrimental dark states has enabled the recent applications of cyanine dyes as photoswitchable fluorescent probes in super-resolution imaging. One such example is a technique known as stochastic optical reconstruction microscopy (STORM), which relies on the use of individual fluorescent molecules such as Cy5, Cy5.5 and Cy7 that are switched ‘on’ and ‘off’ by lasers of different frequencies (Bates et al. Reference Bates, Huang, Dempsey and Zhuang2007; Rust et al. Reference Rust, Bates and Zhuang2006). The investigation of the nature and properties of transient dark states is also important to understand the mechanisms of photobleaching (the photochemical destruction of the fluorophore), since ‘off’ states are often important intermediates in these irreversible processes.
Understanding the photophysical properties of fluorescent dyes is not only important in single-molecule research but also critical in any quantitative application of fluorescence spectroscopy. One such example is the use of FRET to determine distances in biomolecular systems. The relationship between fluorescence intensity (or lifetime) and inter-dye distance depends on the photophysical and spectral properties of the dyes, as well as their relative orientation. As we will discuss throughout this review, all these factors can potentially depend on the environment of the dyes within the macromolecule, the method used for covalent tethering, and specific interactions between the dyes and the biopolymer. Although this is true, in principle, for all fluorescent probes, as it will be discussed in detail later, these effects are particularly important for the short cyanines such as the popular dye known as Cy3.
This review focuses on the cyanine dyes that are used in biophysical research, usually as fluorescent probes to investigate the structure and dynamics of biopolymers. We will focus on the photophysical properties of the dyes that are relevant for the interpretation of quantitative fluorescence experiments other than the standard applications of cyanine dyes as DNA-staining agents. The applications of symmetric and asymmetric cyanine dyes as DNA-binding compounds for DNA detection and visualization have been reviewed elsewhere (Haugland, Reference Haugland1992; Hirons et al. Reference Hirons, Fawcett and Crissman1994; Netzel et al. Reference Netzel, Nafisi, Zhao, Lenhard and Johnson1995; Rye et al. Reference Rye, Yue, Wemmer, Quesada, Haugland, Mathies and Glazer1992). Section 2 contains a brief discussion on the structure of cyanine dyes and the nomenclature we will follow in this review. Section 3 focuses on the spectroscopic and photophysical properties of these dyes, including the effects of conjugation to biomolecules, quenching and aggregation. A large portion of these studies have been conducted in organic solvents (usually alcohols), and results in aqueous media are discussed whenever available. Section 4 focuses on a series of papers that have investigated the modes of cyanine–DNA interactions and their consequences in FRET spectroscopy. Finally, section 5 contains a discussion on photostability and photoblinking, and the recent applications of cyanine dyes as photoswitchable dyes.
2. Structure and nomenclature
In general terms, cyanine dyes consist of two nitrogen atoms linked by a conjugated polymethine chain containing an odd number of carbon atoms (Mishra et al. Reference Mishra, Behera, Behera, Mishra and Behera2000). Polymethine cyanine dyes are not stable unless they are substituted with heterocyclic groups such as indole, quinoline, benzoxazole or benzothiazole at both ends of the chain (Fig. 1). The symmetric cyanines discussed in this review are named using the generic nomenclature diXCm(n), where n is the number of carbon atoms in the polymethine chain, m is the number of carbon atoms in the primary alkyl substituents attached to the nitrogens, and X is I, Q, O, or S for cyanines containing indole, quinoline, benzoxazole or benzothiazole heterocyclic groups, respectively. Alternatively, the acronyms DTCI, DTDCI and DTTCI have been used to designate the thiacarbocyanines with x=1, 2 and 3, respectively, DOCI, DODCI and DOTCI for the oxacarboyanines, and HICI, HIDCI and HITCI for the indocarbocyanines. In addition, the popular term ‘Cy-dye’ was introduced by Waggoner and co-workers to identify a series of indocarbocyanine dyes for fluorescent labeling of proteins and nucleic acids (Ernst et al. Reference Ernst, Gupta, Mujumdar and Waggoner1989; Southwick et al. Reference Southwick, Ernst, Tauriello, Parker, Mujumdar, Mujumdar, Clever and Waggoner1990). The most popular fluorophores of this series, Cy3 and Cy5, are based on diIC2(3) and diIC2(5), respectively. Unfortunately, the term ‘Cy-dye’ has been widely used in the literature to designate different derivatives of these fluorophores, and therefore they do not represent unique chemical compounds. The main source of uncertainty when using this terminology is whether the phenyl rings are substituted with sulfonate moieties (Fig. 1). Sulfonates are typically present to increase solubility in aqueous buffers and minimize aggregation, so they are found in the commercially available succinimidyl ester and maleimide derivatives (GE Healthcare). In contrast, they are not present in the phosphoramidite derivatives used for solid-state synthesis of oligonucleotides (see Fig. 4a). Because cyanine–biomolecule interactions play a crucial role in determining the photophysical properties of the dye, the knowledge of the exact structure of the dye and the tether used for attachment are vital for the interpretation of any quantitative application involving Cy-dyes.
3. Spectroscopic and photophysical properties
3.1 Spectral properties in solution
Absorption in the visible region of the spectrum is determined by the existence of the delocalized π-electron system and therefore depends on the length of the polymethine chain. Figure 2 shows the absorption and emission spectra of diIC2(3) and diIC2(5) in methanol. The indocarbocyanine diIC2(3) is characterized by an intense absorption band at 546 nm (in ethanol, ∊max=1·33×105/cm/M) and a fluorescence emission spectrum with a maximum at 563 nm (Sims et al. Reference Sims, Waggoner, Wang and Hoffman1974). The presence of heavy atoms at the end groups changes the effective length of the π-electron system and therefore has an impact in the absorption and emission maxima. For example, the thiacarbocyanine diSC2(3) has absorption and emission maxima at 557 and 575 nm, respectively, whereas the oxacarbocyanine diOC2(3) presents a significant shift to the blue (λabsmax=483 nm, λemmax=499 nm). The indodicarbocyanines (x=2, Fig. 1) and indotricarbocyanines (x=3) present intense absorption in the red and in the near infrared, respectively. The absorption and fluorescence spectral properties of diIC2(5) and diIC2(7) in ethanol are λabsmax=639 nm, ∊max=2·00×105/cm/M and λemmax=664 nm for diIC2(5), and λabsmax=741 nm, ∊max=2·40×105/cm/M and λemmax=768 nm for diIC2(7) (Sims et al. Reference Sims, Waggoner, Wang and Hoffman1974). All cyanine dyes exhibit small Stokes shifts and a small bathochromic displacement in absorption (red-shift) with decreasing solvent polarity (Åkesson et al. Reference Åkesson, Sundstrom and Gillbro1985; West & Geddes, Reference West and Geddes1964; Yu et al. Reference Yu, Tolbert, Farrow and Jonas2002). Figure 2 shows the absorption and emission spectra of the dyes diIC2(3) and diIC2(5) in methanol (left) and the succinimidyl ester derivatives of Cy3 and Cy5 in water (right).
Absorption and emission spectra of diIC2(3) (black) and diIC2(5) (grey) in methanol (left, from Du et al. Reference Du, Fuh, Li, Corkan and Lindsey1998) and the succinimidyl ester derivatives of Cy3 (black) and Cy5 (grey) in water (right, measured in the Levitus lab).

3.2 Photophysics of carbocyanines in solution
Cyanines can potentially form different isomers by rotation around the C–C bonds of the polymethine chain. In the ground state, polymethine dyes exist in the all-trans form unless they are sterically hindered (Kolesnikov & Mikhailenko, Reference Kolesnikov and Mikhailenko1987; West et al. Reference West, Pearce and Grum1967; Wheatley, Reference Wheatley1959). Thiacarbocyanines bearing bulky substituents in the polymethine chain have been shown to exist in a ground state equilibrium between the all-trans and the mono-cis isomer that is governed by solvent polarity (Khimenko et al. Reference Khimenko, Chibisov and Gorner1997; West et al. Reference West, Pearce and Grum1967). Isomerization from the excited state (photoisomerization) has been extensively studied and will be discussed in detail below because it represents the most efficient mechanism for excited state deactivation in fluid solution.
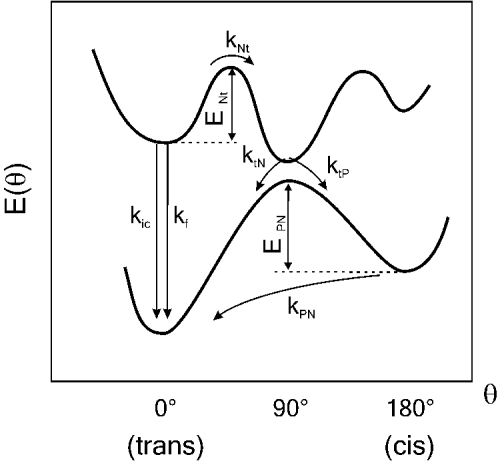
The photophysical behavior of polymethine cyanine dyes is usually described in terms of the potential energy surface depicted in Fig. 3, first proposed by Rulliere (Reference Rulliere1976). Following light absorption, the singlet-excited state deactivates by competing processes, the most efficient being fluorescence emission, internal conversion (ic) and rotation around a C–C bond of the polymethine chain. The relative efficiency of photoisomerization with respect to the other two processes depends on temperature, solvent viscosity and the presence of substituents that might create steric hindrance. Isomerization from the excited singlet state occurs via a non-spectroscopic partially twisted intermediate (t) which deactivates rapidly to the ground state hypersurface to yield the ground state photoisomer (P), or to return to the thermodynamically stable all-trans ground state (N) (Momicchioli et al. Reference Momicchioli, Baraldi and Berthier1988; Murphy et al. Reference Murphy, Sauerwein, Drickamer and Schuster1994; Ponterini & Momicchioli, Reference Ponterini and Momicchioli1991). The photoisomer has been proposed to have a mono cis conformation (Aramendia et al. Reference Aramendia, Negri and Sanroman1994; Chibisov et al. Reference Chibisov, Zakharova and Gorner1996) and exhibits very low-fluorescence quantum yield (Dempster et al. Reference Dempster, Thompson, Morrow and Rankin1972; Dipaolo et al. Reference Dipaolo, Scaffardi, Duchowicz and Bilmes1995; Duchowicz et al. Reference Duchowicz, Scaffardi and Tocho1990; Kuzmin & Darmanyan, Reference Kuzmin and Darmanyan1978). Once formed, the photoisomer undergoes a thermal back-isomerization reaction to yield the thermodynamically stable all-trans isomer (P→N). This process has been investigated extensively and has been found to be a first-order reaction with a rate that depends strongly on solvent viscosity, (Åkesson et al. Reference Åkesson, Sundstrom and Gillbro1985; Aramendia et al. Reference Aramendia, Negri and Sanroman1994; Chibisov et al. Reference Chibisov, Zakharova and Gorner1996; Korppitommola et al. Reference Korppitommola, Hakkarainen, Hukka and Subbi1991; Sundstrom & Gillbro, Reference Sundstrom and Gillbro1982; Waldeck & Fleming, Reference Waldeck and Fleming1981). In contrast, the influence of solvent polarity has been shown to be much less significant (Ponterini & Momicchioli, Reference Ponterini and Momicchioli1991; Sauerwein et al. Reference Sauerwein, Murphy and Schuster1992).
Potential energy diagram for cyanine photoisomerization. The energies of the ground and first singlet excited states are represented as a function of torsion angle (θ). N represents the normal form (trans isomer), t the twisted state, and P the cis photoisomer. k ic and k f represent the internal conversion and radiative fluorescence rates, respectively.
The excited singlet state of the shorter cyanines (n=1) in fluid solution is characterized by a short lifetime (τf) and low-fluorescence quantum yield (φf) due to very efficient rotation about the polymethine C–C bond (Åkesson et al. Reference Åkesson, Sundstrom and Gillbro1985; Korppitommola et al. Reference Korppitommola, Hakkarainen, Hukka and Subbi1991; Sibbett et al. Reference Sibbett, Taylor and Welford1981). The efficiency of fluorescence increases significantly when bond rotation is sterically hindered, as observed when the dyes are dissolved in highly viscous solvents (Åkesson et al. Reference Åkesson, Sundstrom and Gillbro1985; Sundstrom & Gillbro, Reference Sundstrom and Gillbro1982; Waldeck & Fleming, Reference Waldeck and Fleming1981) or bound to biomolecules (Brismar et al. Reference Brismar, Trepte and Ulfhake1995; Gruber et al. Reference Gruber, Hahn, Kada, Riener, Harms, Ahrer, Dax and Knaus2000; Harvey & Levitus, Reference Harvey and Levitus2009). Rotation can also be eliminated altogether by chemical rigidization of the polymethine chain. Several rigidized trimethine cyanine dyes have been patented, but only the compound known as Cy3B (Fig. 1) is commercially available at present (Waggoner & Mujumdar, Reference Waggoner and Mujumdar2000).
The photophysical properties of diIC2(3) were investigated in fluid solutions as early as 1978, and are summarized in Table 1 together with the corresponding values for diIC2(5). The quantum yield of fluorescence and intersystem crossing (ISC) of diIC2(3) in propanol at room temperature were reported as φf=0·028 and φISC<5×10⁻³, respectively (Kuzmin & Darmanyan, Reference Kuzmin and Darmanyan1978). Rotation about a C–C bond is extremely efficient (φNt=0·9) and is responsible for the very short fluorescence lifetime of diIC2(3) (τf=162 ps in ethanol) (Åkesson et al. Reference Åkesson, Sundstrom and Gillbro1985). The lifetime of fluorescence depends strongly on temperature and solvent viscosity because isomerization is an activated process that involves a large molecular motion. Åkesson et al. (Reference Åkesson, Hakkarainen, Laitinen, Helenius, Gillbro, Korppitommola and Sundstrom1991) and Korppitommola et al. (Reference Korppitommola, Hakkarainen, Hukka and Subbi1991) independently determined the activation energies of the N→t process in a series of primary alcohols of increasing viscosity from methanol (E Nt=11·7 kJ/mol), to dodecanol (E Nt=29·9 kJ/mol). A value of 19 kJ/mol was reported for the succinimidyl ester derivative of Cy3 (Cy3-SE) in a buffer solution (Sanborn et al. Reference Sanborn, Connolly, Gurunathan and Levitus2007), and is very similar to the one obtained for diIC2(3) in primary alcohols of similar viscosities (Åkesson et al. Reference Åkesson, Hakkarainen, Laitinen, Helenius, Gillbro, Korppitommola and Sundstrom1991; Korppitommola et al. Reference Korppitommola, Hakkarainen, Hukka and Subbi1991). Bond rotation leads to the formation of the partially twisted intermediate, which deactivates to the cis or trans ground states with a branching ratio (k tP:k tN) of approximately 2:1 for diIC1(3) in ethanol (Chibisov et al. Reference Chibisov, Zakharova, Gorner, Sogulyaev, Mushkalo and Tolmachev1995). The cis isomer reverts thermally to the more stable trans isomer with a first-order rate constant k PN=105/s (propanol and room temperature) and activation energy of E PN=45 kJ/mol (Kuzmin & Darmanyan, Reference Kuzmin and Darmanyan1978). The efficiency of internal conversion of diIC1(3) was estimated as φic=0·06 from the measurement of the fluorescence quantum yield at 77 K, when isomerization is completely suppressed (Chibisov et al. Reference Chibisov, Zakharova, Gorner, Sogulyaev, Mushkalo and Tolmachev1995). A value of φic=0·15 was estimated for Cy3-SE in an aqueous buffer using similar arguments, and by comparison with the fluorescence quantum yield and lifetime reported for the rigidized cyanine Cy3B (Cooper et al. Reference Cooper, Ebner, Briggs, Burrows, Gardner, Richardson and West2004; Sanborn et al. Reference Sanborn, Connolly, Gurunathan and Levitus2007). The limited number of studies on the photophysical properties of the dye Cy3 show that, as expected, its behavior closely resembles that of the well-characterized dye diIC2(3). The triplet state properties of Cy3-SE have been recently investigated in more detail due to the involvement of the triplet state in photophysical phenomena of interest in single-molecule spectroscopy and super-resolution imaging (e.g. photoblinking and photoswitching, see section 5). The quantum yield of triplet formation of Cy3-SE in argon-saturated methanol solution has been determined as φISC=0·03. The triplet state of the trans isomer shows absorption at 580 nm (∊T=40 770/M/cm), and largely overlaps with the ground state absorption of the cis Cy3-SE isomer (Jia et al. Reference Jia, Wan, Xia, Li, Gong and Yang2007). Due to its rigid structure, the fluorescence quantum yield and lifetime of Cy3B are larger than the corresponding values for Cy3. Cooper et al. reported φf=0·67 and τf=2·8 ns in aqueous buffer, while Sanborn et al. reported φf=0·85 and τf=2·7 ns (Cooper et al. Reference Cooper, Ebner, Briggs, Burrows, Gardner, Richardson and West2004; Sanborn et al. Reference Sanborn, Connolly, Gurunathan and Levitus2007). Despite its growing popularity in biophysical research, no other photophysical studies have been reported to date for Cy3B.
Spectroscopic and photophysical parameters of diIC2(3) and diIC2(5) in ethanol (except when noted).

λmaxabs: absorption maximum; ∊max: extinction coefficient at λmaxabs; λmaxem: fluorescence maximum; φf: fluorescence quantum yield; τf (ps): fluorescence lifetime; φISC: quantum yield of inter-system crossing; φic: quantum yield of internal conversion: φNt: quantum yield of bond rotation (N→t); E Nt (kJ/mol): activation energy for the process N→t; k PN: rate constant for back-isomerization (P→N) at room temperature; E PN: activation energy for the process P→N; branching: k tP/k tN.
a Sims et al. (Reference Sims, Waggoner, Wang and Hoffman1974).
b diIC1(3) BF4 (Chibisov et al. Reference Chibisov, Zakharova, Gorner, Sogulyaev, Mushkalo and Tolmachev1995).
c Chibisov et al. (Reference Chibisov, Zakharova and Gorner1996).
d Åkesson et al. (Reference Åkesson, Sundstrom and Gillbro1985).
e In propanol (Kuzmin & Darmanyan, Reference Kuzmin and Darmanyan1978).
f Estimated as 1−φf (77 K) (Chibisov et al. Reference Chibisov, Zakharova, Gorner, Sogulyaev, Mushkalo and Tolmachev1995).
g Estimated as 1−φf (−196°C) (Chibisov et al. Reference Chibisov, Zakharova and Gorner1996).
h Estimated as 1−φf−φic−φISC.
i Aramendia et al. (Reference Aramendia, Negri and Sanroman1994).
Longer lifetimes and moderate quantum yields of fluorescence are observed for the longer cyanines (x>1) in fluid solution. Kuzmin et al. reported φf=0·24 and φISC<5×10⁻³ for diIC2(5) in propanol and indicated that the photoisomer formed by laser photolysis does not fluoresce (Kuzmin & Darmanyan, Reference Kuzmin and Darmanyan1978). Chibisov et al. reported φf (24°C)=0·21, φf (−196°C)=0·89, τf (24°C)=0·98 ns and φISC<3×10⁻³ for diIC1(5) in ethanol (Chibisov et al. Reference Chibisov, Zakharova and Gorner1996). The quantum efficiency of internal conversion can be estimated from the results at low temperatures as φic=0·11. The triplet lifetime (τT=60 μs) and maximum of triplet–triplet absorption (λT=690 nm) were obtained using sensitized excitation (Chibisov et al. Reference Chibisov, Zakharova and Gorner1996, Reference Chibisov, Shvedov and Gorner2001), and similar values have been reported for the dye Cy5-SE (Huang et al. Reference Huang, Ji, Wang, Xia, Koberling, Patting and Erdmann2006). Although the longer cyanines have moderate fluorescence efficiencies, rotation about C–C bonds in the polymethine chain is still usually the most efficient deactivation pathway (the above values give φNt~0·7). Yet, in contrast to what has been observed with the shorter cyanines, only a small fraction of the twisted intermediates decay to the cis isomer (φtP=0·038) (Chibisov et al. Reference Chibisov, Zakharova and Gorner1996). The activation energies for photoisomerization were reported for diIC2(5) in a series of normal alcohols of increasing viscosity (Aramendia et al. Reference Aramendia, Negri and Sanroman1994; Chibisov et al. Reference Chibisov, Zakharova and Gorner1996). Values in ethanol are E Nt=25 kJ/mol and E PN=51 kJ/mol.
The spectroscopic properties of cyanine dyes in aqueous buffers differ to some extent from those reported in normal alcohols. A 5–10 nm hypsochromic shift in absorption and emission spectra was reported for the sulfonate-substituted diIC2(3) and diIC2(5) in phosphate buffer with respect to ethanol (Mujumdar et al. Reference Mujumdar, Ernst, Mujumdar, Lewis and Waggoner1993). The fluorescence quantum yield of these dyes is significantly lower in buffer than ethanol, even when the viscosities of these solvents are practically the same. Sauerwein et al. reported that the dynamics of photoisomerization of diIC1(3) correlates with the molecular mass of the solvent and not necessarily with viscosity, as it is seen when normal alcohols are used (Sauerwein et al. Reference Sauerwein, Murphy and Schuster1992). For instance, the lifetime of this compound in isomeric alcohols is nearly identical even when their viscosities are significantly different. In this work, the authors show a linear dependence between the lifetime of fluorescence of diIC1(3) and the molecular weight of the solvent, including water and several linear and branched alcohols. Therefore, the low-molecular mass of water might facilitate the transfer of momentum and therefore accelerate photoisomerization. In addition, there is no correlation between the measured fluorescence lifetime and solvent polarity. For instance, the lifetime of diIC1(3) in ethanol, 2-pentanone and ethyl acetate are very similar, even when the dielectric constants of these solvents are markedly different (Sauerwein et al. Reference Sauerwein, Murphy and Schuster1992).
3.3 Effects of substitutions
The photophysical effects of substituents and other chemical modifications in polymethine cyanine dyes have been extensively investigated during the last few decades. Substitutions in the polymethine chain generally increase the rate of photoisomerization and decrease the efficiency of fluorescence. Chibisov et al. reported a sixfold increase in φNP and a twofold decrease in φf for diIC1(5) substituted with a methyl group in the meso-position (center of the polymethine chain) (Chibisov et al. Reference Chibisov, Zakharova and Gorner1996). The bromine derivative also shows not only an enhancement in the isomerization rate but also a marked increase in intersystem crossing (φISC=0·2) due to heavy-atom effects. Similar effects have been reported for alkyl-substituted thiacarbocyanines (Khimenko et al. Reference Khimenko, Chibisov and Gorner1997; Sibbett et al. Reference Sibbett, Taylor and Welford1981), which were also found to be less photostable than the unsubstituted compounds (Byers et al. Reference Byers, Gross and Henrichs1976). For substituents at the aromatic rings, the fluorescence quantum yield increases significantly in the presence of strong electron-withdrawing groups such as NO2− and CF3SO2−, and decreases in the presence of electron donating groups like MeO− (Mader et al. Reference Mader, Reiner, Egelhaaf, Fischer and Brock2004; Murphy et al. Reference Murphy, Sauerwein, Drickamer and Schuster1994). Electron-withdrawing groups affect bond localization on the central C–C bonds, hindering the rotation and thus increasing the lifetime of the excited state (Murphy et al. Reference Murphy, Sauerwein, Drickamer and Schuster1994). Substituents at the indolic nitrogens affect the isomerization rates due to steric effects, as bond rotation is retarded by the solvent when the size of the rotating group increases. Åkesson et al. investigated the photophysics of diIC2(3), diIC6(3) and diIC14(3) in normal alcohols, and observed a twofold increase in the fluorescence quantum yield of diIC14(3) with respect to diIC2(3) in methanol (Åkesson et al. Reference Åkesson, Hakkarainen, Laitinen, Helenius, Gillbro, Korppitommola and Sundstrom1991).
3.4 Effects of conjugation to biomolecules
The covalent attachment of fluorescent dyes to biomolecules is typically achieved by the reaction of a sulfhydryl group or a primary amine with the dye maleimide or N-Hydroxysuccinimide ester (NHS-ester), respectively (Fig. 4b, f) (Brinkley, Reference Brinkley1992). The maleimide and NHS-esters of the sulfoindocarbocyanines Cy3 and Cy5 are commercialized by GE Healthcare and contain the reactive groups linked to one of the nitrogen atoms of the dye. The attachment of a bulky substituent such as a protein or a nucleic acid can potentially affect the photophysical properties of the dye considerably due to significant effects in the dynamics of cis–trans isomerization. These effects are much more pronounced for Cy3 than Cy5 due to the lower energy of activation for photoisomerization of the shorter cyanine in the unbound state.
Chemical structures of various Cy3-DNA conjugates (—a–e) and the generic Cy3-protein attachment (f) as discussed in the text. Analogous structures can be obtained with other Cy-dyes.

Binding to biomolecules can dramatically lower the efficiency of photoisomerization, producing as a consequence a large increase in fluorescence quantum yield and lifetime. Brismar et al. reported a fivefold increase in fluorescence lifetime and a small bathochromic shift in fluorescence for Cy3 conjugated to immunoglobulin G (Brismar et al. Reference Brismar, Trepte and Ulfhake1995). Interestingly, Rasnik et al. reported significant variations in the fluorescence quantum yield of Cy3 covalently bound to a helicase depending on the amino acid used for labeling (Rasnik et al. Reference Rasnik, Myong, Cheng, Lohman and Ha2004). In this work, the authors used eight different labeling sites for specific attachment of Cy3, and observed φf values in the range 0·27–0·48 for the helicase–DNA complex. The lowest values were measured for Cy3 bound to two sites in a flexible domain of the protein, while the highest values correspond to residues that are predicted to be closer to the DNA. This remarkable observation indicates that the ability of the dye to isomerize depends dramatically on local interactions between the dye and the protein or the DNA.
Similar variations have been reported for Cy3 bound covalently to DNA. The fluorescence quantum yield and lifetime of Cy3 on DNA depend on the type of linker used for the attachment (Fig. 4), DNA sequence and secondary structure. Surprisingly, the fluorescence quantum yield and lifetime of Cy3 attached to the 3′ or 5′ terminus of an oligonucleotide can be significantly higher than the value measured after the oligo is annealed to its complementary strand to form a helical duplex (Massey et al. Reference Massey, Algar and Krull2006; Sanborn et al. Reference Sanborn, Connolly, Gurunathan and Levitus2007). Variations in photophysical parameters have also been observed for Cy3 attachment at the DNA terminus (Fig. 4a) or internal attachment using a flexible linker (Fig. 4b) (Sabanayagam et al. Reference Sabanayagam, Eid and Meller2005b; Sanborn et al. Reference Sanborn, Connolly, Gurunathan and Levitus2007). The disparity of fluorescence quantum yield values reported for Cy3 in different systems is summarized in Fig. 5, and is a consequence of the crucial effect of local interactions on the dynamics of photoisomerization. Sanborn et al. demonstrated that the fluorescence quantum yield of Cy3 on DNA correlates with the activation energy of bond rotation (N→t) and inversely with the amount of cis isomer formed (Sanborn et al. Reference Sanborn, Connolly, Gurunathan and Levitus2007). Recent studies by Harvey et al. point toward the role of sequence-dependent Cy3–DNA interactions in determining the efficiency of isomerization (see below) (Harvey et al. Reference Harvey, Perez and Levitus2009).
Changes in Cy5 fluorescence quantum yield and lifetime upon covalent attachment are not as dramatic as with Cy3. The attachment of Cy3 to the β subunit of F1-ATPase produces an eightfold increment in quantum yield, while the efficiency of fluorescence of Cy5 bound to the γ-subunit of the same protein is the same as the corresponding value for the Cy5-maleimide (Yasuda et al. Reference Yasuda, Masaike, Adachi, Noji, Itoh and Kinosita2003). Yet, some changes in Cy5 photophysics have been reported. The lifetime of Cy5 increases 1·5-fold when bound to immunoglobulin G (Gruber et al. Reference Gruber, Hahn, Kada, Riener, Harms, Ahrer, Dax and Knaus2000; Schobel et al. Reference Schobel, Egelhaaf, Brecht, Oelkrug and Gauglitz1999), and a ~1·3-fold increase has been reported for Cy5 bound to the protein concanavalin A (Tolosa et al. Reference Tolosa, Malak, Raob and Lakowicz1997). Binding of Cy5 to proteins is usually accompanied by a small (~5 nm) bathochromic shift in fluorescence spectrum (Buschmann et al. Reference Buschmann, Weston and Sauer2003; Schobel et al. Reference Schobel, Egelhaaf, Brecht, Oelkrug and Gauglitz1999). A large hypsochromic shift has been observed for large Cy5:protein labeling ratios and is likely due to the formation of aggregates (see below) (Gruber et al. Reference Gruber, Hahn, Kada, Riener, Harms, Ahrer, Dax and Knaus2000). Buschmann et al. investigated the properties of a series of red-absorbing fluorescent dyes and found that the binding of Cy5-biotin to streptavidin produces a red-shift in both absorption and emission spectra, and an increase in lifetime. The dynamics of isomerization was investigated by fluorescence correlation spectroscopy (FCS), and was found to be slower for the Cy5-biotin/streptavidin complex than for Cy5-biotin (Buschmann et al. Reference Buschmann, Weston and Sauer2003). Comparable results were reported by the same authors for the dye Alexa 647, which is structurally very similar to Cy5 (White et al. Reference White, Li, Marsh, Piper, Leonczek, Nicolaou, Bain, Ying and Klenerman2006), and for Cy5 attached to DNA and IgG (Widengren & Schwille, Reference Widengren and Schwille2000).
3.5 Fluorescence quenching
Fluorescence quenching refers to any process that decreases the fluorescence intensity of the sample, and it is usually a consequence of collisional encounters between the fluorophore in the excited state and the quencher (dynamic quenching) or the formation of non-fluorescent ground state complexes (static quenching) (Valeur, Reference Valeur2001). Several fluorophores are efficiently quenched by nucleobases and amino acids by both static and dynamic mechanisms. Marme et al. investigated the fluorescent quenching mechanisms of organic dyes by tryptophan and determined that the quenching of several red-absorbing dyes by tryptophan is dominated by the formation of non-fluorescent ground state complexes. However, quenching of the red-absorbing cyanines Cy5 and Alexa 647 by amino acids is negligible (Marme et al. Reference Marme, Knemeyer, Sauer and Wolfrum2003). Nucleobases can also quench the fluorescence of a large variety of fluorescent dyes by a combination of static and dynamic mechanisms. Photo-induced electron transfer has been identified as a common quenching mechanism, and its efficiency depends on the redox properties of the fluorescent dye. Rhodamine, Bodipy, oxazine and some coumarin fluorophores are efficiently quenched by guanosine, which has the highest electron donating ability among all nucleobases (Heinlein et al. Reference Heinlein, Knemeyer, Piestert and Sauer2003; Seidel et al. Reference Seidel, Schulz and Sauer1996; Torimura et al. Reference Torimura, Kurata, Yamada, Yokomaku, Kamagata, Kanagawa and Kurane2001). Nucleobase reduction occurs with some coumarins, which are oxidized by photo-induced electron transfer interactions with deoxycytidine and thymidine (Seidel et al. Reference Seidel, Schulz and Sauer1996). The cyanines, Cy5 and Cy3, are not efficiently quenched by any of the nucleobases due to their lower electron accepting tendency (Torimura et al. Reference Torimura, Kurata, Yamada, Yokomaku, Kamagata, Kanagawa and Kurane2001). Instead, the fluorescence quantum yield of cyanines is usually enhanced in the presence of nucleobases with respect to the values measured for the free dye in solution due to the effect of stacking interactions on the isomerization efficiency of the polymethine dye (Harvey & Levitus, Reference Harvey and Levitus2009).
3.6 Aggregation
Cyanine dyes undergo aggregation to form dimers and more complex aggregates in aqueous solutions and in association with biological macromolecules. The aggregates of cyanines exhibit marked changes in the absorption band as compared to the monomers (Herz, Reference Herz1977; Sims et al. Reference Sims, Waggoner, Wang and Hoffman1974; West & Pearce, Reference West and Pearce1965). The dimerization of cyanines in water is usually accompanied by a reduction in the absorption of the main band and the appearance of a new maximum at shorter wavelengths (hypsochromic shift). A red-shifted peak (bathochromic shift) appears at higher concentrations due to higher-order aggregates, and is commonly referred to as the J-band (Jelley, Reference Jelley1936). H-aggregates are formed by molecules stacked in a parallel way (plane-to-plane), while J-aggregates are formed by head-to-tail arrangements (Harrison et al. Reference Harrison, Mateer and Tiddy1996; Mishra et al. Reference Mishra, Behera, Behera, Mishra and Behera2000). For the thiacarbocyanines, the tendency to aggregate has been shown to increase with the length of the polymethine chain (West & Pearce, Reference West and Pearce1965). Aggregated cyanine dyes can have longer excited singlet lifetimes but smaller fluorescence quantum yields than the monomers (Khairutdinov & Serpone, Reference Khairutdinov and Serpone1997). The dimers of several thiacarbocyanines have been shown to be non-fluorescent (Chibisov et al. Reference Chibisov, Zakharova and Gorner1999; Sims et al. Reference Sims, Waggoner, Wang and Hoffman1974). The dicarbocyanine dye diSC2(5) was found to dimerize in the minor groove of DNA at alternating A-T or I-C sequences. Because the DNA structure limits the ability of additional dyes to stack onto the dimer, the aggregate propagates by a cooperative end-to-end mechanism (Armitage, Reference Armitage2005; Hannah & Armitage, Reference Hannah and Armitage2004). The dye Cy5 was proposed to form non-fluorescent dimers when bound to proteins based on the observed hypsochromic shift in UV-vis absorption (Gruber et al. Reference Gruber, Hahn, Kada, Riener, Harms, Ahrer, Dax and Knaus2000).
Room-temperature fluorescence quantum yield of Cy3 in solution and covalently attached to various biopolymers. Cy3-SE PBS: Cy3 succinimidyl ester dissolved in phosphate-buffered saline solution (Sanborn et al. Reference Sanborn, Connolly, Gurunathan and Levitus2007); Cy3-SE glycerol: Cy3 succinimidyl ester dissolved in glycerol (Sanborn et al. Reference Sanborn, Connolly, Gurunathan and Levitus2007); +100 mM dAMP: Cy3 succinimidyl ester dissolved in phosphate-buffered saline solution containing 100 mM dAMP (Harvey & Levitus, Reference Harvey and Levitus2009); ss poly(dA): Cy3 covalently linked to the 5′ end of a 15 base-poly(dA) oligonucleotide (Harvey et al. Reference Harvey, Perez and Levitus2009); ss poly(dT): Cy3 covalently linked to the 5′ end of a 15 base-poly(dT) oligonucleotide (Harvey et al. Reference Harvey, Perez and Levitus2009); ss 5′ mixed and ds 5′ mixed: Cy3 covalently linked to the 5′ end of the oligonucleotide TTCTTCAGTTCAGCC and its corresponding double-stranded structure (Sanborn et al. Reference Sanborn, Connolly, Gurunathan and Levitus2007); ss int-mixed: Cy3 covalently linked to the sequence GGCTGAACTGAAGAG using the chemistry described in Fig. 3b at the site marked in bold face; helicase 1 and helicase 2: Cy3 covalently attached to a helicase using the chemistry shown in Fig. 3f. ‘Helicase 1′ corresponds to a site in the protein located in a flexible domain, and ‘helicase 2′ to residues that are predicted to be in a more restricted environment, closer to the DNA (Rasnik et al. Reference Rasnik, Myong, Cheng, Lohman and Ha2004); F1-ATPase: Cy3 covalently attached to the β-subunit of F1-ATPase using the chemistry shown in figure 3F (Yasuda et al. Reference Yasuda, Masaike, Adachi, Noji, Itoh and Kinosita2003). The typical error in a fluorescence quantum yield determination is of the order of 10%.

4. Cyanine–DNA interactions
4.1 Modes of interaction and their effect on fluorescence properties
Small molecules can interact with DNA in a variety of ways, including intercalation, or binding to the minor or major grooves of the double helix. Intercalation and minor groove binding are the most common modes of non-covalent binding of small molecules to DNA (Armitage, Reference Armitage2005). Intercalators are characterized by planar aromatic structures bearing a positive charge that generally exhibit a G-C preference, while minor groove binders are usually partially flexible and prefer A-T sites (Armitage, Reference Armitage2005; Haq, Reference Haq, Blackburn, Gait, Loakes and Williams2006). Both types of binding modes have been observed with cyanines, as the planar heterocycles favor intercalation while the polymethine carbon chain has enough flexibility to adapt to the curvature of the minor groove. As a consequence, small changes in dye structure or DNA sequence can cause a change from one binding mode to the other (Armitage, Reference Armitage2005). An extensive literature exists on the interactions of asymmetric cyanine dyes with DNA due to their applications to visualize and quantify DNA, and it will not be reviewed here (Haugland, Reference Haugland1992; Hirons et al. Reference Hirons, Fawcett and Crissman1994; Netzel et al. Reference Netzel, Nafisi, Zhao, Lenhard and Johnson1995; Rye et al. Reference Rye, Yue, Wemmer, Quesada, Haugland, Mathies and Glazer1992). The interactions of symmetrical cyanine dyes with DNA have been recently studied by Mikheikin et al. (Reference Mikheikin, Zhuze and Zasedatelev2000) . The cyanines diQC2(3), diSC2(3), diOC2(3) and diIC1(3) were shown to bind as monomers into the minor groove of the DNA with a slight preference toward A-T pairs. The binding constants correlate with the dye hydrophobicity as measured by the octanol/water partition coefficients, and follow the trend diQC2(3)>diSC2(3)>diIC1(3)>diOC2(3). The complex has been proposed to be formed by binding of the cyanine into the DNA minor groove occupying the site of five base pairs. Binding of diIC1(3) to DNA is accompanied by a small bathochromic shift in absorption and a reduction in extinction coefficient of about 25%. At higher dye:DNA ratios, diQC2(3) was shown to form a 2:1 complex involving a minor groove bound dimer (Mikheikin et al. Reference Mikheikin, Zhuze and Zasedatelev2000). The dye diSC2(5) was shown to form dimers that can extend into helical aggregates consisting of dimers aligned in an end-to-end fashion within the minor groove of DNA sequences containing alternating A-T or I-C residues (Armitage, Reference Armitage2005; Seifert et al. Reference Seifert, Connor, Kushon, Wang and Armitage1999).
In biophysical applications, fluorescent dyes are more often used as fluorescent labels attached to specific locations within the biomolecule. Recent experimental and theoretical studies of the dyes Cy3 and Cy5 attached covalently to DNA show that the dye interacts with the biopolymer regardless of the type of tether used for attachment. Lilley and co-workers characterized the structure of fluorescently labeled DNA by NMR, and showed that Cy3 and Cy5 covalently attached to the 5′ terminus of DNA by a 3-carbon linker (Fig. 4a) forms a π-stacked complex with the terminal base pair as shown in Fig. 6 (Iqbal et al. Reference Iqbal, Wang, Thompson, Lilley and Norman2008b; Norman et al. Reference Norman, Grainger, Uhrin and Lilley2000). However, recent single-molecule and ensemble photophysical studies suggest that these interactions are dynamic, and the dyes likely exist in equilibrium between a bound and unbound state. Iqbal et al. studied the efficiency of fluorescence energy transfer between Cy3 and Cy5 terminally attached to the 5′ termini of a DNA duplex using 3-carbon linkers (Iqbal et al. Reference Iqbal, Arslan, Okumus, Wilson, Giraud, Norman, Ha and Lilley2008a). The efficiency of FRET depends on distance and the relative orientation of the dyes (Dale et al. Reference Dale, Eisinger and Blumberg1979). Because the dyes are mostly stacked on the ends of the helix, the observed FRET efficiency depends not only on the length of the helix, but also on the helical periodicity that determines the relative orientation between the donor and acceptor dyes. However, the observed modulation is less than that calculated for a fully rigid interaction between the fluorophores and the terminal bases. This is consistent with the results of Levitus and co-workers, who showed that although the NMR data indicate that most of the Cy3 is stacked on the end of the DNA, a fraction is unstacked and able to rotate rapidly around its linker (Sanborn et al. Reference Sanborn, Connolly, Gurunathan and Levitus2007).
A molecular graphics model of a DNA duplex with Cy3 (top) and Cy5 (bottom) fluorophores attached to the 5′-termini using the tether shown in Fig. 3a (courtesy of Professor D. Lilley). The model was generated from NMR structures of Cy3 and Cy5 attached to duplex DNA, and shows that the dyes are mostly stacked at the end of the helix (Iqbal et al. Reference Iqbal, Wang, Thompson, Lilley and Norman2008b; Norman et al. Reference Norman, Grainger, Uhrin and Lilley2000).

The analysis of time-resolved fluorescence anisotropy data of Cy3 on DNA shows that the dye is mostly interacting with the DNA, not only when attached to the DNA terminus, but also when flexible linkers are used for covalent attachment (Sanborn et al. Reference Sanborn, Connolly, Gurunathan and Levitus2007). This is typically done by incorporating a nucleobase with a reactive amine group during solid-state synthesis of the oligonucleotide, and subsequently coupling it with a succinimidyl ester derivative of the fluorophore. This approach leaves a rather long linker (often misleadingly called a ‘six-carbon linker’) between the dye and the nucleobase, which has enough length and flexibility to allow efficient dye–DNA interactions (Fig. 4b). Time-resolved fluorescence anisotropy is a technique based on the analysis of the polarization of the emitted light that provides a means by which the rotational mobility of the dye can be evaluated in the nanosecond timescale. Samples containing a Cy3 molecule attached covalently to DNA show two distinct times for rotational motion corresponding to fast rotations around the linker (180 ps) and slow motions that correspond to the overall tumbling of the DNA molecule and therefore indicate strong Cy3–DNA interactions. The timescale of this slow motion depends on the length and secondary structure of the DNA (4 ns for a 15 bp dsDNA and 2·5 ns for the single-stranded oligo) (Sanborn et al. Reference Sanborn, Connolly, Gurunathan and Levitus2007). The slow timescale accounts for 82% of the decay for a 5′-modified ds DNA sample, and interestingly, for 88% of the decay for the single-stranded oligo of the same length. This shows that Cy3–DNA interactions are not only due to stacking at the end of the DNA as demonstrated by NMR, but also exist in the single-stranded oligo. Furthermore, 76% of the decay corresponds to slow tumbling motions in the sample containing the internal Cy3 with the six-carbon flexible linker, indicating that only 24% of the Cy3 molecules are in fact free to rotate around the tether. Molecular dynamics simulations of Cy5-labeled dsDNA containing a flexible linker show binding of the dye in two distinct locations of the major groove (Dolghih et al. Reference Dolghih, Roitberg and Krause2007). Recent work by Singh et al. involving energy transfer between Cy5 and a gold nanoparticle provides further evidence of these interactions (Singh et al. Reference Singh, Jennings and Strouse2009). These experiments are consistent with minor groove binding, and show that 37% of the dye is bound to the DNA when a six-carbon linker is used, while this fraction increases to 42% when a three-carbon linker is used instead. Remarkably, in contrast to the studies involving non-sulfonated Cy5 attached to the 3′ terminus of a DNA duplex using 3-carbon linkers, the authors did not observe significant binding when the sulfonated dye is attached to the 5′ terminus of the DNA via a six-carbon linker (Fig. 4e). This might be an effect of both the longer linker and the presence of the sulfonates on the Cy5 molecule.
Levitus and co-workers demonstrated that dye–DNA interactions result in dramatic variations in Cy3 fluorescence quantum yield and lifetime, which can potentially impact FRET and any other quantitative biophysical measurement using Cy3 fluorescence. The fluorescence of Cy3 is enhanced when the dye is dissolved in solutions containing nucleoside monophosphates (Harvey & Levitus, Reference Harvey and Levitus2009). The effect is more pronounced for the purines (dAMP and dGMP) than the pyrimidines (dCMP and dTMP), and is consistent with a model in which Cy3-nucleoside π–π interactions decrease the efficiency of photoisomerization. The same experiments carried out with diIC2(3) show a more pronounced enhancement of fluorescence quantum yield, pointing toward the role of the sulfonate groups present in Cy3 in inhibiting interactions with the DNA bases. The fluorescence quantum yield of Cy3 linked to the 5′ end of oligonucleotides depends strongly on the DNA sequence. Harvey et al. reported the fluorescence properties of more than 20 Cy3-labeled oligos, and found dramatic variations in both the fluorescence quantum yield and lifetime (Harvey et al. Reference Harvey, Perez and Levitus2009). While the maximum enhancement in solution is seen with the purine monophosphates, the fluorescence quantum yield of Cy3 attached to a poly(dA) oligo is among the lowest values measured in this work. This indicates that the nature of the interactions is radically different once the dye is covalently attached to the DNA, and suggests that interactions are likely reduced in oligos containing the dye next to stretches of purines due to their intrinsic rigidity. Therefore, DNA sequence affects the photophysical properties of Cy3 not only because of the different capabilities of the nucleobases to interact with the dye but also likely because DNA sequence determines the degree of flexibility of the polymer and therefore the likelihood that the dye will interact with the bases downstream.
Fluorophore–DNA interactions not only affect the photophysical properties of the dye but also can potentially alter the local structure of the biopolymer they are bound to. For instance, several fluorescent dyes have been found to stabilize the DNA duplex. The melting temperature of a 20 bp DNA increases up to 1·5°C when fluorescent dyes are attached to the 5′ terminus (Moreira et al. Reference Moreira, You, Behlke and Owczarzy2005). Interestingly, Cy3 and Cy5 produce the most pronounced effects, while fluorophores such as carboxytetramethylrhodamine, 6-carboxyfluorescein and hexachlorofluorescein have practically no impact on the melting properties of the duplex. These results are consistent with the structural model of Lilley and co-workers, where the Cy-dyes stack on the terminal bases and virtually function as extra base pairs. The melting temperature of a 15 bp DNA modified internally with a Cy-dye via the common flexible alkane linker is 8–9°C higher than that of the unlabelled duplex, indicating important perturbations of the DNA structure (Fegan et al. Reference Fegan, Shirude and Balasubramanian2008).
4.2 Significance in FRET spectroscopy
Fluorophore–biomolecule interactions can potentially affect FRET measurements in many ways. On the one hand, interactions produce an important uncertainty in the kappa-square factor, which measures the relative orientation between the donor and the acceptor probes (Dale et al. Reference Dale, Eisinger and Blumberg1979; van der Meer, Reference van der Meer2002). This term can take values between 0 and 4 depending on the angles between the donor emission and the acceptor transition dipole moments, and equals 2/3 when both probes undergo unrestricted isotropic motion. The body of evidence presented above suggests that assuming unrestricted motion is generally not justified when Cy-dyes are used for FRET experiments, and therefore an uncertainty in the orientation factor will always exist. The use of flexible linkers not only does not guarantee rotational freedom, but also causes a large uncertainty in donor–acceptor distance. Molecular modeling shows that the flexibility of the six-carbon linker allows Cy5 to bind in two different locations in the major groove of the DNA, which result in an average donor–acceptor distance difference of 8 Å between the two conformers (Dolghih et al. Reference Dolghih, Roitberg and Krause2007).
Some of the problems associated with the use of flexible linkers can be overcome by the use of rigid tethers. Fegan et al. used a rigid ethynyl linker on the C5 methyl group of thymidine to attach Cy3 and Cy5 to a DNA oligonucleotide (Fig. 4c) (Fegan et al. Reference Fegan, Shirude and Balasubramanian2008). As opposed to what is observed when flexible linkers are used, the melting temperature of the duplexes modified with rigid labels was found to be the same as the unlabelled duplexes. This suggests that these rigid modifications do not perturb the structure of the DNA duplex. Ranjit et al. investigated the properties of Cy3 and Cy5 rigidly incorporated into the backbone of the DNA (Fig. 4d) (Ranjit et al. Reference Ranjit, Gurunathan and Levitus2009). These modifications are commercially available and can be incorporated during solid-state synthesis using the corresponding Cy-dye phosphoramidite. Time-resolved fluorescence anisotropy experiments show that local motions are greatly restricted, minimizing the potential for dye–DNA interactions and the uncertainty in dye position that have been reported when flexible linkers are used. Interestingly, this type of modification allows some control over the orientation of the fluorophore. Samples in which the donor (Cy3) and acceptor (Cy5) are located on the same strand and separated by three helical turns present a high FRET efficiency, consistent with a kappa-square value close to the theoretical maximum encountered for co-linear dipoles (κ2=4). The dependence of FRET with orientation was also verified for Cy3 and Cy5 attached to opposite termini of double-stranded DNA by Lilley and co-workers (Iqbal et al. Reference Iqbal, Arslan, Okumus, Wilson, Giraud, Norman, Ha and Lilley2008a). The authors took advantage of their previous structural studies that demonstrated that the dyes are mostly stacked at the ends of the DNA (Iqbal et al. Reference Iqbal, Wang, Thompson, Lilley and Norman2008b; Norman et al. Reference Norman, Grainger, Uhrin and Lilley2000), and therefore predicted that the relative orientation between the donor (Cy3) and acceptor (Cy5) molecules should depend on the length of the helix. The observed FRET efficiency does in fact depend on the length of the helix as well as on the helix periodicity (dsDNA versus RNA/DNA hybrids), but the modulation is less than that calculated for completely rigid attachments because a fraction of the fluorophores exist in unstacked conformations for a fraction of the time.
The measurement of distances from FRET experiments also depends on other photophysical factors, including the donor fluorescence quantum yield, the acceptor extinction coefficient, and the donor fluorescence and acceptor absorption spectra. All these quantities are subject to variations depending on the local environment of the probes, and therefore they need to be evaluated for the particular system under study to avoid artifacts. All these factors are usually grouped under a quantity known as the Förster distance (R 0), which measures the donor–acceptor distance at which the efficiency of FRET is 0·5 (Valeur, Reference Valeur2001). Because this quantity is, in principle, a constant for a given donor–acceptor pair, researchers often rely on values published in the literature for the fluorophores of interest. This, however, can lead to important inaccuracies when cyanine dyes are used as fluorescent probes. For instance, reported R 0 values for the popular Cy3–Cy5 combination on biomolecules range from 47 to 65 Å when the orientation factor is assumed to be 2/3. This important disparity is a consequence of variations in the spectral properties of the dyes and the fluorescence quantum yield of Cy3 in the different molecular environments. Measurements on DNA systems range from 54 to 61 Å (Iqbal et al. Reference Iqbal, Arslan, Okumus, Wilson, Giraud, Norman, Ha and Lilley2008a; Malicka et al. Reference Malicka, Gryczynski, Kusba and Lakowicz2003; Murphy et al. Reference Murphy, Rasnik, Cheng, Lohman and Ha2004; Sabanayagam et al. Reference Sabanayagam, Eid and Meller2005b), and measurements in a variety of proteins from 47 to 65 Å (Bastiaens & Jovin, Reference Bastiaens and Jovin1996; Ishii et al. Reference Ishii, Yoshida, Funatsu, Wazawa and Yanagida1999; Lesoine et al. Reference Lesoine, Holmberg, Maloney, Wang, Novotny and Knauf2006; Rasnik et al. Reference Rasnik, Myong, Cheng, Lohman and Ha2004; Yasuda et al. Reference Yasuda, Masaike, Adachi, Noji, Itoh and Kinosita2003). Therefore, it is clear that relying on a published R 0 can give rise to important errors even for biomolecules that can be regarded as similar at first sight (e.g. nucleic acids).
5. Photostability, photoblinking and photoswitching
5.1 Photostability
Photodegradation, commonly referred to as photobleaching, depletes the fluorophore concentration under prolonged irradiation and represents one of the most serious limitations in fluorescence microscopy. In single-molecule spectroscopy, the efficiency of photobleaching determines the total amount of photons that can be detected for a single fluorophore, and therefore imposes a limitation on the timescales that can be accessed by these measurements. Byers et al. investigated the photooxidation mechanisms of cyanine dyes, and reported quantum yields of photobleaching of less than 10−6 for a number of cyanines in methanol solution, including indo-, thia- and oxacarbocyanines (Byers et al. Reference Byers, Gross and Henrichs1976). Indocarbocyanine dyes are more stable than thia- and oxacarbocyanines (Chen et al. Reference Chen, Sun, Hu, Qian and Zheng1999; Li et al. Reference Li, Chen, Hu, Zheng, Okasaki and Hayami1996; Sims et al. Reference Sims, Waggoner, Wang and Hoffman1974), and increasing the polymethine chain length greatly reduces photostability (Waggoner et al. Reference Waggoner, Ernst, Ballou, Fujimoto and Farkas2009). The triplet state is a key intermediate in the photodegradation of cyanines because it can participate in electron transfer reactions (Chibisov, Reference Chibisov1977) and generate singlet oxygen by energy transfer. Singlet oxygen subsequently attacks the double bonds of the polymethine chain producing a compound that further reacts to form carbonyl products (Byers et al. Reference Byers, Gross and Henrichs1976). Polyfluorination of diSC2(5) has been shown to improve photostability significantly (Renikuntla et al. Reference Renikuntla, Rose, Eldo, Waggoner and Armitage2004).
The recognition of the role of oxygen in limiting the photostability of fluorescent dyes led to the use of oxygen removal enzymatic systems (oxygen scavengers) to increase observation times in fluorescence microscopy applications (Harada et al. Reference Harada, Sakurada, Aoki, Thomas and Yanagida1990; Ishii et al. Reference Ishii, Yoshida, Funatsu, Wazawa and Yanagida1999). The most popular system makes use of a combination of the enzymes glucose oxidase and catalase in the presence of glucose. Glucose oxidase uses molecular oxygen to catalyze the oxidation of glucose into gluconic acid and hydrogen peroxide, which is subsequently decomposed into water and oxygen by the enzyme catalase (Benesch & Benesch, Reference Benesch and Benesch1953; Englander et al. Reference Englander, Calhoun and Englander1987). Overall, one molecule of oxygen is removed per two molecules of glucose that are oxidized. The combination of this system and the reducing agent β-mercaptoethanol has been the gold standard in single-molecule fluorescence spectroscopy until recently (Ha, Reference Ha2001). Glucose oxidase can be replaced by galactose oxidase in experiments using cell extracts containing endogenous glucokinase activities (Crawford et al. Reference Crawford, Hoskins, Friedman, Gelles and Moore2008). In either case, care must be taken because the accumulation of gluconic (or galactonic) acid produces a significant drop in pH, which can potentially affect the photophysical properties of the dye and alter protein stability (Sabanayagam et al. Reference Sabanayagam, Eid and Meller2005a). An alternative enzymatic system that does not alter the pH of the buffer, and removes oxygen more efficiently, involves the use of protocatechuate dioxygenase (Aitken et al. Reference Aitken, Marshall and Pulglisi2008; Crawford et al. Reference Crawford, Hoskins, Friedman, Gelles and Moore2008; Patil & Ballou, Reference Patil and Ballou2000).
5.2 Photoblinking
The removal of oxygen, however, can induce rapid intensity fluctuations (blinking) because of the increased triplet state lifetime in anaerobic conditions. The triplet state lifetimes of cyanine dyes can increase significantly in the absence of oxygen, producing fluctuations in the millisecond timescale (English et al. Reference English, Furube and Barbara2000; Hubner et al. Reference Hubner, Renn, Renge and Wild2001; Kohn et al. Reference Kohn, Hofkens, Gronheid, Van der Auweraer and De Schryver2002; Weston et al. Reference Weston, Carson, DeAro and Buratto1999). Addition of compounds containing thiol groups to the oxygen scavenger system can suppress these fast fluctuations in Cy5, but can induce long-lived dark states (Heilemann et al. Reference Heilemann, Margeat, Kasper, Sauer and Tinnefeld2005; Rasnik et al. Reference Rasnik, McKinney and Ha2006; Sabanayagam et al. Reference Sabanayagam, Eid and Meller2005a). For instance, Sabanayagam et al. characterized the blinking behavior of individual Cy5 molecules coupled covalently to DNA in the presence of an oxygen scavenger system containing β-mercaptoethanol (Sabanayagam et al. Reference Sabanayagam, Eid and Meller2005a). The authors found that under red light illumination, the signal fluctuates between an ‘on’ state with an average lifetime of about 1 s and an ‘off’ state lasting tens of seconds. These long ‘off’ states are reversible, but can be easily mistaken by photobleaching events unless individual molecules are observed for prolonged periods of time. Interestingly, these transient dark states can be recovered by green illumination or by the presence of a donor, even under red illumination. These observations are the basis of the application of these dyes as ‘on–off’ switches, and will be discussed in detail below. Fluctuations in Cy5 fluorescence due to photophysical processes can be easily mistaken by fluctuations in FRET efficiency when this dye is used as an acceptor. The use of alternating laser excitation to excite the donor and acceptor directly is a useful approach to distinguish between dark acceptor states and states with an active acceptor but low FRET efficiency (Kapanidis et al. Reference Kapanidis, Laurence, Lee, Margeat, Kong and Weiss2005a; Sabanayagam et al. Reference Sabanayagam, Eid and Meller2005a). Recent publications in the field of nucleosome dynamics are a dramatic illustration of the potential artifacts that can arise from overlooking photophysical phenomena in single-molecule FRET measurements. Koopmans et al. demonstrated that most of the apparent FRET transitions reported previously by Leuba and co-workers were due to acceptor photophysics, and not to conformational dynamics as originally thought (Koopmans et al. Reference Koopmans, Brehm, Logie, Schmidt and van Noort2007; Tomschik et al. Reference Tomschik, Zheng, van Holde, Zlatanova and Leuba2005). The anti-correlated Cy3–Cy5 transitions observed in these experiments were initially interpreted as fluctuations in FRET efficiency due to changes in donor–acceptor distance in nucleosomes (Tomschik et al. Reference Tomschik, Zheng, van Holde, Zlatanova and Leuba2005), but later proven to be due to Cy5 blinking by means of alternating laser excitation and the use of Trolox as an anti-blinking agent (Koopmans et al. Reference Koopmans, Brehm, Logie, Schmidt and van Noort2007). Figure 7 shows fluorescence intensity traces from individual nucleosomes excited at 515 and 636 nm. When the donor is excited at 514 nm the donor and acceptor fluorescence intensities show anti-correlated changes (top panel) that translate into apparent FRET efficiency variations (bottom). However, Cy5 blinking becomes evident when the acceptor is excited directly using 633 nm excitation. In this case, the same intensity fluctuations are observed, indicating that they are not related to distance-dependent changes in FRET efficiency but to acceptor photoblinking.
Single-molecule FRET traces of individual nucleosomes labeled with a Cy3–Cy5 pair showing artifacts due to Cy5 blinking. The top panel shows the donor (green) and acceptor (red) intensities detected with 514 nm excitation. The middle panel shows the intensities measured with 636 nm excitation, providing evidence of acceptor blinking. The calculated FRET efficiency fluctuates between two values (bottom panel), which can be misinterpreted as nucleosome dynamics when only 514 nm excitation is used. Reproduced with permission from Koopmans et al. (Reference Koopmans, Brehm, Logie, Schmidt and van Noort2007) . Copyright © 2007, Springer.

The quest to find the ideal anti-fading formula that does not induce blinking has been dominated by a rather empirical trial and error approach until recently. A variety of triplet quenchers and anti-oxidants have been investigated with varied success. Grunwell et al. tested several small-molecule compounds, including imidazole, β-mercaptoethanol, Trolox and propyl gallate. Trolox and propyl gallate were found to dramatically increase the photostability of Cy5 (Grunwell et al. Reference Grunwell, Glass, Lacoste, Deniz, Chemla and Schultz2001). A combination of propyl gallate and ascorbic acid has also proved to be effective with rhodamine 6 G (Widengren et al. Reference Widengren, Chmyrov, Eggeling, Lofdahl and Seidel2007). Rasnik et al. investigated the use of Trolox to eliminate millisecond timescale fluctuations of Cy5 caused by removal of oxygen when enzymatic oxygen-scavenging systems are used. The authors concluded that compounds containing thiol groups (β-mercaptoethanol and l-glutathione) are efficient triplet state quenchers but cause slow blinking of Cy5, while antioxidants like propyl galate and ascorbic acid do not cause blinking but do not quench triplet states efficiently. In contrast, Trolox was the only compound to quench the triplet states of Cy5 and Alexa647 without inducing slow blinking (Rasnik et al. Reference Rasnik, McKinney and Ha2006). Dave et al. investigated the use of mercaptoethylamine, cyclooctatetraene, 4-nitrobenzyl alcohol and 1,4-diazabicyclo[2.2.2]octane in addition to some of the systems mentioned before, and found that their effectiveness depends strongly on the molecular environment of the dye. For instance, while Trolox improves the photostability of Cy5 in DNA systems, it actually reduces the ‘on’ time of the dye bound to tRNA molecules within the ribosome (Dave et al. Reference Dave, Terry, Munro and Blanchard2009).
More recently, Tinnefeld and co-workers presented a more rational approach to the problem of improving photostability and reducing blinking. The authors reasoned that the key to minimize photobleaching and blinking is to recover reactive intermediates (triplet states and photoionized species) quickly, and proposed the use of mixtures of reducing and oxidizing agents (Vogelsang et al. Reference Vogelsang, Kasper, Steinhauer, Person, Heilemann, Sauer and Tinnefeld2008). Triplet quenching by electron transfer produces radical anionic or cationic dye molecules, which need to be reoxidized or reduced to recover the singlet ground state. Ionized dyes can also be formed by other photo-induced electron transfer reactions, and represent important intermediates in photobleaching pathways. Therefore, the combination of both a reducing and an oxidizing agent allows the ground state to be recovered efficiently. This strategy has been elegantly demonstrated with several fluorophores, including the cyanines Cy5, Alexa 647 and Cy3B. Because of its general approach, the method is not limited to a particular chemical family of compounds, but is efficient for other fluorophores such as MR121 (an oxazine derivative), ATTO647N (a carbopyronine) and the rhodamines ATTO565 and Alexa 532. The photostability of all these dyes improves significantly in the presence of 1 mM methyl viologen (MV, and oxidant) and 1 mM ascorbic acid (AA, a reducing agent). For Cy5, the detected number of photons in PBS buffer after the removal of oxygen is below 1000 and increases to about 6×10⁵ in the presence of these two compounds. Importantly, this increase in photostability is also accompanied by a dramatic reduction in blinking. Figure 8 shows single-molecule fluorescence intensity traces of Cy5-labeled DNA in an aqueous buffer after oxygen removal in the presence of 1 mM AA (panel A) and 1 mM of both AA and MV (panel B). The top traces show an expanded view (1 ms resolution) of the bottom traces (10 ms resolution). The autocorrelation decays (right) demonstrate that the millisecond-timescale fluctuations observed in the presence of AA are only removed when MV is added to the buffer. Results with MV are only analogous to the results observed with AA (not shown). Interestingly, the same lab recently demonstrated that the effectiveness of the popular antiblinking and antibleaching reagent Trolox is due to the same principles outlined above (Cordes et al. Reference Cordes, Vogelsang and Tinnefeld2009). A quinone derivative of Trolox is formed when the compound is slowly dissolved in aerated buffers, and acts as an oxidant in conjunction with Trolox, a reducing agent. Therefore, Trolox solutions contain the combination of reducing and oxidizing power required to quickly quench photo-induced cationic and anionic species to their singlet ground state.
Single-molecule fluorescence traces of Cy5-labeled DNA immobilized on a coverslip in aqueous buffer containing an enzymatic oxygen scavenging system. (a) In the presence of 1 mM ascorbic acid and (b) in the presence of 1 mM ascorbic acid and 1 mM methyl viologen. In each case the bottom panel represents the data binned with 10 ms resolution, and the top trace a magnified portion binned with 1 ms resolution. Fluctuations due to blinking are evident in (a) and absent in (b). The autocorrelation decays in the inset provide further evidence of the presence and removal of fluorescence fluctuations due to blinking. Reproduced with permission from Vogelsang et al. (Reference Vogelsang, Kasper, Steinhauer, Person, Heilemann, Sauer and Tinnefeld2008), Copyright Wiley-VCH Verlag GmbH & Co. KGaA.

Although applying a combination of reductant and oxidant systems has proved useful for a variety of fluorophores, dyes with large high electron affinities will require strong oxidants to re-oxidize the reduced dye. This is in fact the case of ATTO 655 (an oxazine), which shows blinking in the presence of MV and AA in conditions where blinking is suppressed for most other fluorophores (Vogelsang et al. Reference Vogelsang, Cordes and Tinnefeld2009). Similar results were recently obtained with a water-soluble perylene diimide (Cordes et al. Reference Cordes, Vogelsang, Anaya, Spagnuolo, Gietl, Summerer, Herrmann, Mullen and Tinnefeld2010).
5.3 Photoswitching
The term ‘photoswitching’ refers to the reversible light-induced switching between a fluorescent (‘on’) and non-fluorescent (‘off’) state of a molecule. Reversible photoswitchable cyanines, including Cy5 and Alexa 647, are extensively used in super-resolution microscopy methods such as stochastic optical reconstruction microscopy (STORM). While the center of the image produced by a single molecule can be determined within 1·5 nm (Yildiz et al. Reference Yildiz, Forkey, McKinney, Ha, Goldman and Selvin2003), the large number of molecules that are imaged in a biological sample makes this type of localization impossible. The key concept in STORM is to use photoswitchable probes to avoid collecting the fluorescence image of all molecules simultaneously. Because only a small subset of fluorescent molecules is activated at the time, the center of each individual molecule can be localized during a particular imaging cycle. This process is repeated numerous times until the position of all molecules is obtained so that the STORM fluorescence image can be reconstructed with nanometer accuracy (Bates et al. Reference Bates, Huang, Dempsey and Zhuang2007; Rust et al. Reference Rust, Bates and Zhuang2006).
Red emitting cyanine dyes such as Cy5, Alexa 647, Cy5·5 and Cy7 can act as photoswitches by themselves, or in the presence of an activator fluorophore nearby. Tinnefeld and co-workers demonstrated that the dye Cy5 can be recovered from its dark state by irradiation with light of 337, 488 or 532 nm (Heilemann et al. Reference Heilemann, Margeat, Kasper, Sauer and Tinnefeld2005). As a proof of principle, the authors showed that the fluorescence of a Cy5 molecule bound to DNA could be switched ‘on’ and ‘off’ about 100 times by applying alternating excitation at 633 and 488 nm. Similar findings were reported independently by Zhuang and co-workers using continuous 638 nm excitation to probe the fluorescence state of Cy5, and alternating 532 nm excitation to switch the molecule back to the fluorescent state (Bates et al. Reference Bates, Blosser and Zhuang2005). The rate constants of switching from ‘on’ to ‘off’ and ‘off’ to ‘on’ are linear with laser intensity, and the presence of a Cy3 molecule nearby causes a dramatic enhancement of conversion to the fluorescent state (Bates et al. Reference Bates, Blosser and Zhuang2005). The influence of green excitation and donor proximity in the blinking properties of Cy5 was also noted by Meller and co-workers (Sabanayagam et al. Reference Sabanayagam, Eid and Meller2005a). These secondary fluorophores are known as activators, and allow the photoconversion to be carried out at much lower laser powers. Covalent heterodimers prepared from the Cy3-succinimidyl ester and the Cy5 hydrazide were also shown to behave as reversible photoswitches (Conley et al. Reference Conley, Biteen and Moerner2008). Various dyes, including Alexa405, Cy2, TMR and Cy3, have been shown to act as activators when paired with Cy5 (Bates et al. Reference Bates, Huang, Dempsey and Zhuang2007). In all cases, Cy5 was switched to the dark state with a red laser, and the activation back to the fluorescent state was achieved by excitation with a wavelength that corresponds to the absorption band of the activator chromophore (Fig. 9). This observation led to the development of multicolor STORM, where different populations of photoswitches containing different activators can be switched using lasers of different wavelengths. Two-dimensional, three-dimensional and multicolored images of nanoscopic structures in cells have been obtained using this technique (Bates et al. Reference Bates, Huang, Dempsey and Zhuang2007; Huang et al. Reference Huang, Jones, Brandenburg and Zhuang2008a, Reference Huang, Wang, Bates and Zhuangb).
Photo-switchable probes using cyanine dyes. (a) Cy3 (activator) and Cy5, Cy5.5 and Cy7 as reporters. The 532 nm pulses that activate the reporter molecules are shown in green on the top panel. The dark yellow, red and brown lines show the fluorescence time traces of the reporter dye under 657 nm continuous excitation. (b) Cy5 activated by spectrally distinct activators. Bottom: Cy5 traces under continuous red laser excitation for probes using three different activators: Alexa 405 (magenta), Cy3 (green) and Cy2 (blue). The top panel shows the 405, 457 and 532 nm activation pulses that correspond to the absorption bands of the activators. Adapted from Bates et al. (Reference Bates, Huang, Dempsey and Zhuang2007). Reproduced with permission.

The restoration of absorption and fluorescence in all these cases depends critically on the absence of oxygen and the presence of a sulfur-containing triplet quencher-like β-mercaptoethanol (Bates et al. Reference Bates, Blosser and Zhuang2005; Heilemann et al. Reference Heilemann, Margeat, Kasper, Sauer and Tinnefeld2005). The rate constant for the transitions to the dark state does not depend on solvent viscosity, ruling out cis–trans isomerization as a possible mechanism for photoswitching. Different mechanisms have been speculated for the photoswitching mechanism of Cy5 and the nature of the dark state. Bates et al. suggested that the triplet state was an intermediate in the formation of the dark state based on the linear dependence of the ‘off’ rate with potassium iodide concentration (Bates et al. Reference Bates, Blosser and Zhuang2005). However, Heilemann et al. concluded that the triplet state is not involved in the formation of the switchable state based on the switching efficiency dependence on oxygen and triplet state quencher concentrations (Heilemann et al. Reference Heilemann, Margeat, Kasper, Sauer and Tinnefeld2005). Sauer and co-workers were the first to suggest that the switching mechanism involves the reversible conjugation of the thiol-containing compound to a double bond in the polymethine chain (Heilemann et al. Reference Heilemann, Dedecker, Hofkens and Sauer2009). This was recently verified by Zhuang and co-workers using a variety of chemical methods (Dempsey et al. Reference Dempsey, Bates, Kowtoniuk, Liu, Tsien and Zhuang2009). The formation of a Cy5-β-mercaptoethanol adduct after red illumination is consistent with mass spectra analysis, and results suggests that the second carbon in the polymethine chain is the most plausible site of attachment. The disruption in the π-electron system is then responsible for the loss of fluorescence. Based on these findings, the most plausible mechanism for photoswitching involves a photochemical reaction between a double bond in the cyanine polymethine chain and a thiyl radical. The involvement of the radical species is consistent with the fact that the radical quencher isoascorbate reduces the switching rate to the dark state (Dempsey et al. Reference Dempsey, Bates, Kowtoniuk, Liu, Tsien and Zhuang2009).
6. Concluding remarks
The popularity of cyanine dyes as fluorescent probes in biophysical research has steeply risen in the last decade thanks to advances in single-molecule methods and the development of super-resolution microscopies. Technical developments increasingly allow researchers to carry out experiments with better sensitivity, improving the quantitative precision that can be achieved in these measurements. An interesting consequence of these technical advances is the growing interest in the biophysical community in characterizing and understanding the photophysical behavior of these probes. On one hand, the understanding of the nature and the dynamics of non-fluorescent states is crucial to characterize and find ways to improve photoblinking and photobleaching in measurements involving one or a few molecules. The role of buffer composition, and in particular the presence of thiol-containing molecules, was early identified as an important variable in the analysis of the blinking behavior of red-absorbing cyanines such as Cy5. Although most of the initial effort was directed toward finding conditions that would eliminate blinking in these molecules, it later became apparent that the existence of these long-lived dark states could be taken advantage of to construct photo-switchable probes. These probes are the basis of a novel super resolution imaging technique known as STORM.
In addition, the characterization of the photophysical behavior of fluorescent probes has proven to be critical for any quantitative study involving fluorescence, and in particular for the analysis of FRET experiments. There is extensive evidence that the fluorescence quantum yield and lifetime of cyanine dyes depends strongly on the molecular environment in which the probe is located, which determines the efficiency for cis–trans photoisomerization and therefore the lifetime of the singlet excited state. The photophysical properties of the dye Cy3 attached covalently to DNA have been shown to depend on the type of linker used for conjugation, DNA sequence and DNA secondary structure. Interactions with proteins are also important, as evidenced by studies that show that the efficiency of fluorescence of Cy3 linked to different cystein residues within the same protein can vary as much as 70%. Effects with Cy5 are not as significant, but still easily detectable. These factors have a considerable effect on the Förster distance of donor–acceptor FRET pairs involving cyanines, in particular when the shorter dye Cy3 is used as a donor, and should be evaluated carefully in any quantitative biophysical study.
The above discussion is somewhat unique to cyanine dyes due to their ability to isomerize from the first excited state. However, the photophysical properties of virtually all fluorophores are subject to some type of environment-related effect. The fluorescence quantum yield of fluorescein depends strongly on pH (Seybold et al. Reference Seybold, Gouterma and Callis1969), many coumarines, rhodamines, Alexa fluorophores, ATTO dyes and Bodipy derivaties are efficiently quenched by natural amino acids and nucleobases (Chen et al. Reference Chen, Ahsan, Santiago-Berrios, Abruña and Webb2010; Marme et al. Reference Marme, Knemeyer, Sauer and Wolfrum2003; Seidel et al. Reference Seidel, Schulz and Sauer1996; Torimura et al. Reference Torimura, Kurata, Yamada, Yokomaku, Kamagata, Kanagawa and Kurane2001), and the spectral and fluorescent properties of many dyes depend on solvent polarity (Sackett & Wolff, Reference Sackett and Wolff1987; Turner & Brand, Reference Turner and Brand1968). Therefore, considering photophysical effects in biophysical research involving fluorescent probes is relevant in general, and sometimes even crucial.
7. Acknowledgements
The studies discussed in this review from the Levitus lab were supported by startup funds from Arizona State University and an NSF-CAREER grant. We thank Su Lin for help with the time-resolved spectroscopic measurements, and the following graduate and undergraduate students for their contributions to this research: Matthew Sanborn, Brian Connolly, Billie Jo Harvey, Kaushik Gurunathan, Claudia Perez and Priscilla Luna.



