





Introduction
Brassica napus is the most important cold-temperate oilseed crop, but its development is highly sensitive to weather variation, leading to changes in both yield and seed quality. In different growing regions, it has been shown that temperature variation at different growth stages can be associated with yield instability. These include seed sets in central Europe and South America (Weymann et al., Reference Weymann, Böttcher, Sieling and Kage2015; Massuia de Almeida et al., Reference Massuia de Almeida, Avice, Morvan-Bertrand, Wagner, González-Centeno, Teissedre, Bessoule, Le Guédard, Kim, Mollier and Brunel-Muguet2021; Verdejo and Calderini, Reference Verdejo and Calderini2025), during which time lower temperatures lead to larger seeds and an extension of the grain filling process. However, organogenesis of flowers and ovules is also sensitive to temperature, and changes in the environment during flowering in Canada and Australia (Kutcher et al., Reference Kutcher, Warland and Brandt2010; Kirkegaard et al., Reference Kirkegaard, Lilley, Bril, Ware and Walela2018; Chen et al., Reference Chen, Stefanova, Siddique and Cowling2020) and winter chilling intensity of flower buds in the United Kingdom and China (He et al., Reference He, Revell, Leng and Feng2017; Brown et al., Reference Brown, Beeby and Penfield2019) also affect yields. Common to all these studies is the finding that conditions during flower development, flowering and early seed set have the strongest yield effects across different environments (Secchi et al., Reference Secchi, Fernandez, Stamm, Durrett, Vara Prasad, Messina and Ciampitti2023). However, temperature variation early in development can also have indirect impacts on the environmental conditions during later growth stages through delay or acceleration of plant development, and thus it is necessary to distinguish direct and indirect effects. Variation in study outcomes most likely stems from the varying yield-limiting factors in different cropping systems and the varying frequency of more extreme weather at different times of year in different growing regions.
In perennial species, winter chilling is required to break dormancy in flower buds. Effects of chilling intensity variation on yields have long been recognized in perennial fruit crops where low winter chill can result in wide-ranging effects on flower bud break efficiency, flower fertility, fruit drop, fruit morphology and quality, depending on the species (Atkinson et al., Reference Atkinson, Brennan and Jones2013). Thus, the possibility of winter chilling often defines the sub-tropical limit of species cultivation, and climate change poses a risk to farming systems, resulting in reductions in winter chilling intensity that affect crop yields or quality (Campoy et al., Reference Campoy, Darbyshire, Dirlewanger, Quero-García and Wenden2019). In a recent study, we have shown that, after vernalization and floral initiation, winter oilseed rape (WOSR) also forms flower buds with a dormant phase, during which further, more intense chilling is required to advance bud break and bolting in spring (Lu et al., Reference Lu, O’neill, Warner, Xiong, Chen, Wells and Penfield2022). This effect is additional to the role of vernalization in promoting floral initiation and arises from the differential sensitivity of specific B. napus FLC genes to autumn and winter temperatures. The timing of this chilling requirement in the field corresponds to a statistical association between low temperatures and increased yields (Brown et al., Reference Brown, Beeby and Penfield2019) and manipulating temperature at this stage results in floral abnormalities and yield declines. So, while early winter temperatures appear temporally divorced from the temperature-sensitive early reproductive period, floral development is already well advanced in WOSR during winter in Europe.
Some of the effects of reduced flower bud chilling may be mitigated by allelic variation that affects the sensitivity of Brassica FLC genes to chilling temperatures (Warner et al., Reference Warner, O’neill, Doherty, Wells and Penfield2024). The disadvantage of this approach is that this strategy will also advance vernalization and floral initiation in autumn, and this may prematurely terminate vegetative growth and increase temperatures during flower bud development by virtue of floral initiation occurring earlier in the autumn growing season. For this reason, we sought to understand more detail about the mechanism by which variation in chilling intensity affects seed yields. In Arabidopsis, Arabis alpina and the agricultural weed Alopecurus myosuroides, changes in maternal vernalization intensity have an effect on seed dormancy (Auge et al., Reference Auge, Blair, Neville and Donohue2017; Hughes et al., Reference Hughes, Soppe and Albani2019; Holloway et al., Reference Holloway, Pérez, Venceslai, Seville, Stock, Nakabayashi and Leubner-Metzger2025), providing cross-species evidence that prior vernalization affects seed traits in plants. Although the mechanism remains unclear, given this background, we hypothesized that vernalization intensity could also affect seed traits important for crop yield or quality in WOSR.
Here, we investigate the effects of varying vernalization intensity on seed yield parameters using a diversity set containing a range of B. napus crop types bred for their differing requirements for winter cold to promote the transition to flowering. We find that in vernalization-sensitive winter genotypes, decreasing vernalization temperature or increasing the duration of vernalization results in larger seeds by area or weight and reduced expression of FLC genes in developing seeds. Furthermore, we found that increases in seed size are not compensated for by a lower seed number, resulting in net increases in seed weight per pod. We identified WOSR FLC genes that are specifically important in seeds, and our results suggest that breeders of Chinese semi-winter varieties have selected for weak alleles of FLC_C09b and possibly other FLCs that contribute to increased seed size after warmer winters.
Materials and methods
Plant materials
The B. napus diversity fixed foundation set (DFFS) has been described previously (Harper et al., Reference Harper, Trick, Higgins, Fraser, Clissold, Wells, Hattori, Werner and Bancroft2012) and consists of 96 varieties that broadly represent crop type diversity in the species. WOSR Catana is a modern European variety from the DFFS that was cultivated commercially circa 2012 in the United Kingdom and is representative of modern western European rapeseed. The Tapidor × Ningyou7 Doubled Haploid (TNDH) population has been described previously (Qiu et al., Reference Qiu, Morgan, Shi, Long, Liu, Li, Zhuang, Tan, Dietrich, Weihmann, Everett, Vanstraelen, Beckett, Fraser, Trick, Barnes, Wilmer, Schmidt, Li, Meng and Bancroft2006) and consists of 71 homozygous lines derived from the cross between a European WOSR (Tapidor) and a Chinese semi-winter variety (Ningyou7) with a lower vernalization requirement.
Testing the effect of vernalization intensity on seed size and yield in the B. napus DFFS
The B. napus DFFS each variety was grown in cereal mix (40% medium grade peat, 40% sterilized soil, 20% horticultural grit, 1.3 kg m−3 Yara PG mix 14-16-18 plus trace element starter fertilizer, 1 kg m−3 Osmocote Mini 16-8-11 2 mg plus trace elements 0.02% B, wetting agent, 3 kg m−3 maglime, 300 g m−3 Exemptor) for 21 days (16 h light/8 h dark, Heliospectra LED lamps, 18°C: 15°C, day: night temperature, 70% humidity) to allow establishment, and then placed into vernalization in 8 h light/16 h dark cycles, at 5°C, 10°C or 15°C for either 6 or 12 weeks.
After vernalization, plants were potted into 3-litre pots and randomized in an incomplete block design into two glasshouses, one set to 18°C and one to 24°C, with supplementary lighting to give 16 h light/8 h dark. Actual temperatures achieved are shown in Supplementary Figure S1 and indicate that the glasshouses were held close to the set temperatures, with daily fluctuations of 2–5°C. Three replicate plants for each variety were grown for each treatment, although failure to flower or other losses reduced the number of plants for some varieties (see Table 1 for final data structure). After maturation and drying of plants, 20 pods were harvested from the primary raceme as described previously (Miller et al., Reference Miller, Wells, McKenzie, Trick, Ball, Fatihi, Dubreucq, Chardot, Lepiniec and Bevan2019); plants with fewer than 17 filled pods were excluded from further analysis. The average number of seeds in each pod was calculated, and seed area and weight for each plant were recorded using a Marvin seed analyser (GTA Sensorik).
Structure of the dataset used for the analysis of vernalization temperature on seed set in B. napus

Table 1 Long description
Rows list crop types and columns give varieties, number of seed lots, 6 weeks vern., 12 weeks vern., 5 degrees C vern., 10 degrees C vern., and 15 degrees C Vern. Semi-winter OSR has 8 varieties and 137 seed lots, with 67 at 6 weeks vern. and 70 at 12 weeks vern.; by temperature it has 47 at 5 degrees C vern., 48 at 10 degrees C vern., and 42 at 15 degrees C Vern. Winter OSR has 39 varieties and 587 seed lots, with 276 at 6 weeks vern. and 311 at 12 weeks vern.; by temperature it has 226 at 5 degrees C vern., 222 at 10 degrees C vern., and 139 at 15 degrees C Vern. Spring OSR has 29 varieties and 457 seed lots, with 219 at 6 weeks vern. and 238 at 12 weeks vern.; by temperature it has 163 at 5 degrees C vern., 166 at 10 degrees C vern., and 128 at 15 degrees C Vern. Swede has 8 varieties and 72 seed lots, with 26 at 6 weeks vern. and 46 at 12 weeks vern.; by temperature it has 33 at 5 degrees C vern., 30 at 10 degrees C vern., and 9 at 15 degrees C Vern. Exotics/fodder rape has 21 varieties and 154 seed lots, with 65 at 6 weeks vern. and 89 at 12 weeks vern.; by temperature it has 65 at 5 degrees C vern., 63 at 10 degrees C vern., and 26 at 15 degrees C Vern. The Total row lists 105 varieties and 1407 seed lots, with 653 at 6 weeks vern. and 754 at 12 weeks vern.; by temperature totals are 534 at 5 degrees C vern., 529 at 10 degrees C vern., and 344 at 15 degrees C Vern.
Note: The table shows the number of varieties and the number of qualifying seed lots set for each crop type produced under each vernalization treatment. Vern. = vernalization.
Statistical analysis was performed in R version 4.5.1 and Genstat version 23 (VSNi). No significant effect of block on flowering or seed traits was found; hence, the block was removed from the data analysis model, as reported in the results section below. For flowering time analysis, the entire dataset was used. However, high levels of pre-harvest sprouting in the 24°C set limited the seed data available such that only seeds set at 18°C were used for the analysis of the effect of vernalization on seed area, weight and number per pod. This dataset included the analysis of 1407 independent seed lots; however, at a vernalization temperature of 15°C or a vernalization duration of 6 weeks, there were fewer plants setting seed lots that met the quality threshold for analysis, either because of non-flowering or poor seed set. The exception is semi-winter oilseed rape (OSR) varieties, which are clearly distinct from other crop types, likely because of their adaptation to shorter, warmer winters of the Yangtze River basin in China. The full data structure is shown in Table 1, and raw data are shown in Supplementary Dataset 1.
Transcriptome analysis of WOSR variety Catana
To identify a suitable time point for gene expression profiling, seeds harvested from pods on the main raceme were analysed from five replicate plants growing under long-day glasshouse conditions (16 h day/8 h night) after either a 6-week, 5°C or 15°C vernalization (as detailed above), 21 days after pollination (DAP). Seeds were imaged on a Leica MZ6 stereomicroscope fitted with a 1× objective lens and imaged with a GXCAM HiChrome HR4 camera.
RNA was collected from three replicate individual shoot apexes after either 1 week or 6 weeks of vernalization at either 5°C or 15°C, or at the first sign of floral initiation, determined by dissection of sister plants growing under the same conditions. Gynoecia were bulked from unopened flower buds and seed was collected from tagged pods at 14 DAP, both from the primary raceme, and RNA was extracted using the EZNA plant RNA kit (Omega Bio-tek). RNA sequencing was performed by Novagene using strand-specific; 150 bp paired-end libraries on an Illumina NovaSeq6000, generating 60 to 84 million reads per sample. Trimmed reads were mapped to B. napus genome v4.1 using HISAT2 v2.1.0 with default parameters (Kim et al., Reference Kim, Paggi, Park, Bennett and Salzberg2019). Differentially expressed genes in seeds were called at P < 0.01, with a minimum log2 fold change of 1.5, using DESeq2 (Love et al., Reference Love, Huber and Anders2014). Hierarchical clustering was carried out using Morpheus (https://software.broadinstitute.org/morpheus).
Data are available at the European Nucleotide Archive, accession number PRJEB105189.
TNDH population analysis of the effect of vernalization on seed area and weight
The Tapidor × Ningyou7 (TNDH population) encompassing 75 lines (Bancroft et al., Reference Bancroft, Fraser, Morgan and Trick2015) was used to investigate the effect of vernalization on seed size, with 71 lines generating sufficient seeds for the analysis. Lines were sown in cereal mix (see above) for 21 days (16 h light/8 h dark, 600 W HPS lamps, 18°C: 15°C, day: night temperature, 70% humidity) to allow establishment, and then placed into vernalization in 8 h light/16 h dark cycle before either a no vernalization (unvern) treatment or 5°C vernalization under short days (8 h/16 h day/night). Following pre-treatment, the population was transplanted in the field at the John Innes Centre (Norwich, England) in April 2012. Sowing times of the two treatments were staggered such that all plants could be transplanted at the same time. Due to the temperature experienced (April 2012), plants received a further 6 weeks of chill in the field, experiencing either 6 weeks of cold (unvern pretreatment) or 12 weeks of cold (vern pretreatment). Treatments were grown in four fully replicated, randomized blocks per treatment and seed was harvested when the plants were fully mature.
After flowering and seed set, seeds were collected from up to five individual plants and stored in the Germplasm Resource Unit at the John Innes Centre until analysis. Seed area and weight were measured using a Marvin Seed Analyser (GTA Sensorik). Statistical analysis was carried out by two-way ANOVA with vernalization treatment and genotype as factors using Genstat version 23. Quantitative Trait Loci (QTL) analysis was performed for unvernalized, vernalized and the ratio between the two treatments for seed area and thousand grain weight (TGW) using the simple interval mapping function within Genstat version 23. Mapping data used were as published in Bancroft et al. (Reference Bancroft, Fraser, Morgan and Trick2015).
PCR genotyping of BnFLC_C09b (BnaC09g46540D)
DNA was extracted from seedlings of Tapidor and Ningyou7 using the DNeasy Plant Mini Kit (Qiagen) according to the manufacturer’s description. In brief, 0.5 g of leaf was ground to a fine powder in liquid nitrogen. Then, ∼0.1 g of leaf powder was lysed using Buffer AP1 containing SDS and RNase A and incubated for 30 min at 65°C. The lysate was neutralized using Buffer P3 containing potassium acetate and centrifugated for 5 min at 20,000g. The supernatant of lysate was transferred to QIAshredder spin column, centrifugated and washed. Subsequently, the DNA was eluted with 100 μl TE buffer. PCR of fragments of BnFLC_C09b was carried out using Q5 High-Fidelity 2X Master Mix (NEB) in three-step PCR, including denaturation for 10 s at 98°C, annealing for 20 s at 58°C and extension for 5 min, which were repeated 35 times to amplify a specific DNA fragment. The primers are labelled in Fig. 5B and listed in Supplementary Table S1.
Results
To understand the genetic diversity of seed developmental responses to temperature, we designed an experiment using a modified B. napus DFFS (Harper et al., Reference Harper, Trick, Higgins, Fraser, Clissold, Wells, Hattori, Werner and Bancroft2012), varying the vernalization temperature prior to flowering from 5°C, 10°C to 15°C for either 6 or 12 weeks (see methods for further details), noting that 15°C is close to the warmest temperature that elicits a vernalization response in B. napus (Tommey and Evans, Reference Tommey and Evans1991) and other species. Plants for each genotype were grown at either 18°C or 24°C during flowering and seed set, after which the effects on seed area and weight were recorded, alongside the number of seeds per pod.
The effectiveness of the vernalization treatments in four crop types was verified by recording time to first flower (Fig. 1). Vernalization temperature had a measurable effect on flowering time in all crop types, but a general pattern emerged in that swedes and winter types were more strongly affected than spring or semi-winter types, as has been described many times previously. Furthermore, the difference between 10°C and 15°C was greater than that between 5°C and 10°C, with the latter comparison only leading to significant changes in flowering time in swedes and WOSR. This confirmed the efficacy of our experimental design in creating meaningful variation in vernalization intensity.
The effect of three vernalization temperatures on flowering time (BBCH60) in B. napus crop types. Violin plot shows the data range, with individual outliers highlighted as open circles. Significance analysis was performed using ANOVA plus Bonferroni post hoc test. N is variable depending on the number of varieties in the diversity set (see Table 1). The experiment was ended at 150 days, with non-flowering plants scored as DNF – Did Not Flower (blue dashed line).

Figure 1 Long description
Vernalization temperature The y-axis is labeled, Flowering time, Days after Vernalization, ranging from 0 to 200 with ticks at 0, 50, 100, 150 and 200. The x-axis is labeled, Crop type, with four categories: semi-winter, spring, swede and winter. A legend label reads, Vernalization temperature, with three entries: 5, 10 and 15. A horizontal dashed line is labeled, DNF, at 150. For semi-winter, three violins are shown. The 5 violin is centered around roughly 20 to 30, with the widest part near about 20 to 25. The 10 violin is centered around roughly 20 to 30, with the widest part near about 20 to 25. The 15 violin is centered around roughly 30 to 45, with the widest part near about 35 to 40. A bracket above semi-winter shows, p less than 0.001 and letters a, a, b appear above the three violins. For spring, three violins are shown. The 5 violin is centered around roughly 20 to 30, with the widest part near about 20 to 25. The 10 violin is centered around roughly 20 to 30, with the widest part near about 20 to 25. The 15 violin is centered around roughly 25 to 50, with the widest part near about 30 to 40. A bracket above spring shows, p less than 0.001 and letters a, a, b appear above the three violins. For swede, three violins are shown. The 5 violin spans from about 0 up to about 150, with a wide section around about 40 to 70 and a narrow upper tail approaching 150. The 10 violin spans from about 0 up to about 150, with a wide section around about 40 to 70 and a narrow upper tail approaching 150. The 15 violin is concentrated near the top, spanning roughly 120 to 150, with the widest part near about 140 to 150. A bracket above swede shows, p less than 0.001 and letters a, b, c appear above the three violins. For winter, three violins are shown. The 5 violin spans from about 0 up to about 150, with a wide section around about 30 to 60 and a narrow upper tail approaching 150. The 10 violin spans from about 0 up to about 150, with a wide section around about 30 to 60 and a narrow upper tail approaching 150. The 15 violin spans from about 0 up to about 150, with a wide section around about 60 to 110 and a narrow upper tail approaching 150. A bracket above winter shows, p less than 0.001 and letters a, b, c appear above the three violins. A long bracket across the top spans all crop types and is labeled, p less than 0.001. Letters a, a, b, c appear above the four crop-type groups from left to right.
Comparing the two seed set temperatures, warming resulted in a decrease in TGW in all crop types, but the effect size was notably larger in Chinese semi-winter lines than in other crop types (Supplementary Figure S2). Warming also decreased the number of mature seeds per pod, but this measure was affected by an increase in pre-harvest sprouting at 24°C, which led to seeds being removed from the analysis. Due to variable and high levels of pre-harvest sprouting observed at 24°C that affected the number of seed lots available for study, we used only the seed lots set at 18°C for subsequent analysis of the effect of vernalization on seed yield parameters.
Colder vernalization temperatures increase thousand seed weight and number in winter oilseed rape
To understand the impact of vernalization on seed set, we measured the seed area and TGW of seeds from the DFFS variety panel, in addition to counting the number of seeds per pod, using 20 filled pods on the main raceme (Miller et al., Reference Miller, Wells, McKenzie, Trick, Ball, Fatihi, Dubreucq, Chardot, Lepiniec and Bevan2019) for seeds set at 18°C (see methods for details). The dataset was analysed by linear mixed model (LMM) with the following general formula:
 \begin{equation*}Fixed\,model:\,Y = \varepsilon + \left[ {{V_T}} \right] + \left[ {{V_D}} \right] + \left[ C \right] + \left[ {C.{V_T}} \right] + \left[ {C.{V_D}} \right]\end{equation*}
 \begin{equation*}Random\,model:\,Y = \left[ {Var} \right]\end{equation*}
where Y is the yield parameter (either TGW, seeds per pod [SPP] or seed weight per pod [SWPP]), VT is the vernalization temperature, VD is the vernalization duration, C is the crop type, C.VT and C.VD are the corresponding interaction terms, ε is a constant and Var is the variety, all of which are introduced into the model as factors. Outputs are shown in Table 2.
LMM analysis of the effects of vernalization temperature and duration on yield parameters of B. napus

Table 2 Long description
Yield measures listed are TGW in grams, SPP, and SWPP in milligrams, with factors VT, VD, C, C. VT, and C. VD reported with variance ratio F and P value, plus predicted means by vernalisation temperature at 5 degrees C, 10 degrees C, and 15 degrees C and by duration at 6 W and 12 W. For TGW in the whole dataset, VT has F 22.5 with P less than 0.001, and VD has F 9.5 with P 0.002; predicted means for VD are 4.29 at 5 degrees C, 4.13 at 10 degrees C, 3.98 at 15 degrees C, 4.08 at 6 W, and 4.19 at 12 W. For TGW in WOSR only, C has F 13.2 with P less than 0.001, C. VT is marked Ns with P ns, and predicted means for C. VT are 4.70 at 5 degrees C, 4.52 at 10 degrees C, 4.29 at 15 degrees C, 4.43 at 6 W, and 4.57 at 12 W; the C. VD predicted means cell is blank. For SPP in the whole dataset, VT has F 15.3 with P less than 0.001 and VD has F 12.4 with P less than 0.001; predicted means for VD are 19.3 at 5 degrees C, 18.5 at 10 degrees C, 17.0 at 15 degrees C, 17.8 at 6 W, and 18.7 at 12 W. For SPP in WOSR only, C is marked Ns with P ns, C. VT has F 2.7 with P less than 0.001 with predicted means 21.5 at 5 degrees C, 20.9 at 10 degrees C, 19.0 at 15 degrees C, 19.8 at 6 W, and 21.1 at 12 W; C. VD has F 4.8 with P less than 0.001 and its predicted means cell is blank. For SWPP in the whole dataset, VT has F 38.5 with P less than 0.001 and VD has F 31.0 with P less than 0.001; predicted means for VD are 80.1 at 5 degrees C, 74.6 at 10 degrees C, 66.0 at 15 degrees C, 70.0 at 6 W, and 77.1 at 12 W. For SWPP in WOSR only, C has F 7.6 with P less than 0.001, C. VT has F 4.5 with P less than 0.001 with predicted means 99.0 at 5 degrees C, 93.2 at 10 degrees C, 80.2 at 15 degrees C, 86.5 at 6 W, and 95.0 at 12 W; C. VD has F 5.4 with P less than 0.001 and its predicted means cell is blank. A final section labeled WOSR at 12 W only lists VT effects with predicted means by temperature only: TGW has F 25.5 with P less than 0.001 and means 4.8 at 5 degrees C, 4.6 at 10 degrees C, and 4.3 at 15 degrees C; SPP has F 54.1 with P less than 0.001 and means 22.6, 21.6, and 19.0; SWPP has F 44.3 with P less than 0.001 and means 106.1, 97.7, and 80.7.
The table shows results for TGW, seed number per pod (SPP) and seed weight per pod (SWPP) on the main raceme after vernalization treatments of either 6 weeks (6 W) or 12 weeks (12 W). Variables and factors are defined in the text. Predicted means are given for the whole dataset and winter oilseed rape (WOSR) only. Factors that have no significant association (ns) with yield measures were removed from the models.
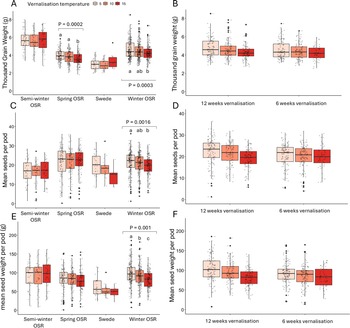
For TGW vernalization, temperature has a bigger effect than duration of vernalization: effect sizes are not large (up to 10% in WOSR) but highly significant. For seed per pod, the effect size across the population is similar to TGW, with an ∼10% increase in seed number after vernalization at 5°C rather than 15°C. However, TGW increases do not come at the expense of a reduction in seed number, as found in studies with varying conditions later in development (Labra et al., Reference Labra, Struik, Evers and Calderini2017). The more important differences become apparent when these data are combined: across the population, seed weight per pod varies from an average of 66 mg after vernalization at 15°C up to 80 mg after vernalization at 5°C. In WOSR, the total effect size of the change in vernalization temperature is 25%, underlining the importance of the observation that increasing vernalization intensity positively affects both seed weight and seed number per pod.
To further understand the effect of vernalization on seed yield parameters, we analysed effects in each crop type, excluding the exotics and fodders which are highly diverse in phenology and vernalization requirements (Fig. 2A–C). This showed that there is no generalized significant effect of vernalization temperature on TGW, SPP or SWPP in Chinese semi-winter OSR or swedes, although in swedes the effect of 15°C was hard to quantify because so few plants set any seeds (Fig. 2). SOSR showed a significant effect on TGW only, while WOSR showed significant differences in all three measures, but particular in SWPP, which is the only measure in which 5°C results in higher yield than 10°C. Noting the highly significant effect across the population as a whole, among non-winter crop types, there must be individual varieties that show strong seed set responses to prior vernalization. Among winter OSR, vernalization only had a significant effect after 12 weeks of vernalization (Fig. 2D–F), with the increased vernalization duration having a strong effect on SPP (Table 2, Fig. 2E). Therefore, although 6 weeks of chilling is a sufficient duration to promote flowering, it is clear that further chilling continues to have beneficial effects on seed setting.
The effect of variation in vernalization intensity on seed yield-associated traits in B. napus. (A–C) Variation in vernalization temperature effects on TGW, seed number per pod and seed weight per pod after three vernalization temperatures in different crop types. Statistical analysis was via linear mixed model with Tukey post hoc test (see text for details). (D–F) The effect of variation in chilling duration of either 6 weeks vernalization (vern) or 12 weeks on seed weight and number per pod in winter OSR. Statistical analysis was via linear mixed model with Bonferroni post hoc test. N is a variable and given in Table 1.

Figure 2 Long description
A box plot titled ′Vernalisation temperature′ with the y-axis labeled ′Thousand Grain Weight (g)′ ranging from 0 to 10. Categories are Semi-winter OSR, Spring OSR, Swede and Winter OSR. Each category has three temperature groups: 5, 10 and 15 degrees Celsius. Semi-winter OSR shows higher medians at 5 degrees Celsius. P equals 0.0002. The image B showing a box plot with the y-axis labeled ′Thousand grain weight (g)′ ranging from 0 to 10. Categories are 12 weeks and 6 weeks vernalisation. Each has three temperature groups: 5, 10 and 15 degrees Celsius. No significant differences noted. The image C showing a box plot with the y-axis labeled ′Mean seeds per pod′ ranging from 0 to 40. Categories are Semi-winter OSR, Spring OSR, Swede and Winter OSR. Spring OSR shows higher medians at 10 degrees Celsius. P equals 0.0016. The image D showing a box plot with the y-axis labeled ′Mean seeds per pod′ ranging from 0 to 40. Categories are 12 weeks and 6 weeks vernalisation. 12 weeks shows higher medians. The image E showing a box plot with the y-axis labeled ′Mean seed weight per pod′ ranging from 0 to 150. Categories are Semi-winter OSR, Spring OSR, Swede and Winter OSR. Winter OSR shows higher medians at 5 degrees Celsius. P equals 0.001. The image F showing a box plot with the y-axis labeled ′Mean seed weight per pod′ ranging from 0 to 150. Categories are 12 weeks and 6 weeks vernalisation. 12 weeks shows higher medians. Outliers are present in all plots, indicating variability. The plots reveal how vernalisation temperature and duration affect seed traits across different crop types.
Vernalization temperature variation affects FLC expression in developing seeds
Modern WOSR variety Catana showed a strong effect of vernalization temperature on TGW (Fig. 3A), and this variety was used in a transcriptomic study to understand the effect of vernalization temperature variation on seeds. Dissecting seeds during seed development revealed that seed area differences caused by vernalization temperature variation were already apparent 21 days after pollination (DAP; Fig. 3B), so this time point was used to generate whole seed transcriptomes from seeds setting on mother plants after vernalization at 5°C or 15°C. We also analysed RNA from the shoot apex after one week or 8 weeks of vernalization, at floral initiation and from gynoecia prior to fertilization.
Gene expression analysis of the effect of vernalization temperature variation on reproductive development. (A) The effect of variation in vernalization temperature on TGW in the winter OSR variety Catana used for the study. Statistical analysis was conducted via ANOVA with Tukey post hoc test (n = 5 for 15°C, n = 6 for 5°C). (B) The effect of vernalization temperature on seed size, measured by seed area under the microscope, of Catana seeds 21 days after pollination (DAP). Statistical analysis was conducted via ANOVA with Tukey post hoc test (n = 10). (C) Aggregated mean FLC expression after 1 or 6 weeks of vernalization (1WV, 6WV), at floral initiation (FI), in gynoecia (GY) or whole seeds 14 DAP (SD) across three biological replicates. (D) Hierarchical clustering of differentially expressed genes in seeds (see methods) after 1 or 6 weeks vernalization (1WVern, End of vern (EOVern) in gynoecia or seeds 21 DAP after vernalization at 15°C or 5°C. The three groups (1–3) discussed in the text.

Figure 3 Long description
The figure consists of four scientific plots comparing traits and gene expression under different vernalisation temperatures. The first plot shows a box plot of thousand grain weight (TGW) for mature seeds at 15 degrees Celsius and 5 degrees Celsius. The x-axis is labeled ′Vernalisation Temperature′ with categories ′15 degrees C′ and ′5 degrees C′. The y-axis is labeled ′TGW in grams′, showing higher TGW at 15 degrees Celsius. The second plot displays a box plot of seed area 21 days after pollination (DAP) under the same temperatures. The x-axis is labeled ′Vernalisation Temperature′ with categories ′15 degrees C′ and ′5 degrees C′. The y-axis is labeled ′Seed Area in square millimeters′, indicating larger seed area at 15 degrees Celsius. The third plot contains two stacked bar graphs of total FLC expression in different tissues at 15 degrees Celsius and 5 degrees Celsius. The x-axis is labeled ′Tissue′ with categories ′1WV/6WV′, ′FI′, ′GY′ and ′SD′, representing one week vernalisation, six weeks vernalisation, floral initiation, gynoecia and whole seeds 14 DAP, respectively. The y-axis is labeled ′Total FLC Expression in FPKM′, showing varying expression levels across tissues. The fourth plot is a heatmap of gene expression at 5 degrees Celsius and 15 degrees Celsius. The rows represent different genes and the columns represent samples or conditions. The color scale indicates relative expression from minimum (blue) to maximum (red), with hierarchical clustering showing distinct gene-expression patterns by temperature. The compared groups are labeled as ′5 degrees C′ and ′15 degrees C′, with three distinct clusters identified. Specific quantitative reference points, such as medians and ranges, are not provided, but the plots highlight notable differences in trait and gene expression under varying temperatures.
Firstly, we analysed mean FLC expression across tissues and time points. At 15°C, total FLC expression actually increased during vernalization itself, declining after the return of plants to the warm where they complete reproductive development (Fig. 3C). This increase was especially apparent in FLC_A02, FLC_A03b and FLC_A10. Specifically in seeds, the predominant expressed isoforms were FLC_C03a and FLC_C09b after 5°C vernalization, while 15°C treatment resulted in a notable increase in FLCC03a and FLC_C09bexpression and persistence of FLC_A10 expression. FLC_C03a has previously been described as having a role in the vernalization response (Schiessl et al., Reference Schiessl, Quezada-Martinez, Tebartz, Snowdon and Qian2019), but surprisingly, FLC_C03a and FLC_C09b showed a previously undescribed transcriptional behaviour in that their expression maximum occurs in seeds after a warmer vernalization treatment. This behaviour persisted for FLC_C03a even after vernalization at 5°C (Fig. 3C).
To gain insights into the mechanisms by which variation in chilling and FLC activity might affect seed size, we analysed the effect of variation in the vernalization temperature on gene expression in seeds. Differentially expressed genes in seeds could be broadly ascribed to a small number of behaviours (Fig. 3D, Supplementary Table S2). The largest group (1) consists of genes expressed during vernalization that continue to show increased expression in seeds. A second group showed expression maxima in gynoecia (2), and a third group consisted of genes primarily expressed in seeds and increased after either the 5°C or 15°C treatments. Differentially expressed FLC genes fell into two distinct groups. Clustering with FLC_C09b were many genes involved in the ABA and auxin responses, including the ABA- and auxin-induced MYB transcription factors MYB73 and MYB77, several ABA- and stress-responsive genes and the auxin-responsive genes PINOID BINDING PROTEIN 1 and ARGOS. FLC_A02 and FLC_A10 clustered with a group of genes that were induced during vernalization at 15°C and remained expressed at a higher level in seeds, with functions also centred on ABA signalling and auxin responses, including ARGOS, ARGOS-LIKE (ARL), ABA HYPERSENSITIVE 3 (AHG3) and HIGHLY ABA INDUCED 2 (HAI2; Fig. 3D). Although the data are indicative only, this suggests that FLC activity is associated with increased ABA and auxin responses during early seed development.
Identification of quantitative trait loci associated with the effect of vernalization on seed area and weight
Due to the contrast between vernalization-responsive seed set parameters in European winter OSR and non-responsive Chinese semi-winter OSR, we used the previously characterized Tapidor (WOSR) × Ningyou7 (SWOSR) doubled haploid (TNDH) population (Qiu et al., 2006) to map loci affecting the relationship between vernalization intensity and seed size. First, we gave Tapidor and Ningyou7 increasing amounts of vernalization and measured the impact on seed weight. In Tapidor, a clear difference was observed between 6 and 12 weeks vernalization, supporting previous observations that although 6 weeks is sufficient to promote flowering, up to 12 weeks of cold may be necessary to promote maximal seed growth (Fig. 4A, B). A similar trend was observed in Ningyou7, although in Ningyou7 the increase in seed TGW was observed between 3 and 6 weeks rather than between 6 and 12 weeks, consistent with its lower vernalization requirement. A clear feature of seed weight in Ningyou7 is that TGW was higher than Tapidor at low vernalization intensities, showing that Ningyou7 seeds are less sensitive to reductions in vernalization intensity.
Variation in seed size responses to vernalization in the Tapidor × Ningyou7 doubled haploid population. (A, B) The effect of variation in the duration of vernalization from 3 weeks (3 W) to 12 weeks (12 W) on TGW in the population parent varieties. Statistical analysis was conducted via ANOVA with Tukey post hoc test (n = 20). Scale bar 3 mm. (C, D) Violin plots to summarize the seed size responses of field-grown plants of the Tapidor × Ningyou7 doubled haploid population transplanted with or without prior vernalization. Statistical analysis was conducted via ANOVA with Tukey post hoc test (n = 503 seed lots).

Figure 4 Long description
Two rows of seed close ups labeled Ningyou7 and Tapidor, with two columns labeled 3 W and 12 W. A box plot with the vertical axis label, TGW left parenthesis g right parenthesis and tick labels 3, 4, 5, 6, 7. The horizontal axis has two categories, Ningyou7 and Tapidor. A legend lists 3W, 6W, 12W. For Ningyou7, three box plots are shown around 4.5, around 5.5 and around 5.8 on the TGW axis, with letter annotations a, b and b above the groups. For Tapidor, three box plots are shown around 4.0, around 4.2 and around 6.0 on the TGW axis, with letter annotations a, a and b above the groups. A violin plot with the vertical axis label, TGW left parenthesis g right parenthesis and tick labels 0, 2, 4, 6, 8. The horizontal axis has two categories, unvernalised and vernalised. A text label reads P less than 0.001. The unvernalised distribution is centered around about 3 to 4 on the TGW axis, with scattered points spanning roughly 1 to 6. The vernalised distribution is centered around about 4 to 5 on the TGW axis, with scattered points spanning roughly 2 to 8. A violin plot with the vertical axis label, Seed area left parenthesis mm superscript 2 right parenthesis and tick labels 0, 2.5, 5.0, 7.5, 10.0. The horizontal axis has two categories, unvernalised and vernalised. A text label reads P less than 0.001. The unvernalised distribution is centered around about 5 on the seed area axis, with scattered points spanning roughly 3 to 7. The vernalised distribution is centered around about 6 on the seed area axis, with scattered points spanning roughly 4 to 8.
The population was also transplanted into the field in the spring, with or without prior vernalization (see methods) and seed size and weight were recorded. Seeds from plants with prior vernalization in general showed an increase in seed size and weight (Fig. 4C, D): in no lines did vernalization reduce seed size, and individual DH lines ranged from showing no response through to a doubling of TGW. These highly significant effects of vernalization on seed area and weight mean the population is useful for mapping genetic variation that sensitizes or desensitizes seeds to maternal vernalization.
Next, we used the linkage map (Bancroft et al., Reference Bancroft, Fraser, Morgan and Trick2015) to locate QTLs linked to seed size sensitivity to vernalization, as measured by the change in TGW and seed area in lots from mother plants when given prior vernalization before spring planting (Fig. 5A). This analysis identified up to seven genomic regions with a significant association with the effect of vernalization on seeds with the largest number from the C genome. Most of these QTL encompassed large genomic regions and thus further work would be required to understand the genetic basis in detail. Two QTL on C03 and C09 coincide with the presence of FLC_C03a and FLC_C09b, which transcriptomic analysis suggested were responsible for the largest fraction of FLC expression in seeds (Fig. 3C). The C03 QTL covers a large chromosomal region so it is unclear whether FLC_C03a really is the causative gene: further, we could find no clearly important variation in FLC_C03a sequence between Tapidor and Ningyou7 using exome capture data (Woodhouse et al., Reference Woodhouse, He, Woolfenden, Steuernagel, Haerty, Bancroft, Irwin, Morris and Wells2021). However, the QTL on C09 is notable in that the short interval contains only three expressed genes, two of which are FLC_C09a and FLC_C09b. Interestingly, sequencing FLC_C09b in Ningyou7 (FLC_C09b N7) revealed a partial insertion of a transposable element, including the partial sequence of a gene encoding an MYM-type protein, in the first intron (Fig. 5B, C). Transposable elements in intron 1 of FLC are well known for attracting gene silencing and creating weak alleles in both Arabidopsis and Brassica species (Hou et al., Reference Hou, Long, Raman, Zou, Wang, Dai, Xiao, Li, Fan, Liu and Meng2012; Yin et al., Reference Yin, Wan, Guo, Wang, Li, Li, Tian, Ge, King, Liu, Li and Wang2020). This suggests that FLC_C09bN7 increases seed size responses to vernalization relative to FLC_C09bTAP and furthermore appears to act additively with the QTL on C03 that may or may not be associated with alteration in FLC_C03a activity (Fig. 5D, E).
Identification of QTL associated with the sensitivity of seed size to vernalization in B. napus. (A) Log of the odds (LOD) scores for markers across the TNDH population identify up to 7 significant QTL across the A and C genomes. Black dotted lines represent a significance level of 1.5-log10P. (B, C) PCR analysis and sequencing of FLC-C09c in Ningyou7 identifies the presence of a transposable element carrying a partial insertion of an MYM-type protein in intron 1. T and N designate Tapidor and NIgnyou7, respectively, P designates the location of primers P1 to P10 used for the PCR in panel C. (D) The differential effects of vernalization on TGW in the TNDH population by FLC_C09c genotype, showing the increased response of lines carrying the Ningyou7 allele. (E) Additive effects of FLC_C09c and the C03 QTLs on TGW, including FLC_C03a, which also shows seed expression maxima.

Figure 5 Long description
The figure consists of five panels labeled A to E. A: A line graph showing Log of the Odds (LOD) scores across chromosomes A1 to A10 and C1 to C9. The x-axis is labeled ′Chromosome′ and is categorical. The y-axis is labeled ′LOD′, ranging from 0 to 8, unitless. Peaks occur across various chromosomes, with a dotted line indicating a significance level of 1.5-log. The strongest peak crosses this threshold. B: A schematic representation of gene sequences, showing BnaC09g46500 (FLC C09a) and BnaC09g46540 (FLC C09b) with arrows indicating primers P1 to P5. A MYM-type protein 1 partial insertion is marked, suggesting a functional change. C: A gel electrophoresis image showing bands for FLC C09a and FLC C09b across samples labeled T and N, with primers P1 to P10. D: A violin plot comparing Thousand Grain Weight (TGW) ratio v over v for FLC C09b subscript tap and FLC C09b subscript N7. The x-axis shows the genotypes and the y-axis shows TGW ratio v over v, ranging from 1.0 to 2.5. The FLC C09b subscript N7 genotype shows a higher TGW ratio. E: A box plot showing TGW ratio v over v for genotypes labeled C09b C03, TAP, TAP N7, N7 and N7. The x-axis lists the genotypes and the y-axis shows TGW ratio v over v, ranging from 1.0 to 2.5. Each box plot displays the median, quartiles and outliers, with N7 showing the highest median TGW ratio. The figure links QTL identification to differences in TGW ratios by genotype.
Discussion
Optimal environmental conditions during flower development, flowering and early seed set are important for achieving high yields of oilseed rape both in spring and winter varieties (Secchi et al., Reference Secchi, Fernandez, Stamm, Durrett, Vara Prasad, Messina and Ciampitti2023). Floral development and bolting take place during winter in WOSR grown in western Europe, and our previous work indicated that chilling experienced by developing flower buds influences yield (Brown et al., Reference Brown, Beeby and Penfield2017; Lu et al., Reference Lu, O’neill, Warner, Xiong, Chen, Wells and Penfield2022). Here we show that, in the laboratory, seed yield traits are specifically affected by vernalization intensity in WOSR (Fig. 2).
Temperatures as high as 17°C can promote a vernalization response and earlier flowering in B. napus (Tommey and Evans, 1991), although lower temperatures are more effective (Fig. 1). However, whether vernalization intensity affects seed yield-associated traits has not previously been investigated in OSR. Here, we show that in spring and winter OSR, a decrease in chilling temperature or an increase in duration can promote the production of larger, heavier seeds. Furthermore, this is accompanied by an increase in fertility such that pods on the primary raceme contain more seeds on average after vernalization at lower temperatures, leading to a substantial yield gain per pod (Table 2; Fig. 2). This effect contrasts with effects of environment later in flowering and seed set which instead have opposite effects on seed weight and seed number (Labra et al., Reference Labra, Struik, Evers and Calderini2017).
The effect of vernalization on seed size is accompanied by altered levels of FLC expression during early seed development (Fig. 3), although alteration of yield traits likely involves changes in FLC activity in multiple tissues of the parent plants. Although FLC expression is well known to be reset during seed development, this process is induced by B3 family transcription factors, which show the highest expression during seed maturation (Tao et al., Reference Tao, Shen, Gu, Wang, Yu and He2017). Seed size in Arabidopsis is governed primarily by developmental events prior to endosperm cellularization (Creff et al., Reference Creff, Ali, Bied, Bayle, Ingram and Landrein2023), consistent with the observed increase in seed size after increased vernalization by 21 DAP (Fig. 3B). This may occur through downstream effects on ABA and auxin signalling, although this preliminary observation needs further investigation.
Previously, our work has divided B. napus FLC orthologues into two groups based on their differential temperature sensitivity and thus the timing and developmental stage at which silencing occurs in winter OSR (Lu et al., Reference Lu, O’neill, Warner, Xiong, Chen, Wells and Penfield2022). Schiessl et al. (Reference Schiessl, Quezada-Martinez, Tebartz, Snowdon and Qian2019) also noted that FLC_C09b expression is non-responsive to vernalization and our analysis confirms this result, because we detected no change in FLC_C09b expression even after 8 weeks of vernalization (Fig. 3C). However, we also find that FLC_C09b has an expression maximum in seeds and expression increases during reproductive development to become a substantial fraction of total FLC pool in B. napus. Interestingly, FLC_C09b expression during reproductive development retains the influence of prior vernalization, suggesting that despite increases in expression, its chromatin maintains a more repressive state if vernalization is incomplete (Fig. 3C). These results suggest that it has a specific function in linking seed traits to prior winter chilling. This conclusion is consistent with our QTL analysis, which specifically identified a weak allele of FLC_C09b in the Chinese semi-winter variety Ningyou7, which leads to larger seeds (Fig. 5C–E). Weak- or loss-of-function alleles of FLC orthologues are commonplace in semi-winter germplasm and likely function to adapt life history and yield to the short winters of the Yangtze River basin growing region. However, as winters warm in Western Europe due to climate change, importing weak FLC_C09b alleles may allow maintenance of seed yields in winters with low chilling availability.
Conclusions
This analysis shows that in Brassicas sub-functionalization of FLC orthologues has led to the evolution of genes such that they show maximum expression in seeds, where their mRNA levels are variable depending on the extent of prior vernalization. The function of these orthologues can be genetically linked to an effect of vernalization on seed size, with an interesting feature of this response being that there is no apparent trade-off with seed number, leading to yield gains per pod. Together, these effects suggest that breeding for larger seeds may offset some effects of low chilling on B. napus yield and that variation in seed-expressed FLC genes may be useful for adapting WOSR to warmer winters.
Supplementary material
The supplementary material for this article can be found at https://doi.org/10.1017/S0960258526100154.
Acknowledgements
S.P. and R.W. would like to acknowledge Judith Irwin and Colin Morgan for assistance with experiment design and Catherine Taylor for horticultural support.
Author contributions
S.P., C.M.O., R.W. and B.D. designed research; B.D., X.L., F.S., L.G-P., J.H., C.C., E.T. and C.M.O. performed research; B.D., X.L., H.W., F.S., R.W. and S.P. analysed data; S.P. wrote the manuscript with assistance from R.W.; S.P. and R.W. obtained research funds.
Funding statement
This work was funded by Biotechnology and Biological Science Research Council awards BB/W000415/1 and BB/R004196/1 to S.P., and BB/P003095/1 and BBS/E/J/000PR9787 to S.P. and R.W.




 Open access

