Introduction
Biochemical and structural changes of leaves taking place under the influence of adverse environmental factors are accompanied by changes of their optical characteristics registered by special equipment before the appearance of outer symptoms of plant inhibition and damage. The main symptoms of nitrogen starvation of plants, chlorosis and growth retardation play a crucial role in the methods of remote crop canopy monitoring that are being developed. Analysis of spectral characteristics of radiation reflected by the leaf surface helps to detect nitrogen deficiency at the earliest stages, when outer symptoms of nitrogen starvation are still absent (Kanash and Osipov, Reference Kanash and Osipov2009; Yakushev et al., Reference Yakushev, Kanash, Osipov, Lekomtsev and Voropaev2010; Kanash et al., Reference Kanash, Panova and Blokhina2013). It has been shown by means of contact spectroscopy that the activation of secondary metabolism directed at the synthesis of substances protecting plant cells against degradation (antioxidant enzymes, phenolic and other compounds) is one of the first symptoms of plant inhibition under the oxidative stress caused by nitrogen starvation (Kanash and Osipov, Reference Kanash and Osipov2009). Remote crop canopy monitoring is based on the registration of changes both of spectral characteristics of reflected radiation in the visible region and of the extent of soil projective cover, thus making possible a quantitative assessment of plants’ need for fertilization and site-specific fertilizer application. Uneven water supply across the field may considerably affect nutrient assimilation by plants and distort the results of remote diagnostics of plants’ need for fertilization and the application rate. The efficiency of plants’ water status assessment by remote methods will depend on the development of the methods and on the revealing of criteria for real-time detection of plant physiological state deterioration and for recognizing the effect of various stress factors. The objective of the study was to analyze the peculiarities of optical characteristics of spring wheat leaves in conditions of water deficiency at different levels of nitrogen supply and to evaluate the extent of changes in spectral characteristics of reflected radiation under the impact of stressors.
Materials and methods
Spring wheat (Triticum aestivum L., cv. Krasnoufimskaya 100) was cultivated in lighting units with DNaT 400 lamps in 3 l polypropylene containers filled with sod-podzol soil with 18.2 mg/kg of nitrate nitrogen and 34.6 mg/kg of ammonium nitrogen. The irradiance of the plants at the level of the higher leaves was 50±5 W/m2, with a 16-hour photoperiod. The experiment was conducted in 2 variants of nitrogen fertilizer supply: without additional fertilization (low level of nitrogen supply, LN) and with twofold nitrogen application (high level of nitrogen supply, HN). In presowing fertilization, 0.107 mg of сarbamide was applied per 1 kg of soil. The next nitrogen application was performed at the tillering stage and one more after the booting. Before the booting stage, soil water content was equal to 80% of total field capacity (TFC), which value was taken as the control one. In the period from the completion of booting to the earing stage plants were subjected to 7-day soil drought. Soil moisture content during this period was maintained at the level of 30% and 50% of TFC. Thus, in each LN and HN variants were three variations of plants moisture status: optimal (80% TFC - control), moderate water stress (50% TFC), high water stress (30% TFC), and the total numbers of variants were 6. To eliminate the possible impact of other adverse environmental factors, the experiments were conducted on protected ground.
Spectral characteristics of radiation reflected from the upper completed growth leaf were recorded in situ upon the completion of the soil drought action using the miniature fiber-optic spectro-radiometric system HR2000 (Ocean Optics, USA) with optical resolution of 0.065 nm in the region from 300 to 1000 nm and a sampling interval of 0.3 nm, using SpectraSuite software. In recording the reflection spectra, 30 plants were selected in each variant, and the measurements were performed twice. After reflection spectra recording, the spectral reflection indexes were calculated: ChlRI for chlorophyll (Sims and Gamon, Reference Sims and Gamon2002), SIPI for the ratio between the amount of carotenoids and that of chlorophylls (Peñuelas et al., Reference Peñuelas, Barret and Fitella1995), R800 for light dispersion caused by changes of inner leaf structure (Sims and Gamon, Reference Sims and Gamon2002), PRI for the activity of the photochemical processes of photosynthesis (Peñuelas et al., Reference Peñuelas, Barret and Fitella1995), ARI for anthocyanins content (Merzlyak et al., Reference Merzlyak, Gitelson, Chvkunova, Solovchenko and Pogosyan2003), FRI for flavonols content (Merzlyak et al., Reference Merzlyak, Gitelson, Chvkunova, Solovchenko and Pogosyan2003) and WRI for the water stress (Prasad et al., Reference Prasad, Carver, Stone, Babar, Raun and Klatt2007). For the ease of interpretation and presentation of material as calculation formulas PRI, ARI and FRI, special constants were introduced (Kanash et al., Reference Kanash, Panova and Blokhina2013) and modified formulas of reflection indexes were used: PRImod, ARImod and FRImod. Values of constants are determined by experiment and usually are equal 0.7. Calculation formulas of reflectance indexes listed above, their association with the net productivity of plants and examples of their use for the assessment of their physiological condition and stability were considered earlier (Kanash and Osipov, Reference Kanash and Osipov2009; Kanash et al., Reference Kanash, Panova and Blokhina2013). Statistical data processing was performed using MS Excel 2010 and Statistica 8 programs. The effect size of a factor η 2 (nitrogen supply and short-term soil drought) is determined on a percentage basis as a relation between the respective sum of squared deviations of examined optical and biometric parameters from their average values and the total sum of squares.
Results and discussion
Insufficient watering led to the reduction of water content in leaves and stems, notably pronounced at a soil water content equal to 30% of TFC. With lower levels of nitrogen supply (LN) the loss of water by leaves at 50% of TFC was 32%, while at 30% of TFC it came up to 58%. The higher level of nitrogen supply led to the reduction of water losses by plants during short-term soil drought. The loss of water by leaves at higher levels of nitrogen supply was reduced by 11% and 9% at soil water content of 50% and 30% of TFC, respectively.
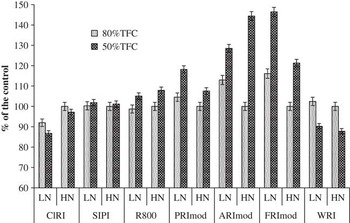
Soil drought and nitrogen deficiency caused an increase in the reflectance of leaves in the whole spectral range measured (300 to 1000 nm), which under the impact of drought was most considerable in the near infra-red region of the spectrum. Changes of reflection indexes characterizing the intensity and efficiency of the photosynthesis mechanism (SIPI, PRImod, ARI, FRI) also indicate that low level of nitrogen supply and short-term soil drought caused plant stress (Fig. 1).
Changes of reflection indexes in wheat leaves (cv. Krasnoufimskaya 100) under nitrogen deficiency and after short-term soil drought. The level of nitrogen nutrition: LN – low nitrogen content, HN – high nitrogen content. Water supply: 80% of TFC and 50% of TFC (moderate soil drought). The control: HN, 80% of TFC.

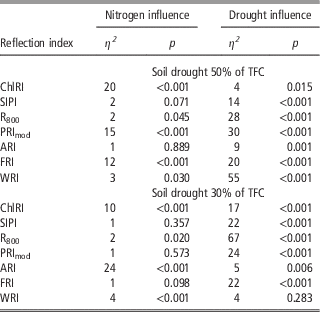
The comparison of reflectance indexes has shown that spectral characteristics of leaves change differently in conditions of nitrogen deficiency and short-term soil drought. The main symptom of nitrogen starvation of plants is well known. It is the chlorosis of leaves, mainly of lower levels, caused by the loss of chlorophyll. The spectra of the radiation reflected by fully grown higher level leaves were also registered, and the decrease of ChlRI indicated a positive chlorophyll loss (Fig. 1). Values of factorial influence of nitrogen deficiency and low soil moisture content (30% and 50% TFC) for ChlRI and other reflection indexes are presented in Table 1. ChlRI is the only one of the examined indexes only slightly affected by moderate (50% of TFC, with water loss by leaves 32%) soil drought (η 2 =4%). Drozdova et al. (Reference Drozdova, Pustovoitova, Dzhibladze, Barabanshchikova, Zhdanova, Maevskaya and Bukhov2004) and Nikolaeva et al. (Reference Nikolaeva, Maevskaya, Shugaev and Bukhov2010) have also disclosed a relative stability of wheat green pigment mechanism to dehydration and steady functioning of the electron transfer chain of photosynthesis under conditions of moderate soil drought.
The efficiency of influence of nitrogen deficiency and short-term soil drought on the reflection indexes of wheat leaves

Note: η 2 – effect size of a factor, p – significance of factorial influence.
Differences in plants’ reaction to nitrogen and soil moisture deficiency may be also observed by evaluating the efficiency of the factorial influence exerted by the examined stress factors on SIPI, R800, ARImod, and WRI. It has been discovered that the efficiency of the influence of moderate soil drought on the indexes mentioned is great (55% with WRI, 28% with R800, 15% with SIPI, and 9% with ARImod) and considerably exceeds the efficiency of influence of nitrogen deficiency. In our experiment with moderate soil drought, a significant influence of nitrogen deficiency on SIPI and ARImod was not observed, and Eta squared effect size on R800 and WRI was not high (3% and 2%, respectively). Soil drought had the largest effect on the radiation dispersion index R800 and especially the water index - WRI. Both stress factors, soil drought and nitrogen deficiency, enhanced thermal dissipation (PRImod increase) and flavonols accumulation (FRI increase). Chlorophyll content was reduced by both a low level of nitrogen supply and severe drought (30% of TFC, water loss by leaves up to 60%). Light diffusion index R800 (η 2=67%) was significantly influenced by soil drought (30% of TFC). However, under considerable dehydration of leaves caused by soil drought, significant changes of WRI were not found (Table 1).
The comparison of η 2 values of nitrogen deficiency and of soil drought suggests that η 2 is more strongly affected by 7-day soil drought than by low level of nitrogen supply (Table 1). Under moderate soil drought, nitrogen deficiency influenced primarily ChlRI, while soil drought affected SIPI, R800, ARImod and WRI. In conditions of a more severe soil drought, the values of all examined reflection indexes, except that of WRI, change significantly. It may be concluded that in moderate soil drought conditions WRI can be a reliable criterion in assessing water status of plants. However, if plants suffer from severe water deficiency and leaves are losing a major portion of water, this parameter – in contrary to R800 – changes insignificantly.
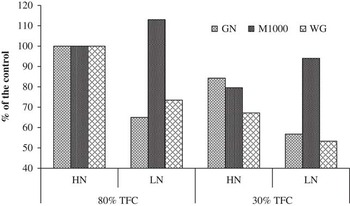
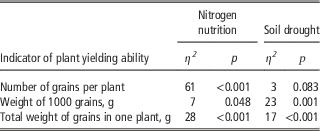
As might be expected, low level of nitrogen supply resulted in considerable losses of grain produced per plant, mainly due to a lower number of grains in a head (η2=61%). Despite the fact that grains formed in LN variant were bigger than those of HN variant, it only partially compensated for the decrease of total weight of grains from one plant (Fig. 2, Table 2). Short-term soil drought (30% of TFC) to which the plants were subjected during the period from booting completion till the beginning of earing stage, as well as nitrogen deficiency, decreased the wheat yield. When in LN variant soil moisture content was equal to 80% of TFC, the loss of the yield amounted to 27%.
Changes of wheat yield under nitrogen deficiency and after short-term soil drought. Control: HN, 80% of TFC. GN – number of grains in one plant, M1000 – weight of 1000 grains, WG – total weight of grains in one plant.

The efficiency of influence of nitrogen deficiency and short-term soil drought on the yielding ability of wheat

Note: η 2 – effect size of a factor, p – significance of factorial influence. Soil drought 30% of TFC, 7 days.
Short-term soil drought in nitrogen deficiency conditions caused the loss of more than 47% of grain yield. The efficiency of soil drought influence on the number of grains formed in one plant was very low (3%) and not significant (Table 2), which is not surprising because prior to the drought period the plants had already gone through the stages of organogenesis when the structures determining the value of “grain number” had been formed. A lower crop yield of the plants exposed to drought was the result of a small size of seeds developed. The extent of the drought influence η 2 on the value of “1000 grains weight” was equal to 23%, whereas η 2 of nitrogen deficiency was 7%.
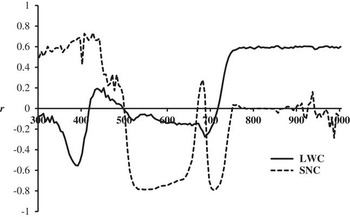
The changes in radiation absorption, and hence in its reflection in the near infrared region is a characteristic response of plant leaves to changing water status. Fig. 3 demonstrates the dynamics of the correlation coefficient r between the reflectivity of leaves in the radiation region of 300 to 1000 nm and water content in leaves, as well as between leaf reflectivity and the amount of nitrogen fertilizer applied before sowing. The correlation coefficient between water content in leaves and their reflection was the highest in the regions of 380 to 400 nm and 760 to 1000 nm, while the correlation coefficient between nitrogen content in the soil (the level of nitrogen supply) and the reflectivity of leaves reached its maximum in the radiation regions of 405 to 445 nm, 510 to 645 nm and 695 to 730 nm. Calculation formulas of reflection indexes applied in our study include reflection coefficients for wavelengths with the highest r (the region of 380 to 400 nm is an exception ignored in all indexes). The reflectivity of leaves in the 760 to 1000 nm region and particularly the light diffusion index R800 vary with the inner structure of the leaf, the size of the cells and organelles and above all with the magnitude of intercellular air space and the ratio between mesophyll surface area and leaf surface area (Sims and Gamon, Reference Sims and Gamon2002). The loss of water by leaves after a short-term soil drought is accompanied by turgor decline which is a protective reaction of plants against dehydration. This response to drought is particularly pronounced in drought-resistant varieties (Quartacci et al., Reference Quartacci, Pinzino, Sgherri and Navarri-Izzo1995; Lizana et al., Reference Lizana, Wentworth, Martinez, Villegas, Meneses, Murechie, Pastenes, Lercari, Vernieri, Horton and Pinto2006). Water deficiency not only retards the growth and development of leaves, but also reduces their life span (Alishah and Ahmadikhah, Reference Alishah and Ahmadikhah2009). Along with growth retardation, water deficiency usually causes leaf roll which is commonly interpreted as an adaptive morphological mechanism decreasing the transpiration intensity and maintaining sufficient water content in tissues (Srivalli et al., Reference Srivalli, Sharma and Khanna-Chopra2003). The above-mentioned peculiarities of plant reaction to soil water deficiency may be responsible for inaccurate assessment of plant nitrogen status when monitoring in arid regions or in growing seasons where drought is experienced. In case of remote sensing of a plant canopy the investigated areas suffering most severely from water deficiency will be identified, due to leaf roll and turgor decline, as well as those with decreased leaf area index (LAI) which is a characteristic symptom of “nitrogen starvation”.
The correlation relationship between reflectance at each wavelength and both leaf water content (LWC) and soil nitrogen content (SNC) in the region of 300–1000 nm. The abscissa is the wavelength (nm), the ordinate is the correlation coefficient between the parameters examined. r≥0.4 is significant for LWC ( p≤0.037) and SNC (p≤0.001).

Conclusion
The results obtained testify that optical methods are a promising tool for investigating the plant response to soil drought and nitrogen deficiency and for improving diagnostic methods of a plants physiological state. Significant variations in optical properties of plants affected by nitrogen and water deficiency indicate that it is worthwhile to develop technologies of crop canopy monitoring that allow the detection not only of an area with suppressed plants, but also the stress factor that has caused the suppression. For a reliable estimation of plant fertilizer requirements it is necessary to use several optical criteria. Nonspecific and specific changes of plant optical characteristics arising from nitrogen and water deficiency can form a basis of a problem-oriented database for crop monitoring in precision agriculture technologies.