INTRODUCTION
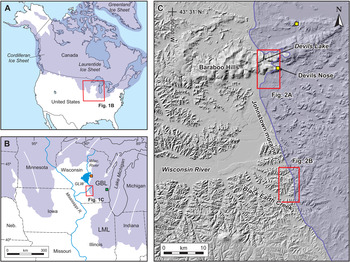
During the past several decades, significant efforts have been made to constrain the chronology for the maximum extent of the various lobes of the Laurentide Ice Sheet (LIS) in the upper Midwest of the United States (Clayton and Moran, Reference Clayton and Moran1982; Mickelson et al., Reference Mickelson, Knox and Clayton1982; Attig et al., Reference Attig, Clayton and Mickelson1985, Reference Attig, Hanson, Rawling, Young and Carson2011; Maher and Mickelson, Reference Maher and Mickelson1996; Syverson and Colgan, Reference Syverson, Colgan, Ehlers, Gibbard and Hughes2011; Carson et al., Reference Carson, Hanson, Attig and Young2012a; Ullman et al., Reference Ullman, Carlson, LeGrande, Anslow, Moore, Caffee, Syverson and Licciardi2014; Curry et al., Reference Curry, Lowell, Wang, Anderson, Kehew and Curry2018; Heath et al., Reference Heath, Loope, Curry and Lowell2018). While the LIS likely has the largest inventory of numeric ages (in the form of radiocarbon, optically stimulated luminescence [OSL], and cosmogenic exposure dating) of any major ice sheet, very few of the available dates address the timing and behavior of ice at its absolute maximum position. This is particularly the case for lobes of the LIS in Wisconsin (Fig. 1), where permafrost conditions inhibited the growth of large, woody vegetation before and for several thousands of years after the peak of the late Wisconsin (Marine Isotope Stage [MIS] 2) glaciation (Clayton et al., Reference Clayton, Attig and Mickelson2001; Batchelor et al., Reference Batchelor, Orland, Marcott, Slaughter, Edwards, Zhang, Li and Cheng2019). This is illustrated by the work of Heath et al. (Reference Heath, Loope, Curry and Lowell2018), which presented a compilation of more than 500 radiocarbon, OSL, and cosmogenic ages from the southern LIS addressing the advance and retreat of various lobes of the LIS. Despite the size of the data set, not a single numeric date was available to tightly constrain the end of the advance of the Green Bay Lobe (GBL) or any lobe immediately to the north in Wisconsin. This study seeks to address this gap in our knowledge. Continued refinement of the absolute chronologies of advance and retreat of lobes of the LIS will improve our understanding of ice dynamics (synchronous vs. asynchronous behavior of adjacent lobes) and response of the southern margin of the LIS to hemispheric or global climate change.
Study area. On all maps in Figures 1 and 2, purple shading indicates glaciated area. (A) Southern margin of the Laurentide Ice Sheet (LIS) in the U.S. Midwest. (B) U.S. Midwest, showing the MIS 2 maximum extent of the LIS with generalized flow lines in white. Relevant lobes of the LIS: GBL, Green Bay; LML, Lake Michigan. The Wisconsin River flows south through the central portion of Wisconsin and was dammed during the MIS 2 glaciation to form glacial Lake Wisconsin (GLW). Orange square identifies study area of Ceperley et al. (Reference Ceperley, Marcott, Rawling, Zoet and Zimmerman2019), green square identifies study area of Carlson et al. (Reference Carlson, Tarasov and Pico2018). (C) Baraboo Hills and Wisconsin River valley, showing extent of GBL in the area. The maximum extent of all glaciations in the study area is marked by the MIS 2 “Johnstown moraine.” Red boxes identify locations of detailed maps in Figure 2. Yellow squares identify sampling sites for Ullman et al. (Reference Ullman, Carlson, LeGrande, Anslow, Moore, Caffee, Syverson and Licciardi2014). (For interpretation of the references to color in this figure legend, the reader is referred to the web version of this article.)

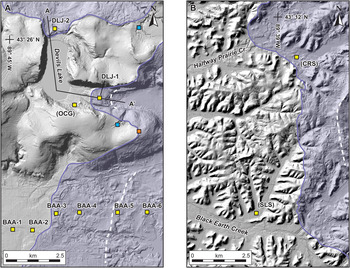
Detail maps of study areas. (A) Devils Lake gorge, which cuts through the Baraboo Hills. Coring sites as discussed in text are identified by yellow squares: BAA, Badger Army Ammunition; DLJ, Devils Lake Johnstown; OCG, Old Campground. A–A′ line locates cross section in Figure 3. Orange square identifies sampling site for Ullman et al. (Reference Ullman, Carlson, LeGrande, Anslow, Moore, Caffee, Syverson and Licciardi2014) at Devils Nose. Blue squares identify sampling sites for Attig et al. (Reference Attig, Hanson, Rawling, Young and Carson2011). Core stratigraphy is shown as follows: DLJ, Figure 3; OCG, Figure 4; BAA, Figure 5A. (B) Halfway Prairie Creek and Black Earth Creek, tributaries to the lower Wisconsin River south of the Baraboo Hills. Coring sites as discussed in text are identified by yellow squares: CRS, Cross Plains; SLS, Swamplovers. Core stratigraphy for CRS and SLS is shown in Figure 5B and C, respectively. In both images, white dashed lines identify pre-maximum ice-marginal positions behind the MIS 2 maximum. (For interpretation of the references to color in this figure legend, the reader is referred to the web version of this article.)

Stratigraphy and interpretation of rotosonic cores in the Devils Lake gorge moraines. (A) Interpretive cross section in Devils Lake gorge as identified in Figure 2A, showing relationships of sediment in the gorge. (B) Core DLJ-1 from the south end of the Devils Lake gorge, showing interpreted sediments on right and grain-size data on left. OSL age estimates shown in gray italics. (C) Core DLJ-2 from the north end of the Devils Lake gorge, showing interpreted sediments on right and grain-size data on left. The colors used with the stratigraphic interpretations are also used in Figures 4 and 5.

OCG (Old Campground) core from bench of sediment at the south end of the Devils Lake gorge, showing interpreted sediments on right and grain-size data on left. accelerator mass spectrometry (AMS) radiocarbon ages shown in black; optically stimulated luminescence (OSL) age estimates shown in gray italics.

(A) Description of cores (top) and interpreted local stratigraphy (bottom) for Badger Army Ammunition transect immediately to the south of the Baraboo Hills. (B) CRS core from Halfway Prairie Creek, showing interpreted sediments on right and grain-size data on left. (C) SLS core from Swamplovers site, showing interpreted sediments on right and grain-size data on left. accelerator mass spectrometry (AMS) radiocarbon ages shown in black; optically stimulated luminescence (OSL) age estimates shown in gray italics; ages with asterisks are from Carson et al. (Reference Carson, Hanson, Attig and Young2012a).

The various lobes of the southern LIS terminate on a variety of geomorphic settings. Several lobes terminate on low-relief landscapes formed from glaciogenic sediment from earlier Quaternary glaciations, which limits the likelihood of preserving chronological data regarding the timing of advance and retreat right at the maximum position. However, some lobes—including parts of the Superior, Chippewa, Wisconsin Valley, Green Bay, and Saginaw Lobes (Fig. 1)—terminated at or near enough to the maximum extent of all Quaternary glaciations that the glacial margins intersected a more varied topographic and geomorphic surface. Recent researchers (e.g., Attig et al., Reference Attig, Hanson, Rawling, Young and Carson2011; Carson et al., Reference Carson, Hanson, Attig and Young2012a; King et al., Reference King, Robinson and Finch2014; Schaetzl et al., Reference Schaetzl, Lepper, Thomas, Grove, Treiber, Farmer and Fillmore2017) have demonstrated that this variety of geomorphic settings provides enhanced opportunities for preserving information about the timing and nature of ice advance and retreat at the maximum position.
The southern portion of the GBL is a striking example of a lobe of the LIS that abutted a wide range of geomorphic and depositional settings. Within a stretch of ~40 km, the maximum position of the glacier contacted high-relief uplands composed of Precambrian quartzite, the broad lower Wisconsin River valley, and a deeply incised Paleozoic sedimentary sequence exposed at the earth's surface of a terrain unglaciated beyond the MIS 2 maximum position. Here, we present stratigraphic and chronological data from a spectrum of depositional settings that provide new insight into (1) the behavior of the GBL as it neared the MIS 2 maximum position; (2) the timing of the end of advance of the GBL; and (3) the behavior of the GBL at the start of retreat from the maximum position. Coupled with previously published data from this area, we present a refined view of the chronology and dynamics of the GBL at and near its MIS 2 maximum extent.
GEOGRAPHIC AND GEOLOGIC SETTING
The GBL of the Laurentide Ice Sheet flowed southwestward from the Green Bay–Lake Michigan lowland to cover the south-central and eastern portions of Wisconsin during the MIS 2 glaciation (Fig. 1B). The southern margin of the GBL intersects several prominent landscape/geomorphic features at its margin: the Baraboo Hills, a prominent upland formed by resistant quartzite; the broad valley of the lower Wisconsin River; and deeply incised Paleozoic sedimentary rocks. In this area, the Johnstown moraine marks the maximum MIS 2 ice position (Chamberlin, Reference Chamberlin1883; Alden, Reference Alden1918; Martin, Reference Martin1932; Mickelson et al., Reference Mickelson, Knox and Clayton1982; Fig. 1C).
The Baraboo Hills are composed of the resistant late Proterozoic Baraboo quartzite (Dalziel and Dott, Reference Dalziel and Dott1970; Medaris et al., Reference Medaris, Singer, Dott, Naymark, Johnson and Schott2003) and form a prominent topographic high, rising as much 200 m above the surrounding terrain. The South Range of the Baraboo Hills is cut by the 6-km-long, 1-km-wide Devils Lake gorge. In situ sandstone deposits in the gorge demonstrate that it was cut before the late Cambrian (Salisbury and Atwood, Reference Salisbury and Atwood1900; Trowbridge, Reference Trowbridge1917). Moraines dam the gorge at both ends, though the central portion of the gorge was apparently never glaciated (Salisbury and Atwood, Reference Salisbury and Atwood1900; Trowbridge, Reference Trowbridge1917; Attig et al., Reference Attig, Clayton and Mickelson1985; Clayton and Attig, Reference Clayton and Attig1989, Reference Clayton and Attig1990); these moraine dams form Devils Lake, which has persisted since the end of local glaciation (Fig. 1C). At least 120 m of Pleistocene sediment fills the gorge, and the walls of the gorge rise at least another 150 m above the surface of Devils Lake; talus slopes of the Baraboo quartzite extend down the walls of the gorge to lake level in many places within the gorge.
The Wisconsin River flows south across much of Wisconsin. At the Baraboo Hills, the river diverts around the east end of the range. On the south side of the range, the river occupies the broad lower Wisconsin River valley and flows west to its confluence with the Mississippi River (Fig. 1). Advancing ice of the GBL dammed the Wisconsin River by overrunning the east end of the Baraboo Hills and blocking the Devils Lake gorge, forming the expansive glacial Lake Wisconsin (Fig. 1B) (Warren, Reference Warren1874; Chamberlin, Reference Chamberlin1883; Clayton and Attig, Reference Clayton and Attig1989, Reference Clayton and Attig1990) and a host of smaller lakes. The main basin of glacial Lake Wisconsin occupied a broad area to the north of the Baraboo Hills, although smaller basins of the lake occurred in the central lowland of the Baraboo Hills in proximity to Devils Lake.
In the study area, the MIS 2 advance of the GBL marked the greatest regional advance of any Quaternary glaciation. Extending to the west across southwestern Wisconsin is the unglaciated “Driftless Area,” so named for the lack of glacial sediment (Alden, Reference Alden1918; Cline, Reference Cline1965; Olcott, Reference Olcott1972; Clayton and Attig, Reference Clayton and Attig1997; Knox, Reference Knox, Carson, Rawling, Daniels and Attig2019). In the study area, nearly flat-lying Paleozoic sedimentary strata were deeply dissected by fluvial incision before the Quaternary glaciations. While this regional incision is largely obscured behind (to the east of) the glacial margin due to the thick mantle of glacial sediment, it is the defining characteristic of the landscape south and west of the glacial margin.
Study sites
Devils Lake gorge
The advance of the GBL across the eastern end of the Baraboo Hills created a convoluted glacial margin in the vicinity of the Devils Lake gorge. While the Johnstown moraine is often no more than a few meters high throughout the study area (Clayton and Attig, Reference Clayton and Attig1990, Reference Clayton and Attig1997), it is much larger both in terms of topographic relief and volume where it crosses the north and south ends of Devils Lake gorge. Where the moraine crosses the north end of the gorge, it rises ~25 m above the surface of Devils Lake, 45 m higher than the glaciated terrain immediately north of the gorge; where the moraine crosses the south end of the gorge, it is as much as 60 m higher than the glaciated terrain south of the gorge. The moraine is as much as 600 m wide in the two places where it crosses the gorge. Where the moraine crosses the south end of Devils Lake gorge, it has a flat surface that is roughly 300 m wide with a 2 to 3 m ridge of sediment superimposed on it and scattered kettle hole depressions on the surface. Visual inspection of the moraine at the north end of the gorge where the outlet from Devils Lake cuts through the moraine indicates that it is composed of cobbly diamicton interpreted to be till. No similar exposure occurs in the moraine at the south end of the gorge. While Lundqvist et al. (Reference Lundqvist, Clayton and Mickelson1993) evaluated the stratigraphy and sedimentology of the Johnstown moraine in the vicinity of the Baraboo Hills, little is known about the subsurface stratigraphy of these two prominent sections that block the ends of the Devils Lake gorge.
Ice blocked both ends of the gorge but did not cover the upland surfaces immediately to the east and west of the gorge (Fig. 2A). Ice that blocked the north end of the gorge separated Devils Lake at its full glacial stage from the larger glacial Lake Wisconsin. When the GBL was at its maximum position, the elevation of Devils Lake was raised by at least 27 m relative to the modern lake level, as inferred from the upper limit of erratic boulders found in the quartzite talus on the west bluff of the gorge (Salisbury and Atwood, Reference Salisbury and Atwood1900). Following retreat of MIS 2 ice from the north and south ends of the gorge, the lake level fell to its modern level as a result of downcutting through the moraine at the north end of the gorge. Several discrete bench surfaces can be found within the impounded portion of the Devils Lake gorge roughly 15 to 18 m above the modern lake level (see Supplementary Material). Among these is a linear bench that extends along the base of the north-facing talus slope in the southwest corner of the gorge. The talus presumably extends for some distance below the ground surface and is buried by the late Quaternary sediment that forms the bench.
Wisconsin River valley
Immediately south of the Baraboo Hills, the Johnstown moraine crosses the broad valley of the Wisconsin River (Figs. 1C and 2A). Straddling the Johnstown moraine in the river valley is the site of the former Badger Army Ammunition plant, a facility that was used by the U.S. Army for production of munitions. The decommissioning of the plant, with ownership being returned to several local entities, allowed public access to the property for the first time in more than half a century. As mapped by Clayton and Attig (Reference Clayton and Attig1990), the eastern portion of the former plant is characterized by till of the GBL that is meters to tens of meters thick; the central portion of the area contains thicker till forming the Johnstown moraine, and the western portion of the area is composed of sand and gravel outwash sourced from the adjacent GBL. Lundqvist et al. (Reference Lundqvist, Clayton and Mickelson1993) described the stratigraphy in a pit exposure into the Johnstown moraine immediately south of the Badger Army Ammunition property. They reported a mix of water-lain sediment interpreted to have been deposited in an esker and till, all deposited on the same outwash that extends westward beyond the moraine.
Tributaries to the Wisconsin River
West of the Johnstown moraine and south of the Wisconsin River, the landscape is dominated by a preglacial fluvial incision into the Paleozoic sedimentary rocks. Individual tributary valleys contain a range of sediments depending on local relation to the ice margin (Fig. 1C). All the tributaries in the area were at least partially dammed by aggrading outwash on the Wisconsin River, thus forming small slack water lakes in the valleys (Clayton and Attig, Reference Clayton and Attig1997). The headwaters of some of these tributary valleys were also glaciated, creating more complicated interplay between slack water and proglacial sedimentation (Carson et al., Reference Carson, Hanson, Attig and Young2012a). This includes the informally named “Swamplovers” site and Halfway Prairie Creek (Fig. 2B).
Black Earth Creek is one such westward-flowing tributary of the Wisconsin River (Fig. 1C). Black Earth Creek valley is filled with 30 m or more of outwash that emanated from its glaciated headwaters. As documented in Carson et al. (Reference Carson, Hanson, Attig and Young2012a), ice of the GBL advanced into the headwaters of a few of Black Earth Creek's tributaries, including the Swamplovers site valley, only at the very maximum extent of glaciation—significantly later than when ice had advanced into Black Earth Creek. This resulted in several tributary valleys containing a stratigraphy characterized by pre–maximum slack water lacustrine sediment, overlain by outwash or till from the glacial maximum, which in turn is overlain by post–maximum slack water lacustrine sediment. In one such valley, Carson et al. (Reference Carson, Hanson, Attig and Young2012a) presented OSL age control from samples collected within and immediately below the maximum-stage outwash and accelerator mass spectrometry (AMS) radiocarbon age control from plant macrofossils in the postglacial lacustrine sediment from the Swamplovers site. These data indicate that ice was at the maximum position at 21.4 ± 3.3 ka and had retreated by 17.0 ka.
METHODS
Field methods
Coring was conducted with a combination of Geoprobe direct-push coring and rotosonic drilling. Geoprobe coring collects continuous 4.5-cm-diameter cores; multiple cores at an individual site were collected as needed from within an ~2-m radius to ensure sufficient sample recovery. Coring was conducted with rotosonic drilling at the two sites where deeper sampling than possible with Geoprobe coring was desired; this method collected continuous 10-cm-diameter cores. Detailed information regarding coring sites is available in the Supplementary Material. Samples for OSL dating were collected using black-coated Geoprobe core liners or by sampling from rotosonic cores using brass tubes. Cores were transported to the Wisconsin Geological and Natural History Survey's Mount Horeb Core Repository and Education Center in Mount Horeb, WI, where they were stored in refrigeration before sampling and description.
Laboratory methods
Grain-size analysis to show general stratigraphic relationships was conducted by laser diffraction (Miller and Schaetzl, Reference Miller and Schaetzl2012) using a Malvern Mastersizer 2000E located in the Department of Geosciences at the University of Wisconsin–Milwaukee. We used a clay/silt boundary of 8 microns to avoid problems with systematic underestimation of clay compared with pipette and hydrometer methods (Konert and Vandenberghe, Reference Konert and Vandenberghe1997; Wen et al., Reference Wen, Aydin and Duzgoren-Aydin2002). Complete grain-size data, including sand–silt–clay distribution using both 8 micron and 2 micron division, are available in the Supplementary Material.
OSL samples were analyzed at the Luminescence Geochronology Laboratory at the University of Nebraska–Lincoln. We used OSL dating procedures similar to those used by Attig et al. (Reference Attig, Hanson, Rawling, Young and Carson2011) and Carson et al. (Reference Carson, Hanson, Attig and Young2012a) on samples of lacustrine sediment from the Baraboo Hills and Black Earth Creek areas (see Fig. 2B). Quartz grains were isolated by sieving, floatation in heavy liquid, and treatments in hydrofluoric and finally hydrochloric acid to etch quartz grains and remove feldspars. OSL measurements were made on a Risø model DA 20 TL/OSL reader equipped with a 90Sr/90Y beta source. De values were determined through the use of the SAR method (Murray and Wintle, Reference Murray and Wintle2000), which was run using six beta doses that included a zero dose and one repeated dose. OSL signals were measured for 40 s at 125°C. Each aliquot contained approximately 150 to 250 grains, 90–150 μm diameter, that were mounted to the inner 2 mm of the 1-cm disk. This “small aliquot” procedure was done to limit the potential impact of partial bleaching on our samples. A preheat temperature of 220°C was determined using a preheat plateau test (Wintle and Murray, Reference Wintle and Murray2006), and a cut heat temperature of 160°C was used for test doses. OSL signals for natural dose, regenerative doses, and test doses were integrated using the first four channels of the shinedown after subtracting the background signal calculated from averaging the last 31 channels measured. Individual aliquots were rejected if they had measurable signals when exposed to IR diodes, recycling ratios that were > ±10%, or if they had De values that were greater than the highest regenerative dose. Final age estimates were based on at least 32 accepted aliquots. Environmental dose-rate estimates were determined using the concentrations of K, U, and Th as determined by high-resolution gamma spectrometry. The cosmogenic component of the dose rate was calculated using equations from Prescott and Hutton (Reference Prescott and Hutton1994), and the final dose-rate values were calculated following equations from Aitken (Reference Aitken1998). OSL age estimates are reported with 1σ uncertainty.
Samples for radiocarbon dating were collected from Geoprobe cores; sampling was limited to conifer needles and leaf and stem fragments from riparian species. All radiocarbon dating was conducted by Beta Analytic, Inc. Samples were rinsed in deionized water and screened to isolate plant macrofossils. Isolated samples were washed in hot HCl to eliminate carbonates, then washed in NaOH to remove secondary organic acids, and finally rinsed in HCl to neutralize the solution. Analysis was conducted using AMS. Radiocarbon ages were calibrated using Calib v. 7.1 (Stuiver et al., Reference Stuiver, Reimer and Reimer2019). Calibrated ages are reported with 2σ uncertainty and calculated median age; for clarity and brevity, the calculated median ages are used in the text.
RESULTS
Johnstown moraine at the Devils Lake gorge (end of GBL advance dynamics)
Rotosonic cores were collected from the two locations where the Johnstown moraine crosses the Devils Lake gorge (“DLJ-1” for the core where the moraine crosses the south end of the gorge and “DLJ-2” for the core where the moraine crosses the north end of the gorge on Fig. 2A). Core DLJ-1, at the south end of the gorge, was located on the crest of the moraine. The core penetrated a total depth of 84 m before lack of sample retrieval terminated coring; the core did not intersect bedrock, but did penetrate to a depth ~57 m lower than modern level of Devils Lake. The top 3 m of the core were medium-brown matrix-supported sand and silt with pebbles and cobbles, interpreted as till. The remaining 81 m of core was coarse, massive sand and gravel, interpreted as outwash. Two distinct layers of well-sorted fine sand occurred at 52–57 m depth and 77–80 m depth. Because of the sorting and grain size, we interpreted those layers to represent short-lived proglacial lakes. OSL samples were collected from the higher and lower sand layers and returned age estimates of 34.3 ± 4.4 ka (UNL-3674) and 45.3 ± 6.2 ka (UNL-3675), respectively, although the analytical data suggest those age estimates are affected by partial bleaching (Table 1). The “moraine” blocking the south end of the Devils Lake gorge likely represents a head of outwash where sand and gravel aggraded in front of the ice margin. The thin cap of till at the coring site likely represents a late advance of ice out over top of the outwash deposit before deglaciation.
Equivalent dose, dose rate data, and OSL age estimates for Devils Lake gorge samples.

a Assumes 100% error in estimated moisture content.
b Central age model (Galbraith et al., Reference Galbraith, Roberts, Laslett, Yoshida and Olley1999).
c Accepted disks/all disks.
d Overdispersion.
Core DLJ-2 (Fig. 3), at the north end of the gorge, was located ~200 m north of the crest of the moraine and in the gap cut through the moraine by the stream that drains Devils Lake. As such, the top of the core was ~5.5 m below modern lake level and penetrated a total depth of 58 m. The crest of the moraine is ~30 m higher than the surface elevation of the coring site. The top 21 m of the core were medium-brown matrix-supported sand and silt with pebbles and cobbles (till), similar in appearance to the near-surface sediment in core DLJ-1. Visual inspection and hand trenching along the slope from coring site DLJ-2 to the crest of the moraine indicate the moraine at the surface is composed of similar sediment as the top 21 m of the core that was interpreted to be till. Beneath the till is ~21 m of laminated silt with prominent lenses of sand, interpreted as ice-proximal lacustrine sediment. Underlying the lacustrine sediment is ~8 m of sand and gravel, interpreted as outwash.
Taken together, the two rotosonic cores from the Devils Lake moraine indicate that ice of the GBL blocked the south end of the gorge before blocking the north end of the gorge (Fig. 3). The laminated silt in core DLJ-2 from the north end of the gorge indicates a glacial lake existed that incorporated the Devils Lake gorge and areas to the north (glacial Lake Wisconsin). Subsequent blockage of the north end of the gorge, isolated glacial-stage Devils Lake from the larger glacial Lake Wisconsin.
Benches in Devils Lake gorge (end of GBL advance chronology)
Prominent benches of sediment with surfaces 15 to 18 m above the modern Devils Lake level can be found at several locations in the Devils Lake gorge. Multiple Geoprobe cores (“OCG” on Fig. 2A), were spaced within 1 m of each other and penetrated 8.9 m, where the buried slope of Baraboo quartzite talus was encountered (Fig. 4). The stratigraphy from the cores consisted of ~15 cm of weathered quartzite lying immediately on the quartzite talus, with ~10 cm of brown cobbly sand above that. At the top of the cobbly sand is a sharp contact with a few centimeters of dark-gray sand that transitions into ~1.8 m of dark-gray laminated silty clay containing conifer needles. At ~7 m depth, the dark-gray silty clay transitions into medium-brown laminated silt that continues to the base of the soil horizon less than 1 m from the surface. The surface where the core was collected is 18 m above the modern lake level, and the base of the core is 9.1 m above the modern lake level. This places the surface where the core was collected at least 9 m below the level of the lake at full-glacial stage as estimated by Salisbury and Atwood (Reference Salisbury and Atwood1900). Because the entire core is located below the glacial stage and above the modern (postglacial) lake level, and based on the fine-grained laminated character of the sediment, we interpret the core to represent lacustrine sedimentation during the discrete window of time when the lake was elevated due to the gorge being blocked at both ends by ice.
Plant macrofossils were confined to the dark-gray silty clay near the base of the core. A conifer needle from the base of that layer yielded an age of 24.7 cal ka BP (Beta-324034), and conifer needles from higher in the same unit yielded ages of 24.2 cal ka BP (Beta-324035) and 23.0 cal ka BP (Beta-322995) (Table 2). A single OSL sample from the laminated silt immediately above the two AMS radiocarbon samples yielded an age estimate of 19.2 ± 3.2 ka (UNL-3588) (Table 1). However, this age estimate coupled with the radiocarbon data from the same core does inform the time period during which the lake remained at its elevated stage. The base of this core is located ~9 m higher than modern (postglacial) level of Devils Lake. Deposition at this site could not have started until glacial ice dammed both ends of the gorge and formed the lake at its highest stage, and continued until the end of glaciation, when the lake level dropped to its modern level due to incision through the moraine at the north end of the gorge. The basal age of 24.7 ka can be confidently interpreted both as a closely limiting age for the timing of both ends of the gorge being blocked and Devils Lake rising to its highest (glacial) stage, and the 19.2 ± 3.2 ka constrains the time frame during which the lake remained at that elevated level.
Radiocarbon dates from Baraboo Hills and Black Earth Creek areas.

a Core locations can be found in Supplementary Table 1 and Supplementary Figure 1.
b Calibrated using Calib v. 7.1 (Stuiver et al., Reference Stuiver, Reimer and Reimer2019).
Wisconsin River valley and tributary sites (start of GBL retreat dynamics and chronology)
On the grounds of the Badger Army Ammunition plant and immediately to the east, six Geoprobe cores were collected in a 4-km east–west transect that crossed the Johnstown moraine (Fig. 2A). Based on previous mapping (Clayton and Attig, Reference Clayton and Attig1990) and inspection of LIDAR-derived topography, the cores were selected so that two of them were located on the outwash plain to the west of the moraine, one of them was located on the moraine, and three of them were located on the hummocky topography east of the moraine; samples were collected to a depth of up to 12 m. Sediment in the vicinity of the coring transect is almost exclusively medium-brown matrix-supported sand and silt with pebbles and cobbles, interpreted as till; and coarse sand and gravel, interpreted as outwash. The two western cores were entirely outwash, the two central cores were 5–6 m of till overlying outwash, and the two eastern cores were entirely till (Fig. 5A).
Geoprobe coring in Halfway Prairie Creek (“CRS” on Fig. 2B) was located ~1 km east of the Johnstown moraine. The core penetrated through ~2 m of matrix-supported brown silt with pebbles and cobbles, interpreted as till. Beneath the till is ~3 m of gray laminated silty clay, interpreted as lacustrine sediment. Finally, beneath the lacustrine sediment and extending to the base of coring at 16.8 m was coarse sand and gravel, interpreted as outwash (Fig. 5B).
Geoprobe coring conducted at the Swamplovers site (“SLS” on Fig. 2B) retrieved gray laminated silt and clay, interpreted as lacustrine sediment, with riparian plant species from beneath the maximum-stage outwash. Two samples yielded ages of 22.2 ka (Beta-407319) and 21.2 ka (Beta-407320) (Fig. 5C; Table 2). These dates are in stratigraphic agreement with the existing radiocarbon dates and OSL age estimates from this site (Carson et al., Reference Carson, Hanson, Attig and Young2012a). We interpret these ages to constrain the time that ice advanced into the headwaters of the Swamplovers valley, causing outwash to prograde down the valley over the pre-maximum lacustrine sediment.
Coring at Badger Army Ammunition plant, Halfway Prairie Creek, and Swamplovers site all indicate a similar behavior of the GBL while near its maximum position. In the immediate vicinity of all three coring sites, the geomorphology of the area suggests ice was stable at a position somewhat to the east of the local maximum before a final advance to the maximum position. At Badger Army Ammunition plant, this is documented by a hummocky ridge ~3 km east of the Johnstown moraine and a greater amount of hummocky topography and small-scale relief east of that ridge. At Halfway Prairie Creek and Swamplovers site, this is documented by a small (several meters tall) though recognizable ridge between 2 and 3 km east of the Johnstown moraine. These features are all indicated on Figure 2 by white dashed lines. The stratigraphy at all three locations is similarly indicative of stability at a position east of the Johnstown moraine followed by an advance to the maximum position. This is captured, in various forms, at the three coring sites by glacial sediment (till) overlying proglacial sediment (outwash or lacustrine sediment). At the Swamplovers site, the limiting radiocarbon age of 21.2 ka shows—at least at that site—that readvance to the maximum position occurred as much as 3500 years after the ice reached near its maximum position in the Devils Lake gorge at 24.7 ka.
The stratigraphy of the DLJ-2 core at the south end of Devils Lake corroborates this interpretation. The stratigraphy of more than 75 m of outwash indicates that ice was at a stable position somewhere immediately to the east of the coring site for a sufficient time to deposit the volume of sand and gravel needed to form the topographic expression of the “moraine.” The several meters of till, combined with the small ridge to the west of the coring site, indicate an advance of ice following deposition of the landform.
DISCUSSION
Establishing precise geochronological control for the end of advance and the start of retreat for the GBL and nearby lobes of the Laurentide Ice Sheet has long been an elusive goal, largely resulting from the lack of datable organic material associated with MIS 2 deposits (e.g., Clayton et al., Reference Clayton, Attig and Mickelson2001; Syverson and Colgan, Reference Syverson, Colgan, Ehlers, Gibbard and Hughes2011). However, the stratigraphy revealed by coring presented here combined with the radiocarbon and OSL chronology provide the ability to confidently correlate ages to discrete glacial events to refine our understanding of chronology and dynamics for the end of advance and start of retreat of the GBL. The results are consistent with similar recent work along the GBL (Attig et al., Reference Attig, Hanson, Rawling, Young and Carson2011; Carson et al., Reference Carson, Hanson, Attig and Young2012a, Reference Carson, Hanson, Attig and Young2012b).
Control on the end of the Green Bay Lobe's advance
The history of the glacial lake in the Devils Lake gorge is intimately associated with the maximum position of the GBL. The occurrence of the lake required ice to dam both ends of the gorge but not overrun the central portions of the gorge or the highlands to the east and west; this was also required for Devils Lake to rise to a higher level than glacial Lake Wisconsin, as documented by Salisbury and Atwood (Reference Salisbury and Atwood1900). The stratigraphy of the two rotosonic cores from the Johnstown moraine indicates that the south end of the gorge was blocked first. The available OSL ages of 34.3 ± 4.4 ka and 45.3 ± 6.2 ka provide limited information due to the small sample size and issues with potential partial bleaching. However, they do suggest the possibility that the southern GBL was nearing its maximum position significantly earlier than when it attained the Johnstown moraine position. Blockage of the north end of the gorge caused Devils Lake to rise to a level only attained while ice was at the MIS 2 maximum. Thus, the basal radiocarbon age of 24.7 cal ka BP from the lacustrine sediment in the Devils Lake gorge, supported by the stratigraphy of the two cores through the Johnstown moraine there, provides the first numeric age that can be unequivocally correlated to provide a close limiting age on the end of advance of the southern GBL.
The Green Bay Lobe at and near its maximum position
Cores from the Badger Army Ammunition plant, Halfway Prairie Creek, and Swamplovers sites all reveal a consistent stratigraphic record of a glacial advance just before wide-scale retreat. Combined with the geomorphology at the coring sites, the stratigraphy suggests the GBL attained a stable position near—but not at—its local maximum as marked by the Johnstown moraine. The radiocarbon chronology from the Swamplovers site indicates that this final advance occurred sometime after 21.2 ka, significantly after the GBL reached close enough to its absolute maximum to block both ends of the Devils Lake gorge at 24.7 ka.
While the data presented here do not provide insight into causation for this behavior, we suggest they may reflect local response of the ice margin in response to warming climatic conditions following the MIS 2 glacial maximum. The GBL is hypothesized to have had a frozen bed in a zone that extended several kilometers or tens of kilometers behind the margin (Attig et al., Reference Attig, Mickelson and Clayton1989). The ice margins identified in Figure 2 several miles behind the Johnstown moraine could represent stable margins under conditions when the frozen bed zone existed. Climatic warming thawed the frozen margin, increasing basal sliding stress and causing ice to thin and advance sometime after 21.2 ka. The stratigraphic data presented here document this late advance occurring at sites located ~50 km apart along the ice front. Ullman et al. (Reference Ullman, Carlson, LeGrande, Anslow, Moore, Caffee, Syverson and Licciardi2014) posited that fluctuations of the GBL and other lobes of the southern Laurentide Ice Sheet during this time period may have resulted from the initial rise in boreal summer insolation at 24–23 ka. While that explanation may satisfy the data presented by Ullman et al. (Reference Ullman, Carlson, LeGrande, Anslow, Moore, Caffee, Syverson and Licciardi2014) from several different locations, it is unclear how the rise in insolation at this time would explain the advance of the GBL into the Swamplovers valley after 21.2 ka.
Synthesis of chronologies for the southern Green Bay Lobe
While the development of a precise numeric chronology for the GBL has been challenging, recent applications of OSL dating (e.g., Attig et al., Reference Attig, Hanson, Rawling, Young and Carson2011) and cosmogenic surface exposure dating (e.g., Ullman et al., Reference Ullman, Carlson, LeGrande, Anslow, Moore, Caffee, Syverson and Licciardi2014), combined with an emerging understanding of the importance of former ice-proximal lakes as sources of datable carbon (e.g., Carson et al., Reference Carson, Hanson, Attig and Young2012a, Reference Carson, Hanson, Attig and Young2012b), are providing new insight into the timing of the end of the MIS 2 advance of the GBL and the onset of retreat of the GBL (Fig. 6).
Correlation of absolute chronological control on glacial and lacustrine events in the vicinity of the Baraboo Hills and glacial Lake Wisconsin. Black figures represent accelerator mass spectrometry (AMS) radiocarbon ages, gray figures represent optically stimulated luminescence (OSL) dates, white-with-black-outline figures represent cosmogenic surface exposure dating (with error bars shown, as appropriate). Data from Attig et al. (Reference Attig, Hanson, Rawling, Young and Carson2011), Carson et al. (Reference Carson, Hanson, Attig and Young2012a, Reference Carson, Hanson, Attig and Young2012b), Ullman et al. (Reference Ullman, Carlson, LeGrande, Anslow, Moore, Caffee, Syverson and Licciardi2014), and the present study. Arrows pointing down indicate date on end of glacial advance, rectangles represent ice margin and/or lake stability, and arrows pointing up represent indications of ice retreat or lake drainage. The four horizontal dashed lines represent the best estimates for discrete events in the area: (1) end of advance of the Green Bay Lobe (GBL) at the Baraboo Hills; (2) thinning and minor advance of the GBL; (3) onset of retreat of the GBL from the maximum position; and (4) retreat of the GBL east of the Baraboo Hills, allowing catastrophic drainage of glacial Lake Wisconsin.

The combined suite of radiocarbon ages and OSL age estimates reported from the Devils Lake gorge area from this study, Carson et al. (Reference Carson, Hanson, Attig and Young2012a), and Attig et al. (Reference Attig, Hanson, Rawling, Young and Carson2011) indicates that ice had advance to very close to its maximum position by 24.7 ka. Subsequently, as recorded in the stratigraphic record at several sites, ice advanced several kilometers sometime shortly after 21.2 ka. Ice remained close enough to its maximum position to keep the Devils Lake gorge blocked at 19.2 ± 3.2 ka. More regionally, Carson et al. (Reference Carson, Hanson, Attig and Young2012b) showed that the GBL remained at or near its maximum position in the Baraboo Hills area between 21.6 ka and 19.3 ka. Ice began to thin and/or retreat in the Baraboo Hills area by 18.5 ka, based on the drainage of small lake basins dammed by ice on the highest points of the Baraboo Hills (Attig et al., Reference Attig, Hanson, Rawling, Young and Carson2011). It had begun to retreat from the Black Earth Creek area sometime before 17.0 ka (Carson et al., Reference Carson, Hanson, Attig and Young2012a) and had retreated to the eastern end of the Baraboo Hills by sometime shortly after 17.4 (Carson et al., Reference Carson, Hanson, Attig and Young2012b).
Ullman et al. (Reference Ullman, Carlson, LeGrande, Anslow, Moore, Caffee, Syverson and Licciardi2014) estimated that onset of retreat from the Devils Lake gorge area commenced by 22.1 ± 1.5 ka, based on cosmogenic surface exposure ages of moraine boulders collected near Devils Nose (Figs. 1C and 2A). An additional age estimate by Ullman et al. (Reference Ullman, Carlson, LeGrande, Anslow, Moore, Caffee, Syverson and Licciardi2014) from 10 km farther to the northeast of Devils Nose (Fig. 1C) suggests that the eastern Baraboo Hills were deglaciated by 19.4 ± 0.7 ka. The discrepancy that exists between these cosmogenic exposure age estimates and the radiocarbon and OSL age estimates from the area could reflect a number of issues. Difficulty with interpreting ages could be introduced by local effects (e.g., topography and localized thinning of ice) rather than response of the lobe to hemispheric forcing. Similarly, responses and behavior of ice-marginal positions could vary along the margin of the GBL, resulting in localized advance of ice recorded at Swamplovers site as presented here at the same time as retreat from Devils Nose suggested by Ullman et al. (Reference Ullman, Carlson, LeGrande, Anslow, Moore, Caffee, Syverson and Licciardi2014).
MIS 3 to MIS 2 advance of the Green Bay Lobe
The data and interpretations presented here expand on the emerging record of the Laurentide Ice Sheet and the GBL from late MIS 3 to the peak of glaciation in MIS 2. Geomorphic evidence, in the form of a paucity of mapped deposits, and recent research (e.g., Dalton et al., Reference Dalton, Finkelstein, Barnett and Forman2016; Pico et al., Reference Pico, Mitrovica, Ferrier and Braun2016, Reference Pico, Creveling and Mitrovica2017; Carlson et al., Reference Carlson, Tarasov and Pico2018) suggest that the LIS had a reduced extent during MIS 3 (ca. 57–29 ka). Evidence exists for fluctuations in LIS ice volumes during MIS 3 (Clark et al., Reference Clark, Hostetler, Pisias, Schmittner, Meissner, Schmittner, Chang and Hemming2007), yet the behavior of the GBL from late MIS 3 to the peak of MIS 2 glaciation has until recently been poorly understood. Carlson et al. (Reference Carlson, Tarasov and Pico2018) documented a glacial advance of the adjacent Lake Michigan Lobe in eastern Wisconsin (Fig. 1B) at 39.0 ± 0.4 ka based on wood interbedded between lacustrine sediment and till. Ceperley et al. (Reference Ceperley, Marcott, Rawling, Zoet and Zimmerman2019) used cosmogenic exposure dating to date an advance of ice to just beyond the extent of the northern GBL to ca. 35 ka (Fig. 1B). Here, we have documented that the southern GBL reached its MIS 2 maximum near the Devils Lake gorge at 24.7 ka. This new chronological control for the GBL, coupled with the limited OSL data from the south end of the Devils Lake gorge that suggests outwash was filling the southern end of the gorge by 34.3 ± 4.4 ka to 45.3 ± 6.2 ka, provides new insight into the advance chronology of the GBL during this period of interest.
CONCLUSIONS
The stratigraphy from cores into the Johnstown moraine at the two locations where it blocks the Devils Lake gorge in the Baraboo Hills reveals the sequence of events as the GBL reached its maximum position. Ice blocked the south end of the gorge first, forming glacial Lake Wisconsin. Sometime after that, ice blocked the north end of the Devils Lake gorge, isolating Devils Lake from the greater glacial Lake Wisconsin basin. Radiocarbon dates from a core of lacustrine sediment located in the Devils Lake gorge, and at an elevation only inundated while the lake was at its full-glacial stage, indicate that both ends of the gorge were blocked by ice sometime shortly before 24.7 ka. An OSL age estimate from the same site indicates water was at the elevated stage at the 19.2 ± 3.2 ka interval.
Cores from a transect on the Badger Army Ammunition site immediately to the south of the Baraboo Hills and from two sites 30 km farther south all contain stratigraphy consistent with ice advancing immediately before large-scale retreat. Plant macrofossils from the Swamplovers site limit this advance to having occurred sometime after 21.2 ka.
Synthesis of the available inventory of AMS radiocarbon dates and OSL age estimates from Devils Lake and south-central Wisconsin provide a coherent, internally consistent timeline for the end of advance of the GBL and the onset of its retreat. The constraint of the end of advance of the GBL at 24.7 ka also informs the behavior of the GBL as it advanced from a reduced MIS 3 configuration to the MIS 2 maximum.
ACKNOWLEDGMENTS
This work was partially funded by grants from STATEMAP (G12AC20121 and G13AC00138) and the Great Lakes Geologic Mapping Coalition (G10AC00630-0001 and G12AC20388) and by the Wisconsin Geological and Natural History Survey. Field assistance was provided by B. Bates and V. Stanley. The authors would like to thank Swamplovers, LLC, and the staff of Devil's Lake State Park for land access and cooperation. The article was significantly improved by comments from D. Ullman, an anonymous reviewer, and the editorial staff at Quaternary Research.
SUPPLEMENTARY MATERIAL
To view supplementary material for this article, please visit https://doi.org/10.1017/qua.2020.8.