Implications
The heritability of the boar off-odour androstenone is high, so that breeding for lower levels should be possible. However, this will only be successful when side effects of breeding such as delayed sexual maturation are understood. The analysis of global gene expression presented here indicates that specific stages of the developing testis should be considered. Complex morphological signals and changes were expressed at specific stages of puberty. Sampling for breeding against androstenone at slaughter (100 kg) limits measurements to the specific levels of gene expression and state of sexual maturation at this age. It would be useful to include more stages of pubertal development in future breeding studies for lower androstenone levels.
Introduction
Testicular growth and development is a complex and strictly regulated process. The hypothalamic–pituitary–gonadal axis stimulates testis development and testicular steroidogenesis in a cascade of precisely timed events (Lejeune et al., Reference Lejeune, Habert and Saez1998). In the prepubertal boar, the testis remains morphologically silent until the animal is ~12 weeks old. Thereafter pubertal cell proliferation begins. Early stages of germ cells and interstitial cells develop from week 13 to week 16 (Franca et al., Reference Franca, Avelar and Almeida2000). Maturation of testis cells is supported by complex interactions between the seminiferous tubules, Sertoli cells, germ cells, Leydig cells and their receptors (Avelar et al., Reference Avelar, Oliveira, Soares, Silva, Dobrinski, Hess and Franca2010). After the establishment of adequate populations of interstitial Sertoli and Leydig cells, a marked increase in steroid secretion can be expected. Moreover, steroids stimulate the onset and maintenance of germ cell differentiation and maturation of the first spermatids from week 20 of age (Franca et al., Reference Franca, Silva, Chiarini-Garcia, Garcia and Debeljuk2005). This development results from the interplay between gonadotropins and steroidogenic action. Growth factors are also involved. The majority of investigations on the role of growth factors in testis development have been performed in vitro on samples from rodent testes. Their conclusions are not necessarily valid for boar testes. Little information is available on the impact of growth factors on the development of the boar testis.
The onset of puberty in the boar is linked to the differentiation and expansion of the seminiferous tubules. A wave of Sertoli cell development and proliferation coincides with expansion of the seminiferous tubules (Franca et al., Reference Franca, Avelar and Almeida2000), and involves growth factor signals and complex interstitial cell-to-cell communication (Mendis-Handagama and Siril Ariyaratne, Reference Mendis-Handagama and Siril Ariyaratne2005). However, the detailed interplay between growth and onset of puberty is not well understood. So far, descriptions of molecular functions during the pubertal development of the boar testis are rare. Analysis of global gene expression at different stages of boar testis development might improve our understanding of interactions at the molecular level during puberty.
Androstenone is a steroid pheromone occurring in the pubertal Leydig cells. Breeding against androstenone can decrease pheromone odour in swine meat, but appears to cause unwanted side effects such as delayed onset of puberty (Sellier and Bonneau, Reference Sellier and Bonneau1988). Hence, there is a need to understand the causality of the delayed onset of puberty.
Aim of the study
The aim of this study was to investigate the molecular processes in the developing boar testis. This included analysis of differentially regulated transcripts expressed during the pubertal development of testes with known morphological development status. Analysis of global gene expression was followed by cluster and pathway analysis based on transcripts differentially regulated at four time points. The androgen levels and morphological maturation status during puberty of each of the animals in the study were known, and have been reported in a previous publication (Lervik et al., Reference Lervik, Oskam, Krogenaes, Andresen, Dahl, Haga, Tajet, Olsaker and Ropstad2013). To the best of our knowledge, there are no previous reports of this type of approach.
Material and methods
The experiment was conducted in agreement with the provisions enforced by the Norwegian Animal Research Authority.
Animals and samples
The study was based on16 Duroc boars from a Norsvin breeding nucleus farm. Selection of animals, management and sampling have been described previously (Lervik et al., Reference Lervik, Oskam, Krogenaes, Andresen, Dahl, Haga, Tajet, Olsaker and Ropstad2013). Animal selection was based on estimated breeding values for androstenone. Individual records of testosterone and androstenone in plasma and androstenone in fat at four time points (12, 16, 20 and 27 weeks of age) are available together with the expression data in the NCBI Gene Expression Omnibus (GEO) database (www.ncbi.nlm.nih.gov/geo) (Edgar et al., Reference Edgar, Domrachev and Lash2002) with the accession number GSE39322 (array 39 to array 99). GSM links to the data for individual arrays are given in Supplementary Table S1. The protocol for anaesthesia, sampling of testis tissue at four time points (12, 16, 20 and 27 weeks of age) by needle biopsy and evaluation of morphological development have also been described previously (Lervik et al., Reference Lervik, Oskam, Krogenaes, Andresen, Dahl, Haga, Tajet, Olsaker and Ropstad2013). The testis tissue was snap frozen in liquid nitrogen and stored at −70°C.
Heat map showing calculated means of expression levels for all transcripts in each of the nine identified clusters for each individual at the different ages. Visualised in TreeView. A to N=individual boars; green=downregulated; red=upregulated. *By histomorphology: i=immature; t=transitional; c=close to mature; m=mature.

Isolation of mRNA
Frozen individual testis tissue samples were placed in phenol/guanidine isothiocyanate (TRIzol®; Invitrogen, Paisley, United Kingdom) and homogenised with a mixer mill (NM300; Retsch, Haan, Germany) using 5-mm-diameter tungsten beads. Total RNA was extracted from the homogenates using RNeasy 96 Universal Tissue Kit (Qiagen Ltd, Crawley, West Sussex, UK) according to the producer’s protocol. The RNA was eluted and stored in RNase-free water (Qiagen) at −78°C. RNA quantity was measured using a NanoDrop ND-1000 spectrophotometer (Thermo Fischer Scientific, Waltham, MA, USA), and RNA quality was evaluated using Agilent RNA 6000 Nano LabChip on the Agilent 2100 Bioanalyzer (Agilent Technologies Inc., Santa Clara, CA, USA). DNase treatment was not performed, since a test treatment revealed no difference in quality or quantity between DNase-treated and untreated RNA.
DNA microarrays
A porcine cDNA microarray with 26 877 EST fragments printed in duplicate (accession no. GPL6173 in the NCBI Gene Expression Omnibus (GEO) (www.ncbi.nlm.nih.gov/geo) was used for the expression analyses, with dual channel detection. A total of 56 arrays were used in a common reference design. The reference material consisted of the available pooled mRNA from 12 to 27-week-old test animals in the study (25 samples), their 0- and 3-week-old siblings (nine and eight samples, respectively) and one unrelated Duroc boar (69 kg) with a low skatole level. (Samples from newborn and 3-week-old siblings of the analysed animals were included in the reference material since the original experiment also included test animals from these age groups. These results are not included here.) Alexa Fluor-labelled cDNA was synthesised from 10 to 20 µg of total RNA using SuperScript Indirect cDNA Labelling System (Invitrogen Corporation, Carlsbad, CA, USA). The reference samples were labelled with Alexa-555 (Invitrogen Corporation), purified, mixed and divided into aliquots. The individual samples were labelled with Alexa-647 (Invitrogen Corporation). Subsequently each of the labelled samples was co-hybridised with an aliquot of the labelled reference sample and a hybridisation blocker consisting of polydA and Yeast tRNA (Invitrogen) to porcine cDNA microarrays using a Discovery XT hybridisation station (Ventana Discovery Systems/Roche Tissue diagnostics, Tucson, Arizona, USA).
Following hybridisation, washing and drying, the slides were scanned in a ScanArray Express HT system (version 3.0, PerkinElmer, Inc., Waltham, Massachusetts, USA) and the resulting images were analysed using GenePix Pro (version 6.0.1.27, Molecular Devices). The expression data and additional details of the array experiments have been deposited in the GEO database (www.ncbi.nlm.nih.gov/geo) with the accession number GSE39322. Probes were reannotated in April 2014 by BLASTN against the Entrez databases of human (HSA) and domestic pig (Sus scrofa – SSC) gene sequences. NCBI gene identities (IDs) were fed to Ingenuity software (Ingenuity Systems Inc., Redwood City, CA, USA) to obtain official gene symbols used together with the annotated BLAST abbreviations.
Statistical analysis of the microarray data
All arrays from 2 of the 16 individuals were removed before statistical analysis. One of these boars suffered from a skeletal disorder (arrays: 54, 70, 82, 98) and the other showed testis abnormality (arrays: 64, 80, 86, 100). A third animal (individual A) developed melanoma and this led to the removal of the three arrays for 16, 20 and 27 weeks (arrays: 60, 76, 93). Eight other samples were not labelled. Owing to poor quality, these did not qualify for microarray (see Supplementary Table S1).
Pre-processing, normalisation and statistical analysis were carried out in the R computing environment (version 2.4.1 for Windows, www.R-project.org) using the Linear Models for Microarray Analysis packages (Limma, version 2.16.4) (Smyth, Reference Smyth2004), which are part of the Bioconductor project (Gentleman et al., Reference Gentleman, Carey, Bates, Bolstad, Dettling, Dudoit, Ellis, Gautier, Ge, Gentry, Hornik, Hothorn, Huber, Iacus, Irizarry, Leisch, Li, Maechler, Rossini, Sawitzki, Smith, Smyth, Tierney, Yang and Zhang2004). Log2 transformed ratios of Alexa-647 to Alexa-555 (not background corrected) were normalised within-slide using the print-tip-loess method with default parameters and normalised between arrays using the scale method in Limma. A regression model was used to identify potentially significant differential regulation of genes over time using false discovery rate (FDR)-adjusted P<0.05. ANOVA analysis, both univariate and multivariate, was performed based on two variables: age (four levels=(ages)) and androstenone phenotype (two levels: high and low=(androstenone)). The P-values were adjusted by FDR (Benjamini and Hochberg, Reference Benjamini and Hochberg1995).
Genes with significant change over time (ages), and by mixed model (ages and androstenone) from ANOVA were clustered using Cluster (Gene Cluster 3.0) by average linkage and modified Pearson equation for uncentred correlation similarity metric. For graphical display, TreeView (Eisen Lab, Berkeley, CA, USA, http://rana.lbl.gov/manuals/ClusterTreeView.pdf) (Eisen et al., Reference Eisen, Spellman, Brown and Botstein1998) was used to visualise tree clustering of the rows of genes grouped together according to the mathematical similarity of changes in regulation. Visual inspection of the ThreeView result was used to group the genes into clusters. The clusters were analysed for functional networks and pathways using DAVID (Database for Annotation, Visualization and Integrated Discovery) v. 6.7 (Huang et al., Reference Huang, Sherman and Lempicki2009). Functional annotations to biochemical pathways were selected from the Kyoto Encyclopedia of Genes and Genomes (KEGG, Kanehisa Laboratories, Kyoto and Tokyo, Japan), in order to reveal the most frequently represented pathways in the clusters (P<0.1). Since pathway analysis tools for livestock are practically non-existent, the analysis was based on database resources developed for humans and based on human gene IDs. In addition to cluster and pathway analysis, a regression model was used to search for possible association between androstenone levels, and the mean gene regulation slopes over time for each of the functional clusters. FDR-adjusted P-values were calculated. An extra analysis was carried out for genes possibly related to phenotypic androstenone levels, in which samples were ranked by androstenone levels in fat at 27 weeks of age.
Results
Testis maturation
The histomorphological developmental status of the testes is shown in Figure 1 and Supplementary Table S1. Individual androgen levels at the time points of sampling are listed in GEO Accession: GSE39322. Direct links to individual expression data are also given as GSM links in Supplementary Table S1. More data on the boars can be found in the study by Lervik et al. (Reference Lervik, Oskam, Krogenaes, Andresen, Dahl, Haga, Tajet, Olsaker and Ropstad2013). All testes included in this study were immature at 12 weeks. At 16 weeks of age, three testes (individuals E, K and M) were found to be at the transitional stage of maturation, while the other nine were immature. When the boars were 20 weeks old, 11 testes were at a transitional stage, and only one (individual J) was still immature. At the end of the study, at 27 weeks, seven testes (individuals F, G, H, J, K, L and N) were categorised as mature, four (individuals B, E, I and M) as very close to mature and one testis (individual D) was still at transitional stage.
Cluster analysis
The ANOVA analysis of all 26 877 porcine cDNA probes identified 4659 genes with significant changes in expression between different ages. In addition, the multivariate analysis using both age and androstenone levels identified 2407 genes. When duplicates from these two steps were discarded ((ages) and (ages and androstenone)), a total of 4748 genes showed significant changes in expression (Supplementary Table S2). Cluster analysis of these 4748 genes followed by visual inspection in TreeView (Eisen Lab) resulted in nine clusters of genes displaying differences over time (Figure 1).
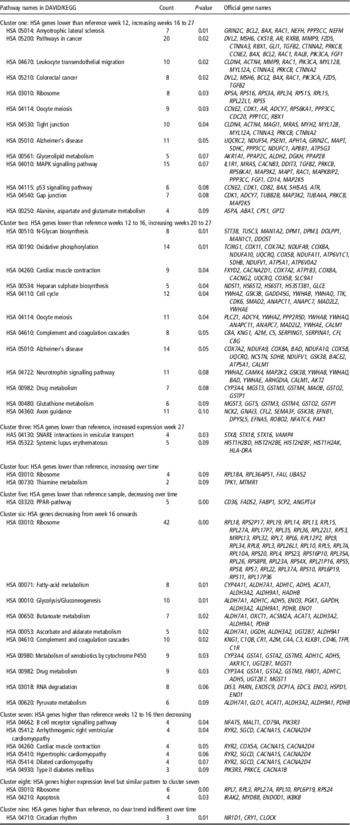
Official HSA and/or SSC gene IDs were identified for 4031 (85%) of the clustered genes, and 3788 (80%) of the HSA gene IDs were used further in DAVID pathway analysis (Supplementary Table S2). In cluster one (767 genes), expression was low in week 12 compared with the reference. The expression level was higher in week 16 and continued to increase up to week 27. In cluster two (1281 genes), expression was low in week 12 and 16 and then increased relative to the reference sample in week 20 and 27. In cluster three (362 genes), expression remained low until week 20 and then increased to the level of the reference sample in week 27. In clusters four and five, gene expression was lower than in the reference sample at all ages. In cluster four (251 genes), expression increased over time, whereas in cluster five (158 genes), it decreased over time. In cluster six (1339 genes), expression was slightly higher than the reference level in week 12 and decreased from week 16 onwards. Gene expression in cluster seven (233 genes) decreased relative to the reference sample in week 20 and 27. Cluster eight (162 genes) contained genes with a higher expression level than the reference in week 12 and 16, dropping to slightly below the reference level in week 27. The expression level of the genes in cluster eight was higher than for cluster seven at week 20, but they showed a similar pattern: a decreasing tendency, becoming similar to the reference in week 27. The genes in cluster nine (195 genes), displayed higher expression than the reference sample, but there was no clear trend over time. Based on the HSA gene IDs, 49 functional KEGG annotated pathways were identified by DAVID in the nine clusters (Table 1). The results are based on the assumption that homologous genes in pigs and humans have the same functions in both species. However, this may not always be true.
Identified pathways with genes in the nine clusters of transcripts showing significant differential expression in the boar testis during pubertal development

DAVID=Database for Annotation, Visualization and Integrated Discovery; KEGG=Kyoto Encyclopedia of Genes and Genomes; PPAR=peroxisome proliferator-activated receptor.
Significance level was set to P=0.1.
The HSA genes that decreased in expression compared with the reference sample in the prepubertal stages from week 16 onwards were associated with pathways of normal cell respiration such as the citric acid cycle and glycolysis and fatty-acid metabolism (Table 1). In addition, cAMP-dependent protein kinase regulator PRKAR2B and HSA- and SSC-annotated PRKAR1A decreased from week 20 onwards (Table 1, Supplementary Table S2). SSC-annotated epidermal growth factor (EGF) receptor pathway substrate 15 (EPS15) decreased in expression from week 20 onwards. This cluster also included the SSC-annotated EGF-like-domains EGFL6 and HSA- EGFL7, HSA-annotated protein carrier for low-density lipoprotein/cholesterol from plasma into cells, and sortilin-related receptor (SORL1). Other genes whose expression decreased over time from week 16 included transcripts coding for growth and growth inhibitor factors, such as HSA-annotated growth hormone receptor (GHR). Genes in the inhibitor of growth family (ING2 and ING3) decreased in expression at puberty (weeks 16 to 27). Other genes in this family also decreased in expression over time, and were downregulated to the reference level by week 27 (ING4, ING1). In contrast, SSC growth hormone releasing hormone (GHRH) increased in expression to slightly below the reference level in week 27.
Expression of the cell adhesion molecule SSC cadherin 1, epithelial (E)-cadherin (CDH1), was higher than the reference at the prepubertal and early pubertal stages (weeks 12 to 20), and decreased to below the reference level in week 27 (Supplementary Table S2). In addition, the peroxisome proliferator-activated receptor pathway (PPAR-pathway) decreased in expression over time to below the reference (cluster five, Table 1). Some HSA Ca(2+) voltage channel genes showed higher expression than the reference in early puberty, such as ‘KEGG cardiac pathways’ (cluster seven, decreasing weeks 20 to 27).
As expression of these prepubertal pathways decreased, several other genes for ‘cardiac’-related pathways showed increasing expression in week 20 and 27. Some of these pubertal pathway genes coded for cytochrome oxidase subunits (COX) in oxidative phosphorylation enzymes. Pathways associated with nerves were prominent in the pubertal clusters. (Increasing expression from week 16 or 20 onwards, Table 1.) Cell-protective metabolism pathway coding for redox and glutathione metabolism increased in expression at puberty both at 16 and 20 to 27 weeks. Different redox genes from those in the glutathione pathway occurred in the pathways at prepuberty (metabolism of drug/xenobiotics). The prepubertally expressed redox pathway genes included ADH1C and ADH5 – two isomerase members of the alcohol dehydrogenase family which metabolise hydroxysteroids.
The proliferative MAPK pathway showed a pubertal increase in expression (weeks 16 to 27). Increased steroidogenesis was observed at this time (Lervik et al., Reference Lervik, Oskam, Krogenaes, Andresen, Dahl, Haga, Tajet, Olsaker and Ropstad2013). Some of the MAPK pathway genes were present in other cluster one pathways (Table 1). Amongst these was calcineurin (PPP3CC), a calcium-dependent calmodulin-stimulated protein-phosphatase involved in the downstream regulation of dopaminergic signal transduction together with glutamate receptor GRIN2C. The GRIN2C gene is also known to influence synaptic long-term potentiation. Other MAPK pathway genes also occurred in morphological pathways. These included RAC1, MAP2K5 and RPS6KA1 genes, which it has previously been suggested are associated with nerve morphogenesis. The Schwann cell growth factor HSA neuregulin1 (NRG1), known to interact with MAPK, was also in cluster one.
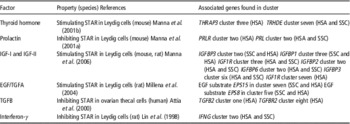
Other genes that showed increased expression in weeks 16 to 27 were not included in the 49 pathways. These were HSA-annotated FSH, β polypeptide (FSHB), HSA-annotated transforming growth factor β2 (TGFB2), HSA-annotated follistatin-like 3 secreted glycoprotein (FSTL3) and the neuropeptide HSA-annotated somatostatin (SST). Genes coding for SSC-annotated steroidogenic acute regulatory protein (STAR) and the STAR analogue STAR-functional related lipid transfer (START) domain containing 6 (STARD6) also increased in expression in weeks 16 to 27. Growth factors that are suggested to have an effect on STAR are listed in Table 2. A shift in expression was also found for other genes coding for cellular cholesterol transport. Caveolin 3 (CAV3) increased in weeks 20 to 27 and caveolin 2 (CAV2) increased throughout the study period, while the expression of HSA sterol carrier protein 2 (SCP2) decreased over time.
Growth-associated factors acting as STAR regulators in mammals

EGF=epidermal growth factor; TGF=transforming growth factor.
The cholesterol-related 24-dehydrocholesterol reductase (DHCR24) and lanosterol 14 α-demethylase (CYP51A1) showed increased expression towards week 27 in mature boars (Supplementary Table S2). In parallel with the histomorphological transition of the testis and maturation of germ cells, expression of two different meiotic pathways increased to reference sample level in weeks 16 to 27 and 20 to 27. The MAPK pathway genes RPS6K51 and PP3CC (the latter mentioned above) were in the earlier meiotic pathway (cluster one, Table 1). Different genes, including CALM1, occurred in the meiotic pathway that showed increased expression 4 weeks later (Table 1). Pathways involved in testis junction formations (tight and gap junction) also showed increased expression at puberty (weeks 16 to 27). Some SSC spermatogenesis-associated transcripts (SPATA-) occured in several clusters which increased compared with reference sample from puberty and onwards (cluster one, two and three). HSA-annotated γ-aminobutyric acid A receptor β showed increased expression in pubertal clusters one (GABRB2) and two (GABRB3) (Supplementary Table S2).
SSC platelet-derived growth factor α polypeptide (PDGFA) expression increased to the reference level in mature testes, while HSA-annotated PDGFD decreased during puberty (downregulated to reference level from weeks 16 to 27), and SSC PDGFC expression decreased continuously until it was below the reference level (Supplementary Table S2). Three probes represented a FSH β polypeptide regulator called SMAD specific E3 ubiquitin protein ligase 2 (SMURF2). Expression of these genes increased and decreased compared with the reference in the mature testis (Supplementary Table S2). HSA transforming growth factor B receptorII (TGFBR2) showed increased expression towards maturity (week 27) (Table 2 and Supplementary Table S2).
Androstenone and gene expression
No significant association was found between androstenone levels and gene expression. ANOVA analysis revealed no genes displaying significant differences in expression between samples with high and low androstenone levels. Nor did the observed differential expression of genes over time show any association with androstenone levels. When the testis samples were ranked according to androstenone levels in fat at 27 weeks of age, a search for significant genes related to the androstenone level also gave a negative result.
Discussion
The gene expression profiles of the nine clusters changed from 12 to 27 weeks, in other words before, during and after the onset of puberty. The identified KEGG pathways could be associated with the timing of histomorphological development of the testis, spermatogenesis and increased steroidogenesis, as investigated in the same animals. These analyses of porcine genes were based on the assumption that genes with similar sequences have the same functions as those described for humans. The results must therefore be interpreted with caution, since genes similar in sequence may not always have the same functions in swine as those described for humans or rodents in DAVID/KEGG. Nevertheless, human pathway analysis tools are the best available option for analysis of large quantities of porcine transcripts. Age- and development-specific functional pathways and genes coding for growth signalling could be related to KEGG pathways associated with HSA organ morphogenesis before and after the onset of pubertal development. In a number of cases, the SSC annotations (Supplementary Table S2) support the assumption about gene functions. Steroidogenic and morphological data (Lervik et al., Reference Lervik, Oskam, Krogenaes, Andresen, Dahl, Haga, Tajet, Olsaker and Ropstad2013) also supported observations on prepubertal and pubertal pathways and gene expression.
Pathways associated with morphogenesis during prepuberty
Pathways known to be directly associated with reproductive development were less active in the testis tissue from the 12-week-old boars than in the reference material. At this age, no histomorphological development towards puberty could be observed in the tissue and androgen levels were low (Lervik et al., Reference Lervik, Oskam, Krogenaes, Andresen, Dahl, Haga, Tajet, Olsaker and Ropstad2013), in agreement with other studies (Franca et al., Reference Franca, Avelar and Almeida2000). The genes that were significantly upregulated compared with the reference sample during week 12 were associated with pathways for metabolism showing stable normal cell respiration. However, the pathways that showed consistently higher or lower expression than in the reference sample at the other time points were not associated with general basal cell metabolism. This indicates an elevated prepubertal metabolism linked to the upcoming pubertal changes in the testis. Expression of HSA sortilin (SORL1) was higher than in the reference sample in week 12 and 16, decreasing in week 20 and 27. This supports the suggestion that there is a higher level of endocytic activity at this age, as put forward by Jacobsen et al. (Reference Jacobsen, Madsen, Moestrup, Lund, Tommerup, Nykjaer, Sottrup-Jensen, Gliemann and Petersen1996). In addition, expression of EPS15 was higher than the reference value in week 12 (decreasing in weeks 16 to 27). The involvement of EPS15 suggests that the EGF receptor might be directed into an endocytic pathway, as suggested in other species (de Melker et al., Reference de Melker, van der Horst and Borst2004). A large amount of cAMP is required for EGF activation (Evaul and Hammes, Reference Evaul and Hammes2008). The protein kinase regulatory subunits (PRKAR1A, PRKAR2B) found in the prepubertal clusters (Supplementary Table S2) may support high cAMP activity, which in turn may result in higher activity, cholesterol mobilisation and cell respiration in the prepubertal testis. Another factor involved in the prepubertal metabolism is the PPAR-pathway, which showed decreasing expression over time (cluster five, Table 1). It has previously been suggested that this pathway regulates Sertoli cell metabolism in the rat (Regueira et al., Reference Regueira, Riera, Galardo, Pellizzari, Cigorraga and Meroni2014). If the functions of the EPS15 gene and PPAR-pathway genes in swine are similar to those in rodents and humans, they may contribute to the higher metabolic level in the prepubertal testis. At the beginning of sexual maturity (weeks 12 to 20) the increased expression of the SSC-annotated specific epithelial (E)-cadherine gene (CDH1) indicates a link to sexual development. During growth and development of sow ovaries, E-cadherines are important for the morphological adhesion (Kirkup et al., Reference Kirkup, Mallin and Bagnell2000). E-cadherine may also play a role during early development of the boar testis, but has so far not been considered as a pubertal marker.
The expression of Ca(2+) voltage channel genes before maturation is an interesting finding. Moreover, the ‘cardiac pathways’ highlighted the involvement of Ca(2+) voltage channels. This is further supporting high cell activity in early puberty (expression decreased in weeks 20 to 27). Ca(2+) and cAMP are involved in most LH-induced steroidogenesis in Leydig cells (Abdou et al., Reference Abdou, Villeneuve and Tremblay2013). A pubertal change in Ca-related mechanism occurred in pathways with increased expression in the maturing testis (weeks 20 to 27). At this stage, several Ca-related ‘cardiac pathway’ genes coded for enzyme properties related to oxidative phosphorylation. The data indicates that modulation by Ca(2+) voltage channels may be more prominent in the prepubertal testis than in the mature testis.
Pathways associated with morphogenesis during sexual maturation
There was a shift in functional pathways related to organ morphogenesis after the onset of pubertal development. Beginning in week 16, there was increasing expression of genes in the MAPK pathway associated with tissue development. Interestingly, this upregulation coincided with the pubertal increase in androstenone and testosterone production in these boars. MAPK pathways are commonly associated with cell growth and differentiation. The upregulation of MAPK was seen some weeks earlier than the most complex morphological restructuring of testis tissue into reproductive tissue. MAPK is involved in general growth in a large number of other tissues. The potential of MAPK to regulate the cholesterol traffic regulator STAR has been discussed (Manna and Stocco, Reference Manna and Stocco2011). The increased expression of STAR and STARD6 in the testis occurred simultaneously with upregulation of MAPK, from week 16 onwards, and indicates a functional involvement. TGFB2 (Table 2) was also in the same cluster (one). TGFB has been related to inhibition of Leydig cell steroidogenesis (Lin et al., Reference Lin, Blaisdell and Haskell1987) and STAR (Attia et al., Reference Attia, Dooley, Rainey and Carr2000). On the basis of the present results, it may be conjectured whether more growth elements are involved in modulating STAR in the pubertal testis of Duroc boars (Table 2). However, these genes may not act in the same way in porcine Leydig cells as in rodents and humans. Modulation of androgen-stimulated cross-talk by MAPK has a role during organogenesis (Raman et al., Reference Raman, Chen and Cobb2007). The present study indicates that MAPKs play a complex role in the development of the boar testis.
During puberty (week 20 onwards), there was an increase in protective redox/detox support pathways ‘glutathione and drug metabolism’ (cluster two). These have a protective role during increased steroidogenesis. However, a potent redox/detox battery is also essential for the vitality and renewal of neurons during development (Kagias et al., Reference Kagias, Nehammer and Pocock2012). Little has been reported on neuronal development in the boar testis, but there are studies in humans and rats (Gerendai et al., Reference Gerendai, Banczerowski and Halasz2005). There was a high proportion of pathways associated with nerves in which expression increased at 16 to 27 and 20 to 27 weeks, coinciding in time with both increased steroidogenesis and histomorphological maturation. In weeks 16 to 27, there was increased expression of SST and the dopamine-activated pathway gene calcineurin and glutamate receptor GRIN2C, which is associated with dopamine function. These changes may support increased neuronal puberty signalling. SST is both an endocrine regulator and involved in morphogenesis. It has previously been suggested that SST stimulates testosterone levels (Vasankari et al., Reference Vasankari, Kujala, Taimela, Torma, Irjala and Huhtaniemi1995). The increased expression of neuromorphogenic pathways and changes in the properties of redox pathways at puberty suggest that there is a pubertal influence on the innervation and maturation of neurons and their actions in the testis of the Duroc boar.
Genes coding for HSA γ-aminobutyric acid A receptor, β GABRB2 (weeks 16 to 27, Table 1) and GABRB3 (weeks 20 to 27) were also in clusters whose expression increased at puberty. The timing of the GABRB increase in expression is in agreement with the onset of morphological transition and gametogenesis observed in the present boar testis material, and indicates that GABRB plays a role in boar gametogenesis. Increased expression of various SSC-annotated spermatogenesis-associated transcripts (SPATA-) support the timing of gametogenesis. The location and function of GABRB have previously been related to spermatogenesis in mice and humans (Kanbara et al., Reference Kanbara, Mori, Kubota, Watanabe, Yanagawa and Otsuki2011).
Interestingly, the histomorphological data showing testis maturation coincided in time with expression of the meiotic pathways that could be related to spermatogenesis (16 to 27 and 20 to 27 weeks). Calcineurin (PPP3CC) was a pathway gene in the earlier meiotic pathway (Table 1); 4 weeks later, the androgen-signalling calmodulin (CALM1) was one of the pathway genes found both in the later meiotic pathway (20 weeks) and in the neurotrophin signalling pathway in the same cluster (Table 1). CALM1 may pay a part both in nerve development (neurotrophin pathway) and in spermatogenesis (meioitic pathway).
The sexually mature boar
Cholesterol-related genes, represented by 24-dehydrocho-lesterol reductase (DHCR24) and cytochrome P450 family 51A1 (CYP51A1), displayed increased expression as the testis matured. Expression of cholesterol transcripts may be associated with meiosis-activating sterols (MAS). There are high levels of MAS in the adult testis and the sperm of many mammals (Keber et al., Reference Keber, Rozman and Horvat2013). In the present study, the highest level of expression of cholesterol-related genes was found in the testis of mature boars, where it may be related to both spermatogenesis and steroidogenesis. DHCR24 displayed prepubertal expression but was then downregulated (Supplementary Table S2). The expression profiles of SCP2 (continuous decrease), STARD6 (increase weeks 16 to 27), CAV3 (increase weeks 20 to 27) and CAV2 (continuous increase) also indicate a shift in the expression of genes for cholesterol transport and metabolism over time. Thus, it is possible that cholesterol plays a complex role in steroidogenesis and testis function.
Platelet-derived growth factors play a key part in gonad development (Schmahl et al., Reference Schmahl, Rizzolo and Soriano2008). Interestingly, PDGFA was expressed in the mature testis. A lack of PDGFA has been associated with Leydig cell loss and impaired spermatogenesis in mice (Gnessi et al., Reference Gnessi, Basciani, Mariani, Arizzi, Spera, Wang, Bondjers, Karlsson and Betsholtz2000). The data suggest that PDGFA is associated with reproductive functions in the mature testis of the boar. In different probes, SMURF2, a FSH β polypeptide FSHB regulator, described by Tran et al. (Reference Tran, Lamba, Wang and Bernard2011), showed both increasing and decreasing expression relative to the reference sample in the mature testis (clusters three and eight, Supplementary Table S2). In the mouse, SMURF2 interacts with TGFBR2 in addition to regulating FSHB (Dragovic et al., Reference Dragovic, Ritter, Schulz, Amato, Thompson, Armstrong and Gilchrist2007). In the mature boar testis, SMURF2 increased in expression. This indicates an association with TGFBR2, which showed a slightly lower increase in expression at the same time (cluster four, Table 2). However, this result must be interpreted with caution, since the function of the SMURF2 gene may not be the same in mice and pigs. Moreover, there was another SMURF2 probe in the array, which showed lower expression than the reference sample in the adult testis (cluster eight). These genes may contribute to completion of testis development or to the overall stability of the mature testis in the boar. In addition, HSA-annotated TGFB2 and FSHB were upregulated in cluster one, increasing in expression over time. Several functions are probably involved, since TGFB1–B3 are essential for the development of both germ and Sertoli cells (Miles et al., Reference Miles, Wakeling, Stringer, van den Bergen, Wilhelm, Sinclair and Western2013). Another regulator of testis aging and size, FSTL3, working through TGFBR2 (Oldknow et al., Reference Oldknow, Seebacher, Goswami, Villen, Pitsillides, O’Shaughnessy, Gygi, Schneyer and Mukherjee2013), was also upregulated and showed increased expression in weeks 16 to 27. This may be associated with the expression of TGFB2. TGFB is also able to inhibit STAR (Table 2). It is unclear how levels of steroids such as androstenone in the boar may be affected by TGFB. Overall, the interactions of morphological pathways, growth factors and neurosteroids in the present data show that particular functional pathways and transcripts associated with growth are expressed at specific stages of testis maturation.
Androstenone levels and gene expression
No significant association was observed between levels of the steroid pheromone androstenone and differential expression of genes using the model in this study. This is in contrast to other studies on pubertal boar testis where differences in gene expression have been found between groups of individuals with large differences in androstenone levels (Moe et al., Reference Moe, Meuwissen, Lien, Bendixen, Wang, Conley, Berget, Tajet and Grindflek2007; Leung et al., Reference Leung, Bowley and Squires2010). In the present study, the differences between androstenone phenotypes were smaller, and this is probably reflected in the level of differential gene expression. Consequently, individual variation may mask potential small differences in gene expression and/or the number of animals may be too small to reach statistical significance. Furthermore, the quantitative threshold for detection of differential gene expression is generally higher for a microarray assay than for other methods. Studies of mice have also demonstrated the difficulties involved in modelling expression of testis steroids and their respective receptors during development (Willems et al., Reference Willems, Batlouni, Esnal, Swinnen, Saunders, Sharpe, Franca, De and Verhoeven2010).
Conclusions
In conclusion, our study has revealed complex patterns of expression of growth factors and pathways, genes known to have modulating effects on steroidogenesis and gonadotropins, neuronal changes and signalling during the pubertal development of boar testes. There are specific profiles of expression at different ages. This illustrates how important it is to take animals’ age into account when identifying good phenotypic parameters in order to minimise side effects associated with breeding against boar taint. Our results indicate that the following should be considered in addition to androstenone levels: expression profiles of neuronal changes and signalling; Ca(2+) and cAMP pathways; MAPKs; growth factors; STAR and other genes involved in cellular steroid transport and metabolism, particularly notably those related to cholesterol (the main substrate for steroids including androstenone). Specifically, selection based solely on measurement of phenotypic androstenone levels and maturation status in mid-pubertal samples from the slaughter line might give different results from measurements taken at a different age. More research is needed to find the optimal phenotype (and genotype) that will reduce the unwanted side effects to the greatest degree. In the meantime our results suggest that more pubertal time points should be used for data collection when breeding for lower levels of androstenone.
Acknowledgements
The study was supported by grants from the Research Council of Norway (grant no. 164070/I10), Eivind Eckbo’s Endowment and Astri and Birger Torsted’s Endowment (id: 2298). S. L. also received a travel grant from the functional genomics programme (FUGE) under the Research Council of Norway. The authors are grateful to Marianne Kraugerud and Tore Engen, Department of Basic Sciences and Aquatic Medicine, Norwegian School of Veterinary Science, for advice and help with dissection of tissue samples. The authors also thank the Department of Molecular Biology and Genetics, Aarhus University, Denmark. We would particularly like to thank members of the Molecular Genetics and Systems Biology Section: Christian Bendixen and co-workers for facilitation and assistance with the microarray experiments and Frank Panitz for BLASTN/annotations.
Supplementary material
To view supplementary material for this article, please visit http://dx.doi.org/10.1017/S1751731115000907