I. INTRODUCTION
Graphene, a single sheet of graphite, is a two-dimensional (2D) crystal of carbon atoms arranged in a honeycomb structure. Since macroscopic flakes of mono- or multilayer graphene were first isolated by micromechanical exfoliation of graphite, followed by the discovery of the anomalous quantum Hall effect,Reference Novoselov, Geim, Morozov, Jiang, Zhang, Dubonos, Grigorieva and Firsov1–Reference Zhang, Tan, Stormer and Kim3 many studies have been performed to elucidate the electron behavior described by the massless Dirac equation. The electron transport properties of graphene, in which carrier mobility reaches as high as 200,000 cm2/V/s,Reference Bolotin, Sikes, Jiang, Klima, Fudenberg, Hone, Kim and Stormer4 are highly attractive topics and the electron scattering mechanisms have been studied experimentally and theoretically. The electrostatic potentials of charged impurities, which are inevitably introduced during device fabrication, act as long-range scattering sources.Reference Ando5, Reference Chen, Jiang, Adam, Fuhrer, Williams and Ishigami6 The gentle decay of the potential created by these charged impurities is closely related to the intravalley process, in which electrons are scattered within a valley in the first Brillouin zone. Here, the effect of the scattering potential depends strongly on the electrostatic screening effect, which is modulated by the charge carrier density. On the other hand, a steep potential induced by structural defects, such as vacancies and grain boundaries in graphene, causes larger changes in the electron momentum, including backscattering, which corresponds to the K-to-K′ transition (i.e., intervalley scattering). Such defects form midgap states in graphene, which reportedly contribute to the conductivity.Reference Stauber, Peres and Guinea7, Reference Chen, Cullen, Jang, Fuhrer and Williams8 In addition, these structural defects have been experimentally and theoretically examined as the origin of localized magnetic moments in various carbon materials as well as graphene.Reference Yazyev and Helm9, Reference Takai, Sato, Enoki, Yoshida, Okino, Touhara and Endo10 Chen et al.Reference Chen, Li, Cullen, Williams and Fuhrer11 recently reported experimental observations of carrier scattering by vacancy defects as magnetic impurities in graphene; the defects were introduced by irradiation with noble gas ions. Edge states, which are spin-polarized electronic states localized at the zigzag edges of graphene,Reference Fujita, Wakabayashi, Nakada and Kusakabe12–Reference Niimi, Matsui, Kambara, Tagami, Tsukada and Fukuyama14 have been considered to be the sources of magnetic moments in graphene. Magnetic moments at atomic vacancies are likely to be due to these edge states. Although the correlation between edge states and electron scattering properties is of importance from the viewpoint of electronics and spintronics device applications as well as fundamental physics, experimental information is lacking.
For the elucidation of this issue, electron transport characteristics have been measured in edge-enriched graphene devices such as antidot structures, in which artificial periodic potential barriers and edge boundaries are introduced into the 2D electron systems of graphene.Reference Shen, Wu, Capano, Rokhinson, Engel and Ye15–Reference Kim, Safron, Han, Arnold and Gopalan18 Indeed, the commensurability effect and Aharonov–Bohm-type oscillation, which are related to the antidot structure, were reportedly observed in antidot graphene samples. Although Shen et al.Reference Shen, Wu, Capano, Rokhinson, Engel and Ye15 estimated the carrier density on the basis of the commensurability peaks, and Eroms and WeissReference Eroms and Weiss19 determined it using variations in the conductivity with the application of a gate voltage, further investigation of the dependence of electron transport characteristics on the carrier density is needed to understand the dominant scattering mechanism in antidot graphene for deriving edge effects.
In this study, antidot and Ar-sputtered graphene samples were fabricated, and the Fermi energy was determined from the gate voltage dependence of the conductivity. The scattering characteristics were investigated in terms of the carrier density for both samples and found to exhibit essential differences.
II. EXPERIMENTAL
Graphene flakes were prepared on an n-Si substrate with an SiO2 layer of 285 or 90 nm thickness by micromechanical exfoliation of kish graphite. For the antidot-structured graphene sample, an Au/Cr mask (40 nm and 10 nm thick, respectively) was fabricated on the graphene by electron beam lithography, followed by etching in reactive oxygen plasma and removal of the metal mask by chemical etching. A graphene sample having vacancy defects was fabricated by irradiation with a 100 eV Ar+ ion beam in a high vacuum (1.0 × 10⁻⁸ Torr). To produce the field-effect devices, Au/Cr electrodes with thicknesses of 40/5 nm, respectively, were attached to the samples by photolithography; the n-Si layer was used as the back gate. Contaminants were removed by current-induced annealing.Reference Moser, Barreiro and Bachtold20 Raman spectra were measured with excitation lasers at 514.5 nm and 532 nm (Jobin Yvon T64000, Tokyo Instruments Nanofinder 30, Tokyo, Japan) for the antidot samples and Ar-sputtered samples, respectively, under ambient conditions at room temperature. The dependence on the wave length of the excitation laser was corrected.Reference Cançado, Takai, Enoki, Endo, Kim, Mizusaki, Jorio, Coelho, Magalhães-Paniago and Pimenta21 Magnetotransport measurements were performed by applying a gate voltage between −60 and +60 V under a magnetic field of up to 15 T applied perpendicular to the graphene plane in the temperature range from liquid He temperature to ∼30 K.
As we will show later in Sec. III, we used bilayer and monolayer graphenes for the antidot and Ar-sputtered samples, respectively, in the experiments due to the difficulty in the sample preparations and appropriateness in the discussion of the physical properties (See Appendix A).
III. RESULTS
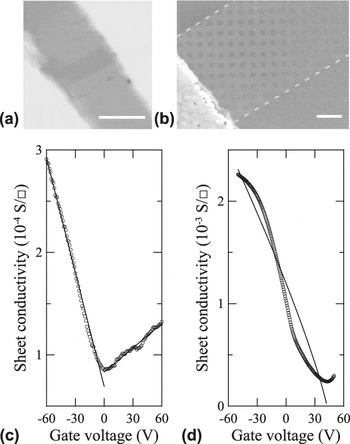
Figure 1(a) shows a typical optical microscopy image of the antidot graphene sample with the source–drain electrodes. No difference is observed between optical images taken before and after the fabrication process in either the antidot or the Ar-sputtered sample (not shown). The antidot array of 100 × 100 nm2 rectangular holes with a 200-nm pitch in the graphene can be seen in the scanning electron microscopy image in Fig. 1(b). Considering the contrast in the optical microscopy image,Reference Blake, Hill, Neto, Novoselov, Jiang, Yang, Booth and Geim22 the antidot and Ar-sputtered samples appear as bilayers and a monolayer, respectively. Observation of the 2D bands in both samples by Raman spectroscopy confirms this result regarding the number of layers.Reference Ferrari, Meyer, Scardaci, Casiraghi, Lazzeri, Mauri, Piscanec, Jiang, Novoselov, Roth and Geim23
(a) Optical microscopy and (b) scanning electron microscopy images of the antidot graphene sample. The dark region in the center of (a) is the graphene sample. Bright regions in (a) and (b) are metal electrodes. Scale bars in (a) and (b) correspond to 5 μm and 500 nm, respectively. (c) Backgate voltage dependences of the sheet conductivity of bilayer antidot sample and (d) monolayer Ar-sputtered sample. Solid curves in (c) and (d) are theoretical fits by Eqs. (1) and (2), respectively, for the carrier density.

The sheet conductivity σ of the antidot sample exhibits a minimum at the charge neutrality point V CNP depending on the backgate voltage V g, as shown in Fig. 1(c). The charge neutrality point appears at V g = 0 V for the antidot sample. The carrier mobility μ can be derived from the Drude equation, μ = σ/en, where e is the elementary electrical charge and n is the carrier density, with n = 7.6 × 10¹⁰ (V g − V CNP) (cm−2) for the 285-nm thick SiO2 substrate used for the antidot sample. The calculated values of the hole and electron mobilities are about 400 cm2/V/s and 180 cm2/V/s, respectively. For the Ar-sputtered sample, V CNP appears at V g = 42 V, as shown in Fig. 1(d). We used a 90-nm thick SiO2 substrate for the Ar-sputtered sample; this corresponds to a much wider field-effect modulation of the carrier density, which is given by n = 2.4 × 10¹¹ (V g − V CNP) (cm−2). The calculated hole mobility is about 600 cm2/V/s.
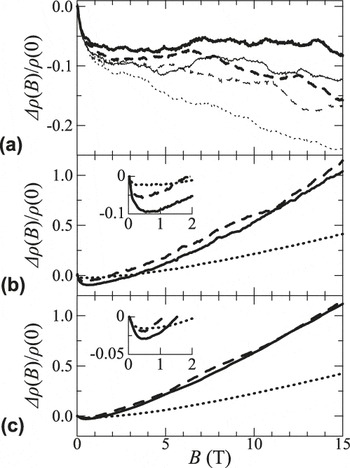
Figure 2 shows the magnetoresistance, ∆ρ(B)/ρ(B), for the antidot and Ar-sputtered samples with various backgate voltages, where ρ(B) is the resistivity under the applied magnetic field B, and ∆ρ(B) = ρ(B) − ρ(0). At high magnetic fields, the antidot sample shows Shubnikov-de Haas (SdH) oscillation, whereas the Ar-sputtered sample does not. At low magnetic fields (below approximately 1 T), the magnetoresistance of both samples decreases steeply as the magnetic field increases. The strength of the negative magnetoresistance is approximately 0.1 at 1 T for both samples. The magnetoresistance of the antidot sample remains negative in the entire magnetic field range.
(a) Magnetoresistance of bilayer antidot sample measured at 1.5 K with V g = −50, −30, 0, +30, and +50 V (thick solid, thick dashed, thin dotted, thin dashed, and thin solid curves, respectively). (b) Magnetoresistance of monolayer Ar-sputtered sample measured at 2 K and (c) 30 K with V g = 0, +30, and +42 V (dotted, dashed, and solid curves, respectively). Insets in (b) and (c) are magnifications of low-field regions.

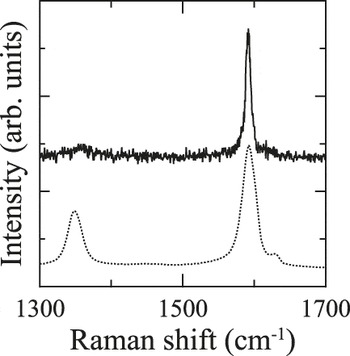
The Raman spectra of the antidot and Ar-sputtered samples are shown in Fig. 3. The G band clearly appears at ∼1590 cm−1 in both samples. Both Raman spectra show D band features at ∼1350 cm−1, which originate from the intervalley scatterings induced by vacancies, grain boundaries, and so on.Reference Ferrari, Meyer, Scardaci, Casiraghi, Lazzeri, Mauri, Piscanec, Jiang, Novoselov, Roth and Geim23 The integrated intensity ratios of the D band to the G band, I D/I G are 0.26 and 0.48 for the antidot and Ar-sputtered samples, respectively. The average distance between the intervalley scattering sources, L a, is derived from I D/I G using  $L_{\rm{a}} = 2.4 \times 10^{ - 10} {\rm{\lambda }}_{{\rm{laser}}}^4 \left( {I_{\rm{D}} /I_{\rm{G}} } \right)^{ - 1} $(nm), where the dependence on the wave length of the excitation laser in nanometer units λlaser is corrected for the D band intensity.Reference Saito, Jorio, Filho, Dresselhaus, Dresselhaus and Pimenta24 The estimated values of L a for the antidot and Ar-sputtered samples are about 65 nm and 40 nm, respectively. In addition, the D′ band, which is correlated with intravalley scattering,Reference Baranov, Bekhterev, Bobovich and Petrov25, Reference Thomsen and Reich26 appears at 1631 cm−1 in the spectrum of the Ar-sputtered sample. The selective presence of the D′ band in the spectrum of the Ar-sputtered sample is related to the difference in the wave length of the excitation laser.Reference Sugihara27
Raman spectra for the G and D bands of antidot and Ar-sputtered samples (solid and dotted curves, respectively). In the spectrum of the antidot sample, the G and D bands appear at 1591 and 1356 cm−1, respectively, with corresponding widths of 9 and 34 cm−1. In the Ar-sputtered sample, the G and D bands appear at 1592 and 1349 cm−1, respectively, with corresponding widths of 21 and 23 cm−1. In addition, the D′ band appears at 1631 cm−1 in the spectrum of the Ar-sputtered sample. Its width is 5 cm−1.

IV. DISCUSSION
A. Transport without magnetic field
The sheet conductivity under V g tuning in Fig. 1(c) yields a mean free path l of ∼10 nm for the antidot sample according to l = ħk Fμ/e, where ħ is the Planck constant divided by 2π, and k F is the Fermi wave number. This value is much smaller than that obtained from the Raman spectrum, L a = 65 nm. For the Ar-sputtered sample, however, the mean free path is calculated as 20–30 nm, which is comparable with L a = 40 nm. Because L a is estimated from the D band intensity of the Raman spectra, which arises from intervalley scattering sources such as vacancies, we conclude that carrier scattering in the Ar-sputtered sample is governed by intervalley scattering. In contrast, the large carrier scattering rate indicated by the smaller mean free path in the antidot sample, which has a weak D band contribution, is attributed mainly to the intravalley process, which is not related to the Raman D band.Reference Cançado, Pimenta, Neves, Dantas and Jorio28 Charged impurities are the most likely scattering sources responsible for intravalley scattering in the antidot sample.Reference Heydrich, Hirmer, Preis, Korn, Eroms, Weiss and Schüller29 The sample fabrication processes, which involved chemical treatments and oxygen plasma exposure, could unintentionally introduce charged impurities into the antidot sample.
For monolayer graphene, theoretical and experimental studies have shown that the conductivity varies with the carrier density σ(n) as
 $${\rm{\sigma }}\left( n \right) = Ce\left| {n/n_{{\rm{imp}}} } \right|\quad,$$
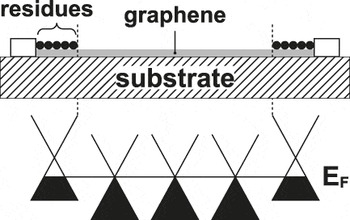
where C = 5 × 10¹⁵ V/s, and n imp is the density of charged impurities.Reference Ando5, Reference Chen, Jiang, Adam, Fuhrer, Williams and Ishigami6 In bilayer graphene, σ(n) has a linear dependence on carrier density as in monolayer graphene,Reference Morozov, Novoselov, Katsnelson, Schedin, Elias, Jaszczak and Geim30 although a nonlinear relationship due to a change in C as a function of n has also been reported.Reference Xiao, Chen, Adam, Williams and Fuhrer31 Although the scattering source in bilayer graphene on an SiO2 substrate remains controversial, we simply use Eq. (1) with C = 5 × 10¹⁵ to fit our data for the antidot sample, which was identified as bilayer graphene, to roughly estimate the density of impurities. The resulting fit is shown in Fig. 1(c). The observed electron–hole asymmetry yields n imp = 1.6 × 10¹³ and 7.7 × 1013 cm−2 for negative and positive V g, respectively. The electron–hole asymmetry can be attributed to an inhomogeneous distribution of the charged impurities. We applied a relatively high voltage to heat and clean the antidot sample. However, the source and the drain electrodes might act as heat sinks during this process and reduce the sample temperature in the region close to the electrodes relative to that in the central region; thus, contaminants may remain near the electrodes and cause hole doping.Reference Moser, Barreiro and Bachtold20, Reference Heydrich, Hirmer, Preis, Korn, Eroms, Weiss and Schüller29 When V g is negative, the conductivity in the central region of the sample (see Fig. 4), which is relatively clean, is predominant. In contrast, the dirty region contributes much more to the conductivity of electron carriers when V g is positive. Given the long channel length of the antidot sample (6 μm), for all practical purposes, the asymmetry in conductivity due to the difference in the work functions of graphene and metal electrodes can be ignored.Reference Nouchi, Shiraishi and Suzuki32
Schematic illustration of inhomogeneous distribution of charged impurities with a V g of ∼0 V. Impurities are likely to be retained by current-induced cleaning, causing residual modulation of the carrier density in the graphene near the metal electrodes.

In contrast, for the monolayer Ar-sputtered sample, the mean free path of 20–30 nm is comparable with the L a value of 40 nm. Given the extremely low concentration of atomic vacancies (0.004%), which is estimated from the squared ratio of the lattice constant (a = 0.246 nm) to the average distance between vacancy defects [40 nm; hence, a squared ratio of (a/40)2], and the small size of the vacancies (0.25 nm),Reference Hahn, Kang, Song and Jeon33 we confirm that the intrinsic electronic structure of graphene is preserved. During fabrication, the Ar-sputtered sample is not exposed to chemical reactions such as the removal of metal masks, which introduce many charged impurities. This is consistent with the suggestion that intervalley scattering by vacancy defects created during Ar sputtering dominates the conductivity in the Ar-sputtered sample. However, charged impurities are also inevitably contained in the Ar-sputtered sample. They form electron–hole puddles that produce a spatially inhomogeneous distribution of V CNP, which results in a broadening of the V g–σ curve in the region around the Dirac point. Here, modulation of the carrier density dependence of the conductivity due to vacancy defects is fitted by a function of the form
 $${\rm{\sigma }}\left( n \right) = \left( {2e^2 /{\rm{\pi }}h} \right)\left| {n/n_{\rm{d}} } \right|{\rm{ln}}^2 \left( {k_{\rm{F}} R} \right)\quad,$$
as shown in Fig. 1(d), where n d is the density of vacancy defects, and R is the radius of the potential.Reference Stauber, Peres and Guinea7, Reference Chen, Cullen, Jang, Fuhrer and Williams8 The formation of one atomic-scale vacancy defect by ion irradiation is well accepted. Assuming an R-value of 0.25 nm, which corresponds to single atom vacancies,Reference Hahn, Kang, Song and Jeon33 the density of vacancy defects is n d = 9.0 × 1012 cm−2.
B. Magnetoresistance at high fields
Differences in the origin of electron scattering in each sample are associated with differences in the change of the electron momentum during the carrier scattering event. This can be seen in the SdH oscillation of the conductivity at high fields. SdH oscillations are observed in the antidot sample, in which charged impurities mainly contribute to carrier scattering. Their shallow potential causes a small change in electron momentum, and the average cyclotron motions are less disturbed in k-space. In contrast, in the Ar-sputtered sample, the larger electron momentum change caused by the intervalley scattering induced by vacancy defects completely breaks the cyclotron orbits of the carriers.
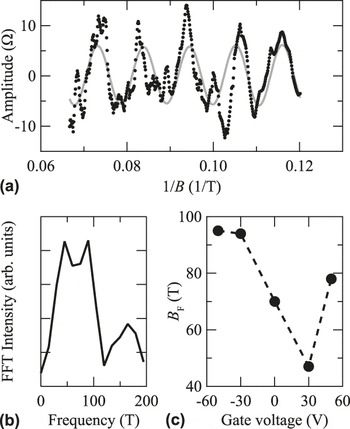
To analyze the SdH oscillation, we defined the envelope curve of the resistivity by taking the average of adjacent data points with a window width of 60 points, corresponding to a range of 0.9 T around a certain magnetic field. By subtracting the envelope curve from the magnetic field dependence of the sheet resistance, we obtained the SdH oscillation with V g = −50 V at 1.5 K, as shown in Fig. 5(a). We derived the dominant frequency of the SdH oscillation by applying a fast Fourier transform (FFT) to the data. The power spectrum (i.e., FFT intensity versus oscillation frequency) obtained with V g = −50 V is plotted in Fig. 5(b). The broad SdH oscillation peak around 50–100 T indicates inhomogeneity in the spatial distribution of charges in the sample. A linear relationship between the oscillation frequency and the carrier density, B F = hn/4e, has been reported for bulk graphene samples.Reference Novoselov, Geim, Morozov, Jiang, Katsnelson, Grigorieva, Dubonos and Firsov2 However, the estimated values of B F in our antidot sample are 50–95 T with a minimum at a gate voltage of 30 V, as shown in Fig. 5(c). The estimated frequency yields a carrier density of n = 4.8–9.2 × 1012 cm−2, which disagrees with that obtained from the sheet resistance. In particular, the carrier density estimated from the SdH oscillation becomes n = 6.8 × 1012 cm−2 at V CNP = 0 V (the Dirac point), although it should be zero. In a nanoribbon-structured graphene sample, such an anomalous SdH oscillation was observed with V g set to the Dirac point, in contrast to that in a bulk graphene sample.Reference Takai, Nishimura and Enoki34 The anomaly was ascribed to the indirect contribution of edges. The chemical species introduced in the lithography process, which affect the chemically active edge in particular, can cause locally high carrier doping; this in turn results in the presence of Landau states with modified orbits, which produce the large oscillation frequency at the Dirac point. Although antidot graphene is rich in graphene edges, our sample shows no anomaly related to nonbonding edge states localized near the edge region depending on the edge geometry.Reference Fujita, Wakabayashi, Nakada and Kusakabe12 This is attributed to the presence of inhomogeneously distributed scattering sources in the interior region far from the edges and the large carrier density in the present sample. The gate voltage dependence of the conductivity represents the average transport properties in the graphene device, where the charge density and scattering sources are inhomogeneously distributed. In contrast, the SdH oscillation in the magnetoresistance highlights the specific part of the sample where the carrier mobility and size of the Fermi surface are appropriate for observing each gate voltage condition.
(a) SdH oscillation versus the inverse of the magnetic field observed in the antidot sample with V g = −50 V at 1.5 K. Solid curve shows oscillation with the dominant frequency. (b) Power spectrum (FFT intensity versus oscillation frequencies) obtained with V g = −50 V. (c) Dominant SdH oscillation frequencies observed at various gate voltages.

C. Magnetoresistance at low fields
At low magnetic fields (<1 T), steep decreases in the magnetoresistance were observed for both the antidot sample and the Ar-sputtered sample, as shown in Fig. 2. These negative magnetoresistance values are attributed to a weak localization effect. Weak localization is caused by time-reversal symmetry breaking of elastic scattering paths, which enhances the conductivity by magnetic de-phasing of the standing waves of charged carriers. Although negative magnetoresistance originating in weak localization usually saturates at a low magnetic field, that of the antidot sample does not saturate and remains negative between 0 and 15 T. A similar negative magnetoresistance was observed in graphite powders with particle sizes of ∼30 nm.Reference Zhang, Xue and Zhu35 This is explained by a decrease in scattering at the crystal boundaries as the applied magnetic field increases and the cyclotron radius of the carriers decreases. We analyzed the magnetoresistance by using the theoretical equation that describes weak localization for graphene,Reference McCann, Kechedzhi, Fal’ko, Suzuura, Ando and Altshuler36
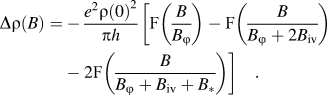 $$\Delta {\rm{\rho }}(B) = - {{e^2 {\rm{\rho }}(0)^2 } \over {{\rm{\pi }}h}}\bigg[ {{\rm{F}}\bigg( {{B \over {B_\varphi }}} \bigg) - {\rm{F}}\bigg( {{B \over {B_\varphi + 2B_{{\rm{iv}}} }}} \bigg) - 2{\rm{F}}\bigg( {{B \over {B_\varphi + B_{{\rm{iv}}} + B_ * }}} \bigg) \bigg]\quad.$$
Here, F(z) = ln z + ψ (0.5 + z −1), where ψ is the digamma function.  $B_x = \left( {\hbar /4eD} \right){\rm{\tau }}_x^{ - 1} $(x: ϕ, iv, *), where D is the diffusion constant; and τx with the subscript ϕ, iv, or * corresponds to the inelastic scattering rate, intervalley scattering rate, or scattering rate associated with the intravalley transition, respectively. The scattering length L x can be calculated by using the relationship
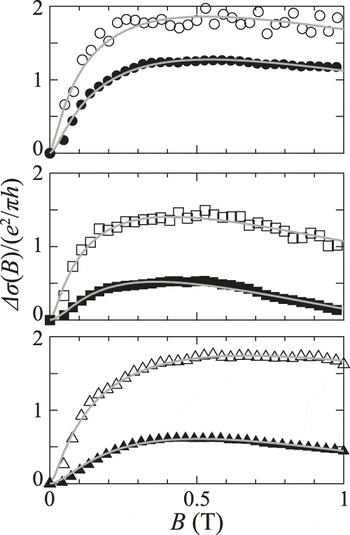
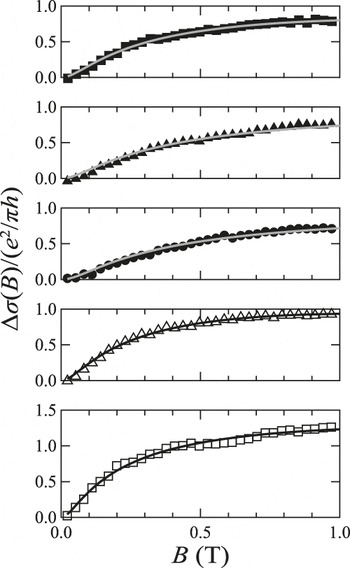
 $L_x = \sqrt {D{\rm{\tau }}_x }$. The calculated values of D for the antidot and Ar-sputtered samples are about 30 cm2/s and 80 cm2/s, respectively. The magnetoresistance data for the Ar-sputtered and antidot samples are fitted well by Eq. (3), as shown in Figs. 6 and 7, respectively. From the fitted parameter of B x, the corresponding scattering lengths are calculated as a function of (V g − V CNP), as shown in Fig. 8.
Magnetoresistance of Ar-sputtered sample measured with V g = 0, +30, and +42 V (circles, squares, and triangles, respectively) at 2 and 30 K (open and solid symbols, respectively). Solid curves are the theoretical fits by Eq. (3).

Magnetoresistance of antidot sample measured at 1.5 K with V g = −50, −30, 0, +30, and +50 V (open squares, open triangles, solid circles, solid triangles, and solid squares, respectively). Solid curves are the theoretical fits by Eq. (3).

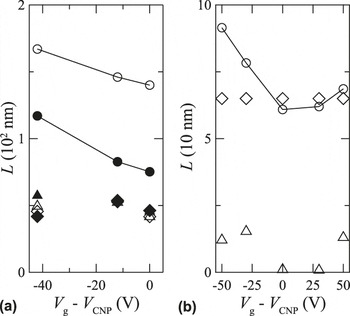
(a) Scattering lengths of Ar-sputtered sample and (b) antidot sample obtained by fitting the magnetoresistance data shown in Figs. 6 and 7, respectively. Circles, diamonds, and triangles denote L ϕ, L iv, and L *, respectively. In (a), open and solid symbols correspond to temperatures of 2 and 30 K, respectively. In (b), the measurements were performed at 1.5 K.

For the Ar-sputtered sample, the inelastic electron−electron scattering length L ϕ decreases as the carrier density decreases or the sample temperature increases, as shown in Fig. 8(a). This is quite consistent with the nature of electron–electron interactions in graphene.Reference Ki, Jeong, Choi, Lee and Park37, Reference Tikhonenko, Horsell, Gorbachev and Savchenko38 On the other hand, the intervalley scattering length L iv and the scattering length related to the intravalley transition L * of the Ar-sputtered sample are independent of both the carrier density and the temperature. The independence of L iv and L * from n and T is consistent with the fact that defects and impurities are the sources of elastic scattering. Note that here L iv is approximately equal to the defect spacing length L a estimated from the Raman spectrum.Reference Moser, Tao, Roche, Alzina, Torres and Bachtold39, Reference Matis, Bulat, Friedman, Houston and Baldwin40 Therefore, the values of L iv and L * in the Ar-sputtered sample are determined to be 40–50 nm.
On the basis of the agreement between L iv and L a in the Ar-sputtered sample, we fitted the magnetoresistance of the antidot sample by using Eq. (3) and setting L iv equal to L a = 65 nm. The result is plotted in Fig. 8(b). The value of L * is 10 nm. L ϕ shows an asymmetric change depending on V g. However, the weak localization effect requires that L ϕ >> L iv, L *, and this condition is not satisfied in the range where (V g − V CNP) is positive. As described above, the positive range corresponds to the lower charge carrier mobility, which is due to charged impurities remaining in a sample area near the source–drain electrodes. Given that charged impurity scattering is the significant mechanism in the antidot sample, intervalley scattering might contribute much less than intravalley scattering because of the electrostatic potential of charged impurities. In contrast, the requirement for weak localization seems to be satisfied in the range where (V g − V CNP) is negative.
The analysis of the weak localization effect indicates that charged impurities and vacancy defects are the main scattering sources in the antidot and Ar-sputtered samples, respectively.
V. SUMMARY
The electron transport properties of antidot-nanopatterned and Ar-sputtered graphene were investigated in terms of the carrier densities with respect to the backgate voltage.
In the antidot sample, the lower carrier mobility, irrespective of the smaller D band intensity of the Raman spectrum, reveals charged impurities to be the dominant scattering source. The gate voltage dependence of the conductivity in this sample is fitted well by the model for charged impurity scattering. The observed electron–hole asymmetry in the conductivity is explained by a spatially inhomogeneous distribution of charged impurities. In contrast, the gate voltage dependence of the conductivity in the Ar-sputtered sample is well explained by the intervalley scattering induced by vacancy defects. This is consistent with the strong intensity of the Raman D band for this sample.
At high magnetic fields, SdH oscillations are observed only in the antidot sample, where charged impurities are the dominant scattering sources. The smaller change in the electron momentum during intravalley scattering causes less disturbance of the average cyclotron motion, whereas the larger change in the electron momentum due to vacancy defects, which are significant in the Ar-sputtered sample, breaks the average cyclotron motion. The discrepancy between the oscillation frequencies and the carrier densities is attributed to the inhomogeneity of charged impurities and carrier densities in the sample.
At lower magnetic fields, both the antidot and Ar-sputtered samples show the weak localization effect. In the Ar-sputtered sample, the condition for the scattering lengths obtained by theoretical fitting is completely satisfied. Moreover, the inelastic scattering length depends on the carrier density and temperature, as explained by electron–electron interactions, whereas the elastic scattering lengths are almost independent of the carrier density and temperature. In addition, L iv is approximately equal to the L a value given by the Raman D band. This indicates that vacancy defects act as the dominant scatterers in the Ar-sputtered sample. In contrast, in the antidot sample, the condition for the scattering lengths is not satisfied under the assumption of L iv = L a. The contribution of the intervalley scattering term is considered to be quite small; therefore, the intravalley scattering term due to charged impurities is considered to be significant.
Although edges are expected to affect carrier scattering in the antidot-nanopatterned graphene, the electron transport properties of the antidot sample were significantly influenced by charged impurities, which are inevitably introduced into the sample during fabrication.
ACKNOWLEDGMENTS
This work was supported by Grant-in-aid for Scientific Research no. 20001006 from the Ministry of Education, Culture, Sports, Science and Technology, Japan. This work was partly supported by MEXT Nanotechnology platform 12025014 (F-12-IT-0002).
APPENDIX A
We used bilayer and monolayer graphenes for the antidot and Ar-sputtered samples. Monolayer graphene can be prepared easily for Ar-sputtered samples because the preparation process is simple. In contrast, we have seldom succeeded in the preparation and cleaning of monolayer antidot graphene because monolayer graphene is mechanically weak and chemically reactive. However, the electron-beam lithography technique allows the fabrication of antidots not only on the uppermost layer but also on the second layer as well, so that the characteristics of the antidots are almost the same for the first and second layers. Accordingly, we can treat these two layers as identical. Furthermore, as the physical processes that underlie the scattering are not significantly modified by the interlayer interaction, their essence is preserved. On the other hand, in the Ar-sputtered sample, bilayer graphene is inappropriate as defects created on the second layer are different from those on the uppermost layer because of differences in the penetration of the Ar ion. Thus, we chose bilayer antidot graphene and monolayer Ar-sputtered graphene to investigate the dominant scattering mechanism in each sample. In fact, the number of layers is not crucial to our analysis; our discussion focuses on the comparison of inter- and intravalley scattering sources.