Introduction
Solid-oxide fuel cells (SOFCs) are efficient electrochemical devices that convert the chemical energy of a fuel into electrical energy and typically employ an extrinsically doped ceramic oxide electrolyte membrane to transport ions through its crystal lattice, while the electrons traverse the external circuit providing useful electrical work. Thin-film SOFCs based on processing techniques used for microelectromechanical systems (MEMS) offer an attractive platform to study contributions from rate-controlling processes (i.e., the slowest step in the rate processes that governs the overall fuel cell performance). Naturally, as one slow step is enhanced, the next slow step becomes the dominant factor in determining the overall cell performance. In particular, thin-film electrolyte membranes can help reduce ohmic losses to such an extent that cathode activation losses become dominant. As the rate of the hydrogen oxidation reaction at the anode is considerably faster than the cathodic reaction, this article focuses on expanding the understanding of the oxygen reduction reaction (ORR) at the cathode followed by oxide ion incorporation into the electrolyte (see the Introductory article in this issue). In principle, ORR involves the reduction of molecular oxygen to oxide ions, which are then incorporated into vacant sites (i.e., oxide ion vacancies) in the oxygen sublattice of the ceramic electrolyte membrane. Using advanced analytical methods with high spatial and energy resolution that allowed us to trace the path of oxygen during ORR, we were able to elucidate the role of surface grain boundaries in this important reaction.
This article draws heavily from major results and findings reported in recent articles by us. First, we briefly review MEMS-based SOFC fabrication techniques followed by fabrication of thin-film electrolyte membranes. As these cells typically operate at temperatures lower than 500°C, they feature an ionically conducting ceramic electrolyte membrane with porous platinum electrodes at the anode and the cathode. Next, we present two engineering strategies to enhance the cathode reaction, which is the rate-determining step in MEMS-based SOFC: engineering of surface grain-boundary density and surface topology by three-dimensional structuring.
Fuel cell fundamentals
Ignoring gas phase mass transport limitations and electrical resistance losses along the external circuit elements, the operating voltage (V) of a SOFC is defined as:
 $$V = {V_{{\rm{oc}}}} - {{\rm{\eta }}_{{\rm{act,anode}}}} - {{\rm{\eta }}_{{\rm{act,cathode}}}} - {{\rm{\eta }}_{{\rm{ohmic}}\,\,{\rm{,}}}}$$
where V oc represents the open-circuit voltage (OCV) determined by thermodynamics, ηact,anode and ηact,cathode represent the activation losses at the anode and the cathode, respectively, and ηohmic represents the ohmic loss across the electrolyte.Reference O’Hayre, Cha, Colella and Prinz1 In the case of H2/air SOFCs, the anode kinetics for H2 oxidation is significantly faster than the ORR kinetics at the cathode.Reference Adler2 As a result, the activation loss at the cathode and the ohmic loss across the electrolyte are two major losses that dominate the performance of H2/air SOFCs. As the ohmic loss is inversely proportional to the thickness of the electrolyte, use of thin-film electrolyte membranes greatly reduces ohmic losses.
Indeed, MEMS-based SOFCs employ thin electrolytes with thicknesses ranging from tens to hundreds of nanometers, which minimizes the ohmic loss, leaving the cathodic activation loss due to the sluggish rate of ORR to dominate the total cell losses. The cathodic activation loss (ηact,cathode) can be expressed as the following Tafel equation (when the activation loss is sufficiently large):
 $${{\rm{\eta }}_{{\rm{act,cathode}}}} = \left( {{{{\rm{RT}}} \mathord{\left/ {\vphantom {{{\rm{RT}}} {{\rm{\alpha }}n{\rm{F}}}}} \right. \kern-\nulldelimiterspace} {{\rm{\alpha }}n{\rm{F}}}}} \right){\rm{ln}}\left( {{j \mathord{\left/ {\vphantom {j {{j_{\rm{0}}}}}} \right. \kern-\nulldelimiterspace} {{j_{\rm{0}}}}}} \right),$$
where R is the ideal gas constant, T is the temperature, n is the number of moles of electrons transferred, F is Faraday’s constant, α is the charge-transfer coefficient, j is the current density, and j 0 is the exchange current density. To minimize the activation loss, therefore, we should have a high exchange current density. The exchange current density, j 0, can be further expressed as:
 $$j_{\rm{0}} = j_{\rm{0}} {\rm{'}}\left( {{A \mathord{\left/ {\vphantom {A {A{\rm{'}}}}} \right. \kern-\nulldelimiterspace} {A{\rm{'}}}}} \right),$$
where j 0' is the intrinsic exchange current density on a perfectly smooth surface, and A/A' is the surface area enhancement (actual surface area/projected area). That is, in order to have a high exchange current density, one should enhance j 0' or increase A/A' (i.e., use a higher surface area structure).
The useful operating voltages of MEMS-based SOFCs are largely dictated by the cathodic activation loss, as the contributions from the anode and the electrolyte are significantly smaller. Consequently, enhancement of the cathodic kinetic rates significantly affects the performance of thin-film SOFCs. In this regard, MEMS-based SOFCs with thin-film electrolyte membranes provide a convenient platform as a research testbed for exploring surface engineering methodologies and strategies at the cathode interface to improve ORR kinetics.
MEMS-based thin-film membrane electrode assemblies
Membrane electrode assemblies (MEAs) built on MEMS-processed single crystal Si wafers can provide an effective platform and a powerful tool to study and understand the role of the cathode/electrolyte interface microstructure at the nanoscale on cathodic rate processes that dominate cell performance in thin-film SOFCs, especially at low operating temperatures. Separation of cathodic processes from ohmic losses naturally accentuates the limitations of the ORR kinetics and makes it easier to investigate mechanistic pathways for oxygen incorporation at the cathode/electrolyte interface.
MEMS-based SOFC MEA
Most of the reported MEMS-based micro-SOFCs are fabricated on silicon wafers (Figure 1).Reference Huang, Nakamura, Su, Fasching, Saito and Prinz3–Reference Joo and Choi20 In this architecture, the silicon wafer functions as a mechanical support for the MEA whose thickness ranges from hundreds of nanometers to micrometers. Huang et al. described a fabrication process to build a freestanding MEA on a silicon wafer as follows:Reference Huang, Nakamura, Su, Fasching, Saito and Prinz3 (1) SiN is deposited on both sides of the double-polished silicon wafer, (2) a thin-film electrolyte is deposited on the top side, (3) the bottom SiN is patterned, (4) the silicon wafer is wet-etched by potassium hydroxide (KOH) to open up windows at the bottom surface, (5) SiN is dry-etched on the top side, and (6) Pt electrodes are deposited on both sides for the anode and the cathode. The size of the opening at the bottom in step 3 determines the resulting size of the freestanding membrane. The silicon wafer may be patterned before step 1 so that the resulting membranes have high surface areas.Reference Su, Chao, Shim, Fasching and Prinz4,Reference Su and Prinz5,Reference Chao, Hsu, Cui and Prinz8,Reference Kim, Gür, Kang, Jung, Sinclair and Prinz9 This is discussed in more detail in the section on grain boundary engineering. As alternate supports for the MEA, glass-ceramic,Reference Muecke, Beckel, Bernard, Bieberle-Hutter, Graf, Infortuna, Müller, Rupp, Schneider and Gauckler21 porous Ni,Reference Kang, Heo, Lee, Ha, Chang and Cha22 anodized aluminum oxide substrates,Reference Park, Su, Cha, Saito and Prinz23–Reference Ha, Su and Cha26 Ni foil,Reference Motoyama, Chao, An, Jung, Gür and Prinz27 and yttria-stabilized zirconia (YSZ) foilReference Evans, Bieberle-Hütter, Rupp and Gauckler15 have also been studied. A comprehensive review of micro-SOFCs with various kinds of substrates, geometries, and cell performance results can be found in Reference 15.
(a) Microelectromechanical (MEMS)-based solid-oxide fuel cells fabricated on a silicon wafer. Grid is 1 cm × 1 cm. (b) Cross-sectional view of the silicon-wafer-based membrane electrode assemblies. (c) Self-standing membrane viewed from the bottom. Reprinted with permission from Reference 3, © 2007 American Chemical Society; and Reference 4, © 2008 Electrochemical Society.

Thin-film electrolyte membranes
One of the important characteristics of MEMS-based SOFCs is the employment of thin-film electrolytes. Two types of solid-oxide thin films have been widely used as electrolytes for MEMS-based SOFCs:Reference Kerman, Lai and Ramanathan28,Reference Beckel, Bieberle-Hütter, Harvey, Infortuna, Muecke, Prestat, Rupp and Gauckler29 oxide-ion conducting oxides with a fluorite structure and proton-conducting oxides with a perovskite structure. Among oxide-ion conducting oxides, YSZ is the most popular electrolyte material for MEMS-based SOFCs as well as for larger-scale SOFCs. Even though the relatively low ionic conductivity of YSZ necessitates operation at high temperatures (800–1000°C), one can significantly lower the operating temperature down to less than 500°C by employing nanoscale thin-film YSZ membranes. Doped ceria, such as gadolinia-doped ceria (GDC) or yttria-doped ceria (YDC), are also frequently used as electrolytes.Reference Huang, Nakamura, Su, Fasching, Saito and Prinz3,Reference Fan, An, Iaucu and Prinz11 Doped ceria electrolytes are known to be susceptible to the onset of electronic conductivity at elevated temperatures and low oxygen activities. On the cathode side, however, they have been used effectively as interlayers to facilitate oxygen reduction kinetics.
Perovskite-based proton-conducting oxides include yttria-doped barium zirconate (BZY) and yttria-doped barium cerate (BCY). They conduct protons through lattice oxygen vacancies via the Grotthuss mechanism (see the article by Fabbri et al. in this issue). Due to their low activation energy for proton transport and relatively high ionic conductivities compared to oxide-ion conducting ceramics with a fluorite structure, these doped perovskite-based proton conductors are interesting candidates for MEMS-based SOFC electrolytes.Reference Shim, Park, An, Gür, Kang and Prinz7,Reference Shim, Kang, Cha, Lee, Kim, Park, Gür, Prinz, Chao and An30
Thin-film electrolyte membranes for MEMS-based SOFCs have been deposited using various thin-film deposition tools, including sputtering, pulsed laser deposition (PLD), and atomic layer deposition (ALD).Reference Beckel, Bieberle-Hütter, Harvey, Infortuna, Muecke, Prestat, Rupp and Gauckler29,Reference Kerman and Ramanathan31 RF sputtering was used to deposit thin-film membranes from oxide targets in an Ar-O2 mixture environment.Reference Huang, Nakamura, Su, Fasching, Saito and Prinz3 Alternatively, DC sputtering can be used to deposit from metallic targets followed by annealing in O2 or an air environment to form the oxide structures.Reference Lee, Jung, Lee, Kim, Park, Sinclair and Prinz32 PLD is also a widely used tool to deposit thin-film electrolytes, in which the plume from a stoichiometric target that is ablated by an energetic laser pulse helps deposit the film on the heated substrate surface.Reference Kim, Holme, Gür and Prinz33–Reference Bae, Jang, Jung, Kim, Son and Shim36 However, thin-film electrolytes fabricated by such methods as sputtering tend to have several issues when employed as electrolyte membranes for MEMS-based SOFCs. At film thicknesses of tens of nanometers, these membranes may show relatively high pinhole densities, resulting in electrical shorting between the top and the bottom electrodes, and/or chemical shorting between the fuel side (anode) and the oxygen side (cathode).
Conversely, pinhole-free uniform thin membranes can be fabricated by ALD, which is a surface-reaction-limited chemical vapor deposition process that enables surface conformal deposition of high-quality thin films over two-dimensional (2D) as well as three-dimensional (3D) structures. Electrolyte membranes fabricated using ALD usually result in dense films with smoother surfaces free of pinholes.Reference Shim, Park, An, Gür, Kang and Prinz7 Also, the relatively low deposition temperatures (typically <300°C) of ALD result in a microstructure with fine nanocrystalline grains (<10 nm) and hence a large grain-boundary density, which turns out to be beneficial for oxide-ion incorporation. The role of grain boundaries in oxygen exchange kinetics is discussed in the section on grain-boundary engineering.
Shim et al. demonstrated the fabrication of MEMS-based SOFCs using atomic layer deposited YSZ electrolyte for the first time.Reference Shim, Chao, Huang and Prinz6 They deposited YSZ by alternating ZrO2 and Y2O3 cycles while controlling the doping ratio by varying the pulse ratio of the Zr- and Y-precursors (e.g., pulse ratio of ZrO2:Y2O3 = 7:1 gives 8 mol% doped YSZ). Similarly, other researchers have also employed ALD to deposit YSZ electrolyte as thin as 50–80 nm.Reference Su, Chao, Shim, Fasching and Prinz4,Reference Chao, Hsu, Cui and Prinz8,Reference Fan, An, Iaucu and Prinz11 Fan et al. demonstrated a MEMS-based bilayer electrolyte SOFC featuring a 70-nm-thick YSZ film with a 10-nm-thick YDC overlayer, all deposited by ALD.Reference Fan and Prinz37,Reference Fan, Chao, Hossei-Babaei and Prinz38 They achieved a 14 mol% doping level for YDC using a 6:1 pulse ratio of CeO2:Y2O3. Similarly, for the fabrication of proton-conducting oxides using ALD, Shim et al. successfully achieved the deposition of dense BZY thin films (∼60 nm thick) by alternating pulses for BaO, ZrO2, and Y2O3 precursors during ALD.Reference Shim, Park, An, Gür, Kang and Prinz7,Reference An, Kim, Park, Shim, Gür and Prinz39 As ALD fabrication involves moderately low temperatures (usually <300°C) and pure metal-organic precursors of the metal cations, the resulting BZY films were dense and of high quality with no detectable impurities or secondary phases at grain boundaries. This is in contrast to the need for extremely high sintering temperatures typically exceeding 1400°C required to make dense BZY, which usually suffers from high grain-boundary resistance.Reference Babilo and Haile40
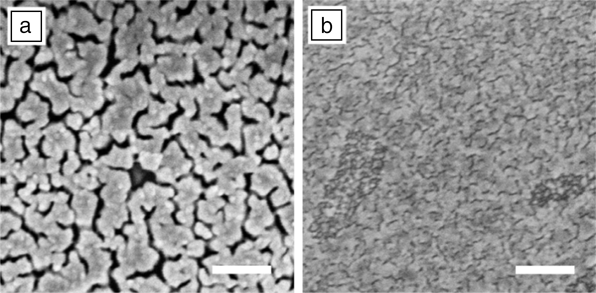
These thin-film MEAs are intended for low-temperature studies, usually below 500°C, hence the choice of effective catalytic electrode materials, especially for ORR, is rather scarce. In this regard, Pt still reigns as the best catalytic electrode material for this temperature regime. Accordingly, porous Pt structures fabricated by thin-film deposition methods (e.g., sputtering, ALD) have been widely used (Figure 2).Reference Huang, Nakamura, Su, Fasching, Saito and Prinz3,Reference An, Kim and Prinz41 Such porous Pt structures exhibit high catalytic activity as well as extremely low material loading (e.g., 0.02 mg cm–2).Reference An, Kim and Prinz41 In addition, nanoscale pores ensure a high density of triple phase boundaries (i.e., the interface where electrode, electrolyte, and the gas phases meet), which play a crucial role in enabling high performance for MEMS-based SOFCs.
Scanning electron microscope images of porous thin-film Pt electrodes fabricated by (a) DC sputtering (80 nm in thickness) and (b) atomic layer deposition (10 nm in thickness). Bright regions represent Pt, and dark regions represent pores. Scale bars are 200 nm.
With nanoscale thin-film electrolytes, the contribution of the ohmic loss to the total cell losses becomes significantly smaller than that of the activation loss. For example, in MEMS-based SOFCs with ALD YSZ (50 nm) + PLD YDC (10 nm) bilayer electrolyte, the contribution of the ohmic loss to the total losses is <1% at OCV and <10% at a cell voltage of 0.5 V, respectively,Reference An, Kim, Park, Gür and Prinz12 while the major portion of the remaining loss stems from the cathodic activation process for ORR. In this regard, understanding and engineering the cathode interface is extremely important to further enhance the performance of MEMS-based SOFCs, which can serve as an attractive testbed for exploring cathode interface engineering.
Grain-boundary engineering at the cathode interface
Role of surface grain boundaries
Nanoscale thin-film electrolytes employed in MEMS-based SOFCs usually have a large density of grain boundaries due to their fine-grain nature. It has been reported that grain boundaries at the cathode/electrolyte interface are of great importance in enhancing the oxygen reduction kinetics in SOFCs.Reference Lee, Jung, Lee, Kim, Park, Sinclair and Prinz32,Reference Kim, Shim, Gür and Prinz34,Reference Kim, Park, Gür and Prinz35,Reference Shim, Park, Holme, Crabb, Lee, Kim, Tian, Gür and Prinz42 Oxide-ion incorporation is greatly facilitated by these surface grain boundaries. Thin-film electrolytes with high surface grain-boundary density consistently show higher exchange current density, j 0, than their single crystalline counterparts by several orders of magnitude due to the increase of j 0' in Equation 3 and, therefore, smaller activation loss as implied by Equation 2. This has been supported by experimental observations using secondary ion mass spectroscopy (SIMS) and electrochemical impedance spectroscopy (EIS).
Shim et al. used a NanoSIMS-50L instrument from Cameca, which performs SIMS with a lateral resolution of about 70 nm, to investigate the oxygen isotope exchange rate at surface grain boundaries of polycrystalline YSZ.Reference Shim, Park, Holme, Crabb, Lee, Kim, Tian, Gür and Prinz42 They annealed the polycrystalline YSZ in an 18O2 environment so that the exchange reaction between 16O inside YSZ and 18O in the environment can take place. Surface mapping of 18O and 16O ions clearly indicates the preferential enrichment of 18O along grain boundaries both under non-biased condition and cathodically biased conditions that imitate the cell voltage (Figure 3a and 3c). It is observed that the incorporation enhancement near the surface grain boundaries was not as prominent in the absence of an external bias as under cathodically biased conditions. This is because ORR tends to be driven more strongly by electrical potential, and therefore the oxide-ion incorporation rate is higher under electrical bias, accentuating the local differences in the oxide ion-incorporation rate. These results clearly demonstrate the active role of grain boundaries intersecting external surfaces of YSZ as preferential pathways for enhancing ORR.
Scanning electron microscope image of (a) a polycrystalline yttria-stabilized zirconia (YSZ) surface and (b) a polycrystalline yttria-doped ceria (YDC) surface showing distinct grain boundaries. 18O/16O concentration obtained from secondary ion mass spectroscopy spatial scans of (c) the polycrystalline YSZ surface and (d) the polycrystalline YDC surface. Yellow and red indicate regions of a higher 18O/16O ratio that trace along the grain boundaries than the center-of-grains denoted by blue regions. Reprinted with permission from Reference 35, © 2011 Elsevier; and Reference 42, © 2012 Elsevier.
Similarly, Kim et al. reported that oxygen exchange is enhanced along the grain boundaries at the surface of polycrystalline YDC.Reference Kim, Park, Gür and Prinz35 This is depicted in Figure 3b and 3d, which shows NanoSIMS mapping of the Reference Lai, Kerman and Ramanathan18O versus 16O concentrations on the surface of polycrystalline YDC. They confirmed that enhancement of oxygen exchange along surface grain boundaries is not a phenomenon unique to YSZ and doped ceria only, but is likely to be generalized to other fluorite structure oxides and possibly to perovskite oxides as well.Reference Horita, Yamaji, Sakai, Yokokawa, Kawada and Kato43,Reference Fleig44
Preferential exchange of oxygen at the surface grain boundaries causes the surface exchange coefficient or exchange current density at the nanocrystalline electrolyte surface to be significantly higher than that at the microcrystalline or single crystalline electrolyte surfaces. Huang et al. revealed that the surface exchange coefficient on an ALD-grown nanocrystalline (grain size ∼20 nm) YSZ surface is 2–3 times higher than that on a single crystalline YSZ(100) surface, using data extracted from the SIMS spectra.Reference Horita, Yamaji, Sakai, Yokokawa, Kawada and Kato43 Lee et al. compared the exchange current densities at the surfaces of nanocrystalline (grain size ∼ hundreds of nanometers) and microcrystalline (grain size ∼ a few micrometers) GDC films prepared by annealing at different temperatures (1100°C and 1400°C, respectively).Reference Lee, Jung, Lee, Kim, Park, Sinclair and Prinz32 They found that the exchange current density at the nanocrystalline GDC surface is also 2–3 times higher than that at the microcrystalline GDC surface, which corresponds reasonably well to the result at the YSZ surface obtained by Huang. An and Kim also showed that the exchange current density at the nanocrystalline (grain size ∼ tens of nanometers) YDC surface is several orders of magnitude higher than that at the microcrystalline YDC surface,Reference An, Kim, Park, Gür and Prinz12 and the exchange current densities of nanocrystalline YDCs with slightly different grain sizes also differ from each other.Reference Kim, Park, Gür and Prinz35 Interestingly, the exchange current density in YDC increases 2–3 times when the grain size is reduced from 52 ± 15 nm to 38 ± 2 nm.
The activation resistance, and the resulting activation loss, at the cathode interface is significantly reduced by an electrolyte surface featuring a high grain boundary density that facilitates a high surface exchange rate. Shim et al. systematically controlled the grain size of their as-deposited nanocrystalline YSZ thin films by thermal annealing.Reference Shim, Park, Holme, Crabb, Lee, Kim, Tian, Gür and Prinz42 EIS spectra revealed that the cathodic impedance decreases as the average grain size at the electrolyte surface increases. For example, the cathodic impedance at the surface of as-deposited PLD YSZ thin films (grain size ∼50–60 nm) is approximately one order of magnitude smaller than that at the surface of annealed (at 1450°C) PLD YSZ thin films (grain size ∼3–5 μm). Kim and Lee observed a similar trend for doped ceria.Reference Lee, Jung, Lee, Kim, Park, Sinclair and Prinz32,Reference Kim, Shim, Gür and Prinz34 For YDC, the cathodic impedance at the surface of as-deposited PLD YDC thin films (grain size ∼40–70 nm) is 6–7 times smaller than that at the surface of annealed (at 1500°C) PLD YDC thin films (grain size ∼5–7 μm). For GDC, the cathodic impedance at the surface of nanocrystalline sputtered GDC thin films (grain size ∼ hundreds of nanometers) is ∼2 times smaller than that at the surface of microcrystalline sputtered GDC thin films (grain size ∼ a few micrometers).
Grain-boundary defect structure influences surface exchange
While it is clear that the cathodic activation loss decreases as the surface grain-boundary density increases, as discussed in the previous section, the activation energy for the cathode reaction kinetics does not change significantly with surface grain-boundary density. Indeed, the activation energies of cathodic kinetic processes at the YSZ surfaces of different size grains (50 nm to 5 μm) were reported to be similar to each other at 0.55 eV. Rather, the high concentration or segregation of the oxide-ion vacancies near the grain boundary seems to be responsible for the enhancement in oxide-ion incorporation.Reference Shim, Park, Holme, Crabb, Lee, Kim, Tian, Gür and Prinz42
The segregation of oxide-ion vacancies near grain boundaries has been demonstrated at the atomic scale both in simulations and in experiments. Using hybrid Monte Carlo (MC)–molecular dynamics (MDs) simulations, Lee et al. showed that the oxide-ion vacancies segregate to the vicinity of grain-boundary cores (Σ5 (310)/[001] symmetric tilt type), having a width of 1–2 nm in nanocrystalline YSZ and GDC.Reference Lee, Prinz and Cai45 Using Kelvin probe microscopy, Lee et al. experimentally confirmed that GDC surface grain boundaries are indeed charged positively by 100–150 mV with respect to the grain surface, providing indirect evidence for positively charged oxide-ion vacancies segregating preferentially to grain boundaries.Reference Lee, Jung, Lee, Kim, Park, Sinclair and Prinz32 An et al. further investigated the oxide-ion vacancy segregation near the single Σ13 (510)/[001] symmetric tilt grain boundary of bicrystal YSZ at atomic resolution using an aberration-corrected transmission electron microscope (Figure 4).Reference An, Park, Koh, Lee, Jung, Schoonman, Sinclair, Gür and Prinz46,Reference An, Koh, Park, Sinclair, Gür and Prinz47 They quantified the occupancies of oxygen columns near the grain boundary using the negative spherical aberration (C s) imaging technique, revealing that the oxygen columns at the grain-boundary core have a higher population of vacant sites than those away from the grain boundary, which has a core with a width of approximately 2 nm that corresponds well to the results from MC–MD simulations.
(a) Aberration-corrected transmission electron microscope image across a Σ13 (510)/[001] symmetric tilt grain boundary (GB) (vertical dotted line) of a yttria-stabilized zirconia bicrystal at negative-C s imaging conditions with oxygen columns in color code corresponding to their normalized image intensity (normalized by maximum oxygen column intensity). (b) Intensities of individual atomic columns corresponding to the occupancies of the columns. Reprinted with permission from Reference 46. © 2013 Nature Publishing Group.
In parallel, Chao et al. demonstrated that a surface modification layer with a thickness of about 1 nm with enhanced oxide-ion vacancy concentration can improve the power density of a thin-film SOFC.Reference Chao, Park, Tian, Shim, Gür and Prinz13,Reference Chao, Kim and Prinz48 Chao et al. coated the cathode surface of the electrolyte with ALD YSZ of a higher doping level (14–19 mol%), beyond the optimal doping level for ionic conductivity (8 mol%). They observed a fivefold increase of the surface exchange coefficient, which corresponds well to the enhanced oxygen exchange on surfaces with high oxide-ion vacancy concentration.
Engineering of three-dimensional MEAs
Another way to improve cell performance is to spread the exchange current density, j 0, over a larger active cell area, thereby reducing the activation loss. Indeed, high surface area MEAs can be fabricated from 3D structured templates and thereby increase A/A' in Equation 3. Depending on the structure and dimensions of the underlying templates on which the MEA components are fabricated, area enhancement factors (i.e., A/A') ranging from 2 to 20 can be achieved.
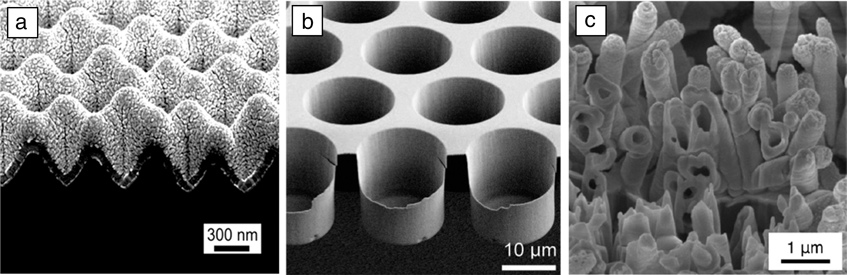
Chao et al. first demonstrated a corrugated MEA architecture based on an ALD YSZ electrolyte (80 nm thick), which was deposited on a template fabricated by nanosphere lithography (NSL).Reference Chao, Hsu, Cui and Prinz8 They used a wafer-scale self-assembly nanotexturing technique to pattern the silicon wafer, and the pattern was transferred to the MEA. They were able to form close-packed patterns without using conventional lithography techniques, and effectively enhanced the surface area by a factor of 1.6–2. Consequently, the exchange current density of the corrugated MEA showed approximately a twofold increase compared to that of the planar MEA. The enhancement in the exchange current density was in good agreement with the geometric enhancement of the active cell area. The activation loss therefore decreased by 30%, and the maximum power density increased from 0.56 W cm–2 (planar) to 0.82 W cm–2 (corrugated) at 450°C. An et al. reported that a similar approach can be applied to fabricate a MEA featuring a PLD YDC (10 nm) + ALD YSZ (50 nm) bilayer electrolyte (Figure 5a).Reference An, Kim, Park, Gür and Prinz12 Compared to the planar YDC + YSZ bilayer MEA, they observed a 1.8-fold enhancement in the maximum power density that corresponds well to the area enhancement factor. Using this 3D MEA architecture, they were able to achieve 1.3 W cm–2 at 450°C, which represents the highest power density reported so far at this temperature.
Images of three-dimensional micro-solid-oxide fuel cell architectures demonstrated with fully functional membrane electrode assemblies in (a) corrugated, (b) cup-shaped, and (c) nanotubular structures. Reprinted with permission from Reference 12, © 2013 American Chemical Society; Reference 4, © 2008 American Chemical Society; and Reference 27, © 2014 American Chemical Society.
Patterning methods using NSL were also employed to fabricate 3D MEAs featuring protonic conducting thin-film BZY electrolyte membranes deposited by PLD.Reference Kim, Gür, Kang, Jung, Sinclair and Prinz9 The BZY electrolyte membranes successfully covered the 3D structured template, and the resulting MEA showed ∼1.5-fold increase in the maximum power density compared to its planar counterpart, demonstrating up to 186 mW cm–2 at 450°C using hydrogen as fuel.
Su et al. observed the behavior of a cup-shaped MEA with ALD YSZ electrolyte fabricated on a patterned silicon wafer using photolithography (Figure 5b).Reference Su, Chao, Shim, Fasching and Prinz4 This structure exhibited an array of cup-shaped trenches with a diameter of 15 μm and a depth of 10–40 μm, which resulted in an increase of electrochemically active sites per projected unit area by a factor of about 5. Even though the actual power density enhancement was only twofold compared to the planar one, possibly due to non-uniformity of the electrode layer deposited by sputtering and the imperfect removal of the underlying SiN layer, the activation loss was effectively reduced, resulting in a high maximum power density of 0.86 W cm–2 at 450°C.
Although far removed from conventional MEMS processing, aqueous electrodeposition and electro-dissolution methods can also be employed to fabricate 3D SOFC MEAs. For example, using these methods, Motoyama et al. demonstrated a nanotubular array of MEAs made of a one-end-closed hollow tube Ni/ALD YSZ/Pt (Figure 5c).Reference Motoyama, Chao, An, Jung, Gür and Prinz27 The dimensions of the tubular MEAs were ∼5 μm in length and <500 nm in width (outside diameter) with a total MEA thickness of approximately 50 nm, which resulted in an area enhancement factor of about 20. Motoyama achieved a low OCV of 0.66 V with H2 fuel and an extremely low maximum power density of 1.3 μW cm–2 at 550°C, possibly due to chemical shorting between the anode and cathode through hollow tubes. Nevertheless, such exceptionally high enhancement factors may represent a pathway toward achieving high power density in ultrathin SOFCs operating at intermediate to low temperatures.
Conclusions
MEMS and other microprocessing techniques are effective tools compatible with thin-film MEA fabrication methodologies that help expand SOFC architectures to beyond planar geometries and to low operating temperatures. More importantly, these thin-film MEAs serve as excellent platforms to investigate and elucidate electrode rate processes well separated from ohmic losses. Related examples were discussed to illustrate the impact of microstructure control at the nanoscale, particularly of grain size and surface grain-boundary density, where it was shown that increased grain-boundary density at the electrolyte/cathode interface improves the ORR kinetics at the cathode interface. Moreover, the 3D architecture of SOFC MEAs offers the capacity to significantly increase the active cell area, thereby resulting in improved cell performance. Long-term stability of these MEAs (e.g., due to degradation of electrodesReference An, Kim and Prinz41,Reference Ryll, Galinski, Schlagenhauf, Elser, Rupp, Bieberle-Hütter and Gauckler49 ) is uncertain and yet to be verified. Materials properties as well as cell operating conditions will also impact MEA durability. Although the prospects of thin-film SOFCs for practical applications may be uncertain in spite of recent demonstrations of scaled-up MEAs,Reference Su and Prinz5,Reference Tsuchiya, Lai and Ramanathan19 they nevertheless serve as excellent testbeds for fuel cell research.
Acknowledgments
Work at Stanford University by J.A., T.M.G., and F.B.P. was supported, in part, by the Center on Nanostructuring for Efficient Energy Conversion (CNEEC), an Energy Frontier Research Center funded by the US Department of Energy, Office of Science, Office of Basic Energy Sciences under Award Number DE-SC0001060. S.J.H. is also grateful to the Fusion Research Program for Green Technologies of the National Research Foundation (NRF) of Korea funded by the Ministry of Education, Science, and Technology (MEST) (Grant No. NRF-2011–0019300) for their financial support.