INTRODUCTION
Estuaries are highly dynamic systems and, despite comprising a relatively small overall portion of marine ecosystems, they contribute ~8% of total marine primary production (Longhurst et al., Reference Longhurst, Sathyendranath, Platt and Caverhill1995). The majority of estuaries have experienced a series of ecological disturbances due to nitrogen, phosphorus and organic material (OM) enrichment via anthropogenic sources (Guenther et al., Reference Guenther, Paranhos, Rezende, Gonzalez-Rodriguez and Valentin2008; Chen et al., Reference Chen, Liu, Landry, Chen, Sun, Shek, Chen and Harrison2009; Verity & Borkman, Reference Verity and Borkman2010). Such ecological changes can stimulate algal growth and bacterial production, shifting species and size composition of the plankton food web (Justić et al., Reference Justić, Rabalais and Turner1995; Verity & Borkman, Reference Verity and Borkman2010). Nitrogen and phosphorus inputs tend to increase primary production, which, in addition to OM enrichment, favours bacterial metabolism (Verity & Borkman, Reference Verity and Borkman2010). Moreover, phytoplankton growth is usually light-limited in eutrophic estuaries due to the high concentration of particulate material, leading to the selection of smaller cells over larger ones due to their higher light absorption efficiencies and lower sinking rates (Finkel et al., Reference Finkel, Vaillancourt, Irwin, Reavie and Smol2009).
It is well recognized that cell (body) size is an important trait in shaping marine plankton communities, influencing characteristics such as resource acquisition, vital rates (e.g. growth, metabolism, feeding), swimming speeds and prey and predator size (Hansen et al., Reference Hansen, Koefoed and Hansen1997; Barton et al., Reference Barton, Pershing, Litchman, Record, Edwards, Finkel, Kiørboe and Ward2013). Excepting dinoflagellates, which can feed on prey twice their size, zooplankton typically feed on prey that are smaller than themselves (Hansen et al., Reference Hansen, Bjørsen and Hansen1994; Barton et al., Reference Barton, Pershing, Litchman, Record, Edwards, Finkel, Kiørboe and Ward2013). Thus, the size of the dominant primary producer dictates the size-structure of the rest of the plankton food web (Fenchel, Reference Fenchel1988). Since eutrophication tends to decrease producer size, an increase in the number of trophic levels in the estuarine food web is expected, inducing a higher loss through respiration and reducing the transfer efficiency of carbon to upper trophic levels (i.e. fish) (Justić et al., Reference Justić, Rabalais and Turner1995; Verity & Borkman, Reference Verity and Borkman2010). Determining the main pathway by which organic matter reaches higher trophic levels is important for the understanding and management of ecosystems.
The temporal variability of plankton communities in estuarine systems is often higher in a diel scale than over scales of days due to the fast response of plankton to changes in environmental conditions such as the hydrodynamics determined by tides, rainfall and river discharge (Iriarte et al., Reference Iriarte, Madariaga, Revilla and Sarobe2003; Parvathi et al., Reference Parvathi, Jasna, Haridevi, Jina, Greeshma, Breezy and Nair2013). Lagrangian sampling allows the following of the same plankton community over scales of hours without manipulation or confinement artefacts (Fuhrman et al., Reference Fuhrman, Eppley, Hagström and Azam1985; Teira et al., Reference Teira, Martínez-García, Fernández, Calvo-Díaz and Morán2010), and enables the determination of oscillations in plankton biomass. In contrast, observations at fixed locations may lead to misinterpretations of plankton dynamics over time because of the water flows and associated biota past the site (Landry et al., Reference Landry, Ohman, Goericke, Stukel and Tsyrklevich2009). Indeed, the Lagrangian strategy has been used in trophodynamic studies in various contexts ranging from oligotrophic gyres to coastal systems (Morales et al., Reference Morales, Harris, Head and Tranter1993; Landry et al., Reference Landry, Ohman, Goericke, Stukel and Tsyrklevich2009; Teira et al., Reference Teira, Martínez-García, Fernández, Calvo-Díaz and Morán2010). Through the Lagrangian approach, combined with a fine temporal-scale sampling (i.e. hours), one may assume that the biomass variations of the planktonic groups (except metazooplankton) over time are predominantly associated with predation and production, once no mixing water events are observed by measuring the physical and chemical properties associated to the water parcel.
Previous studies suggest that small cells compose the base of the plankton food web in eutrophic estuaries, and are highly consumed by microzooplankton (Gifford, Reference Gifford1988; McManus & Ederington-Cantrell, Reference McManus and Ederington-Cantrell1992; Froneman & McQuaid, Reference Froneman and McQuaid1997; Zhang & Wang, Reference Zhang and Wang2000; Froneman, Reference Froneman2002; Chen et al., Reference Chen, Liu, Landry, Chen, Sun, Shek, Chen and Harrison2009); larger zooplankton are not expected to be important grazers because they are not able to feed on such small prey (Froneman, Reference Froneman2002; Verity & Borkman, Reference Verity and Borkman2010). We hypothesized that in a highly eutrophic estuary (Guanabara Bay, south-eastern Brazil) small cells compose the base of the planktonic food web and that microzooplankton is the main consumer of primary production. Our goal was to estimate the potential ingestion of microzooplankton and copepods, taking into account predator-prey size relationships. We conducted a one-day Lagrangian study during the austral spring to investigate the planktonic trophodynamics in Guanabara Bay under the influence of the cold, nutrient-rich South Atlantic Coastal Water (SACW) in a diel basis. The entrance of upwelling water in the bay occurs predominantly during spring, despite SACW having been detected in other periods of the year (Kjerfve et al., Reference Kjerfve, Ribeiro, Dias, Filippo and Quaresma1997; Fistarol et al., Reference Fistarol, Coutinho, Moreira, Venas, Cánovas, de Paula, Coutinho, de Moura, Valentin, Tenenbaum, Paranhos, Valle, Vicente, Filho, Pereira, Kruger, Rezende, Thompson, Salomon and Thompson2015). Our analysis suggests that plankton trophodynamics in Guanabara Bay, at least under upwelling influence, differ from other eutrophic estuaries around the world. The effect of the entrance of SACW in Guanabara Bay is a case study of particular interest as a eutrophic coastal region which is periodically modified and ‘cleaned’ by the entrance of upwelling waters.
MATERIALS AND METHODS
Study area and sampling
Guanabara Bay, located on the south-eastern Brazilian continental shelf of Rio de Janeiro State (22°50′S 43°10′W), has a length of 36 km, an area of 384 km2, and a mean annual discharge of 100 m3 s−1 from nine tributaries. The study area features only one connection (1.6 km width) with the ocean, with a maximum depth of ~40 m in the navigation channel and a semi-diurnal tide. The turnover time of 50% of the bay water volume is estimated at 11.4 days (Kjerfve et al., Reference Kjerfve, Ribeiro, Dias, Filippo and Quaresma1997). Guanabara Bay is influenced by the South Atlantic Central Water (SACW), a cold and nutrient-rich water mass that ascends during the austral spring and summer as the Brazil current turns from the coast (Fistarol et al., Reference Fistarol, Coutinho, Moreira, Venas, Cánovas, de Paula, Coutinho, de Moura, Valentin, Tenenbaum, Paranhos, Valle, Vicente, Filho, Pereira, Kruger, Rezende, Thompson, Salomon and Thompson2015). The bay water's characteristics are driven mainly by rainfall and sewage discharges, making the system a highly eutrophic estuary, and tidal currents, which decrease the eutrophic status of the system. In fact, dissolved nutrient and chlorophyll-a concentrations increase in a gradient from the entrance to the inner portions of the bay (total nitrogen: from 28 to 177 µM and chlorophyll-a: from 14 to 141 g l−1), whereas dissolved oxygen and suspended matter concentration decrease along the same gradient (dissolved oxygen: from 3.3 to 2.3 ml l−1 and suspended matter: from 50 to 34 mg l−1), indicating that the eutrophication status of the bay deteriorates from eutrophic to highly eutrophic (Santos et al., Reference Santos, Villac, Tenenbaum and Paranhos2007).
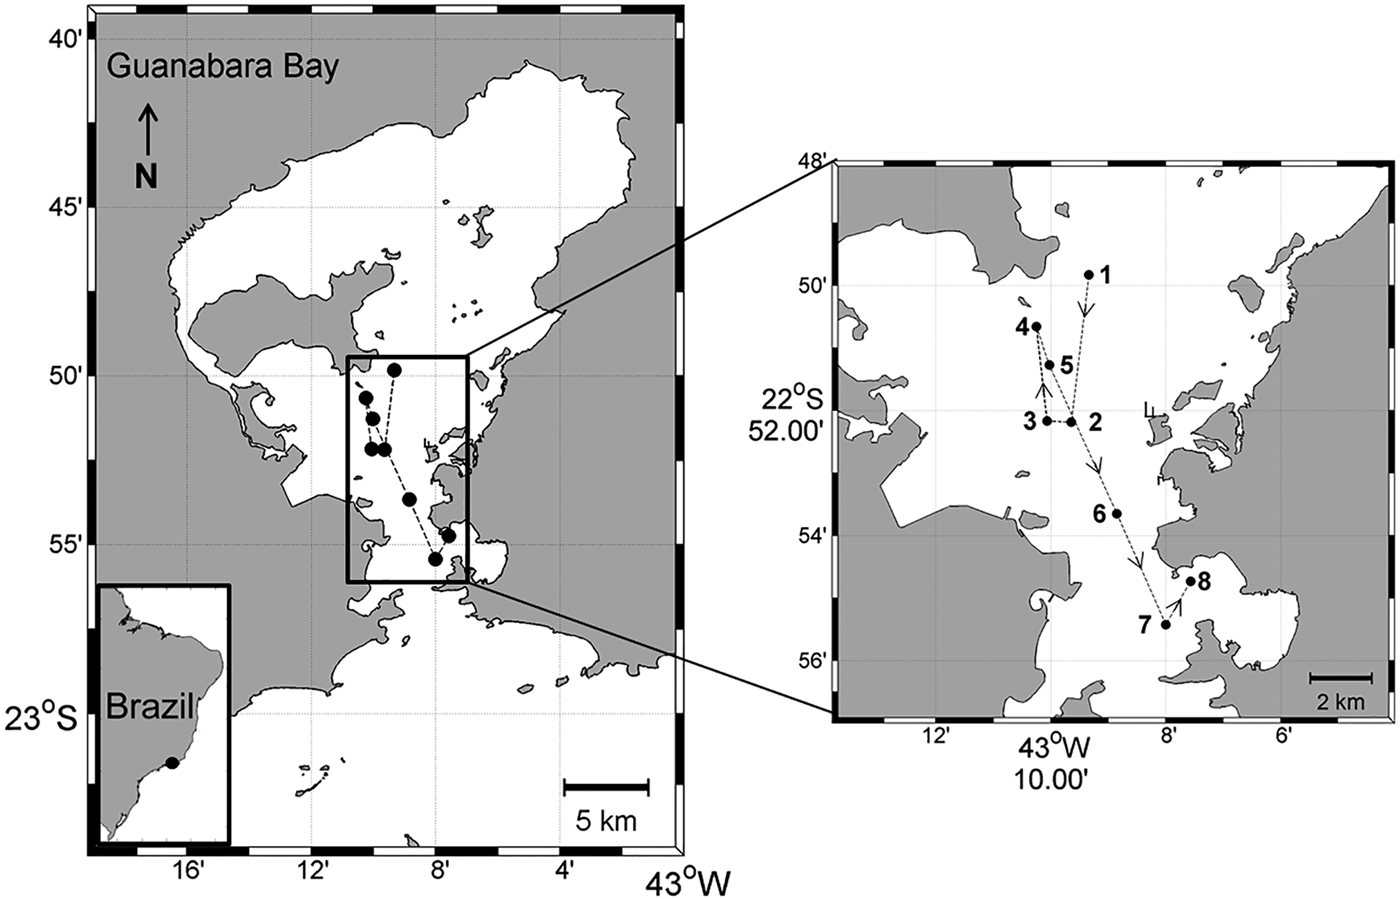
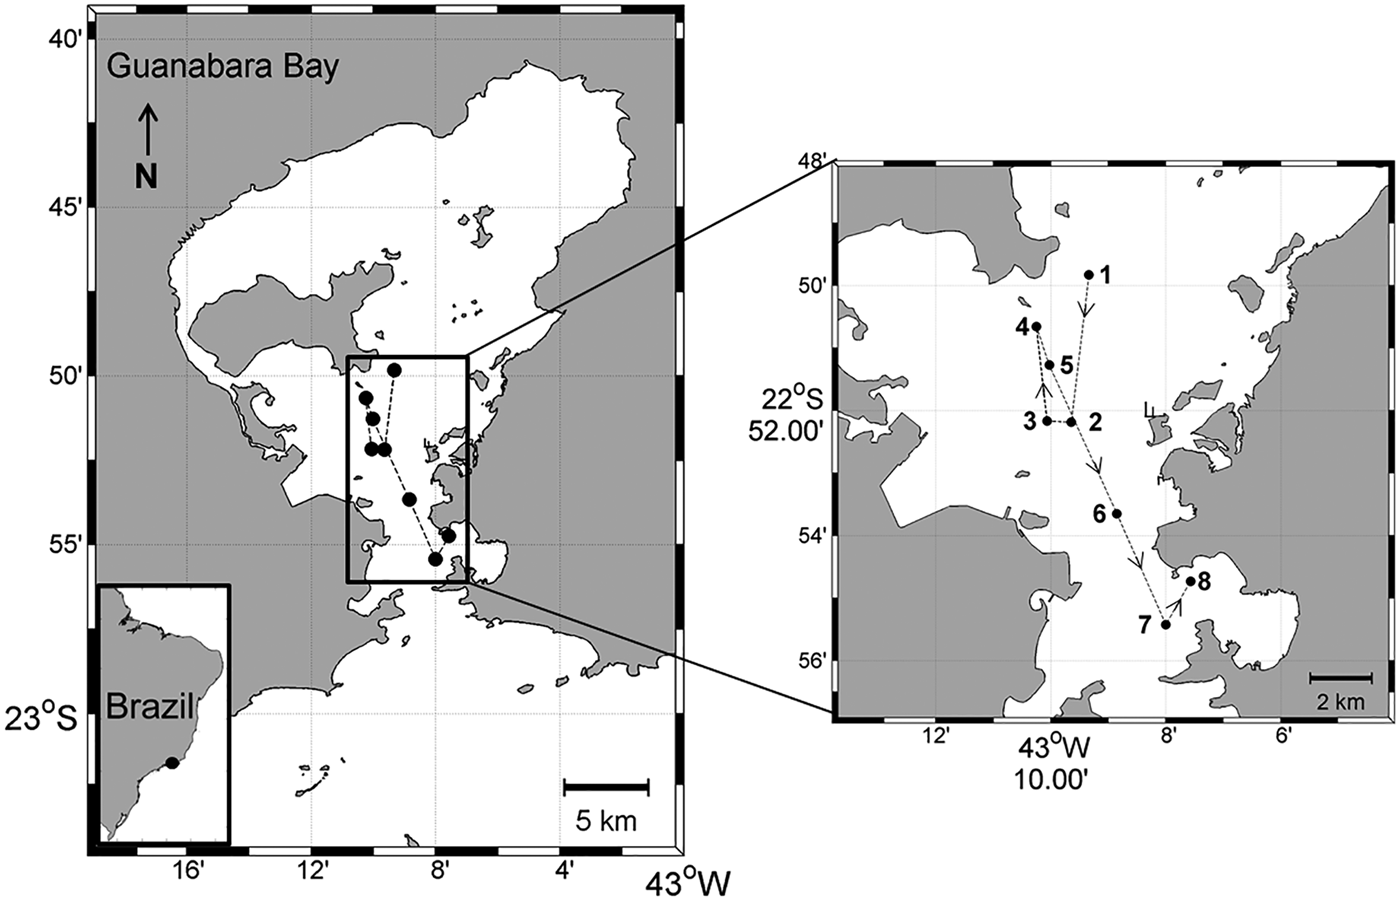
The 1-day (22–23 September 2010) Lagrangian sampling was conducted in Guanabara Bay during the dry season and austral spring in order to capture the influence of SACW in the bay. A drifting buoy deployed on the central part of the bay (22°49′49.5″S 43°09′20.2″W; Figure 1) was used to follow the surface water parcel. The buoy was released at a location chosen according to the tide so as to avoid its exit from the study area. Water samples and vertical profiles were obtained every 3 h from 1600 h on 22 September to 1300 h on 23 September, always next to the Lagrangian buoy; a GPS was used to identify the station coordinates (Figure 1). A Seacat SBE–19 CTD (Seabird Inc.) was used to obtain vertical profiles of temperature and salinity.
The study area (Guanabara Bay, Brazil) showing the sampling stations (1–8) along the buoy trajectory. Sampling started at 1600 h (station 1) on 22 September 2010 and finished at 1300 h (station 8) on 23 September 2010.
Water samples for measurement of dissolved inorganic nutrients (ammonium, nitrite, nitrate, phosphate and silicate) and biological (chlorophyll-a, pico-, nano- and microplankton) analyses were collected near the surface using Niskin bottles (5 l). Aliquots of seawater were separated into polypropylene flasks that had previously been rinsed with water from the sample and frozen until the dissolved inorganic nutrients were analysed. Water samples (100–500 ml) for chlorophyll-a concentration determination were filtrated through GF/F filters (47 mm diameter) and kept on ice until analysis. Water samples for picoplankton determination were preserved with 2% paraformaldehyde, while nano- and microplankton water samples were preserved with 2% Lugol's iodine, following the recommendation by Gifford & Caron (Reference Gifford, Caron, Harris, Wiebe, Lenz, Skjoldal and Huntley2000). Copepods were collected in triplicate by surface horizontal hauls using nets of both 64 and 200 µm mesh size (0.3 and 0.6 m of diameter, respectively), with a flowmeter attached in each net; copepods were preserved with 4% Borax buffered formaldehyde. Nets of two different sizes were used in order to avoid incorrectly estimating copepod density and biomass. As the estimates of copepod density and biomass were higher when using the 64 µm mesh, both overall (Wilcoxon test, U = 300, P < 0.0001) and for adult copepods (Wilcoxon test, U = 220, P = 0.045), only the data obtained with this mesh size was used and presented on this study.
Hydrographic and chemical characteristics
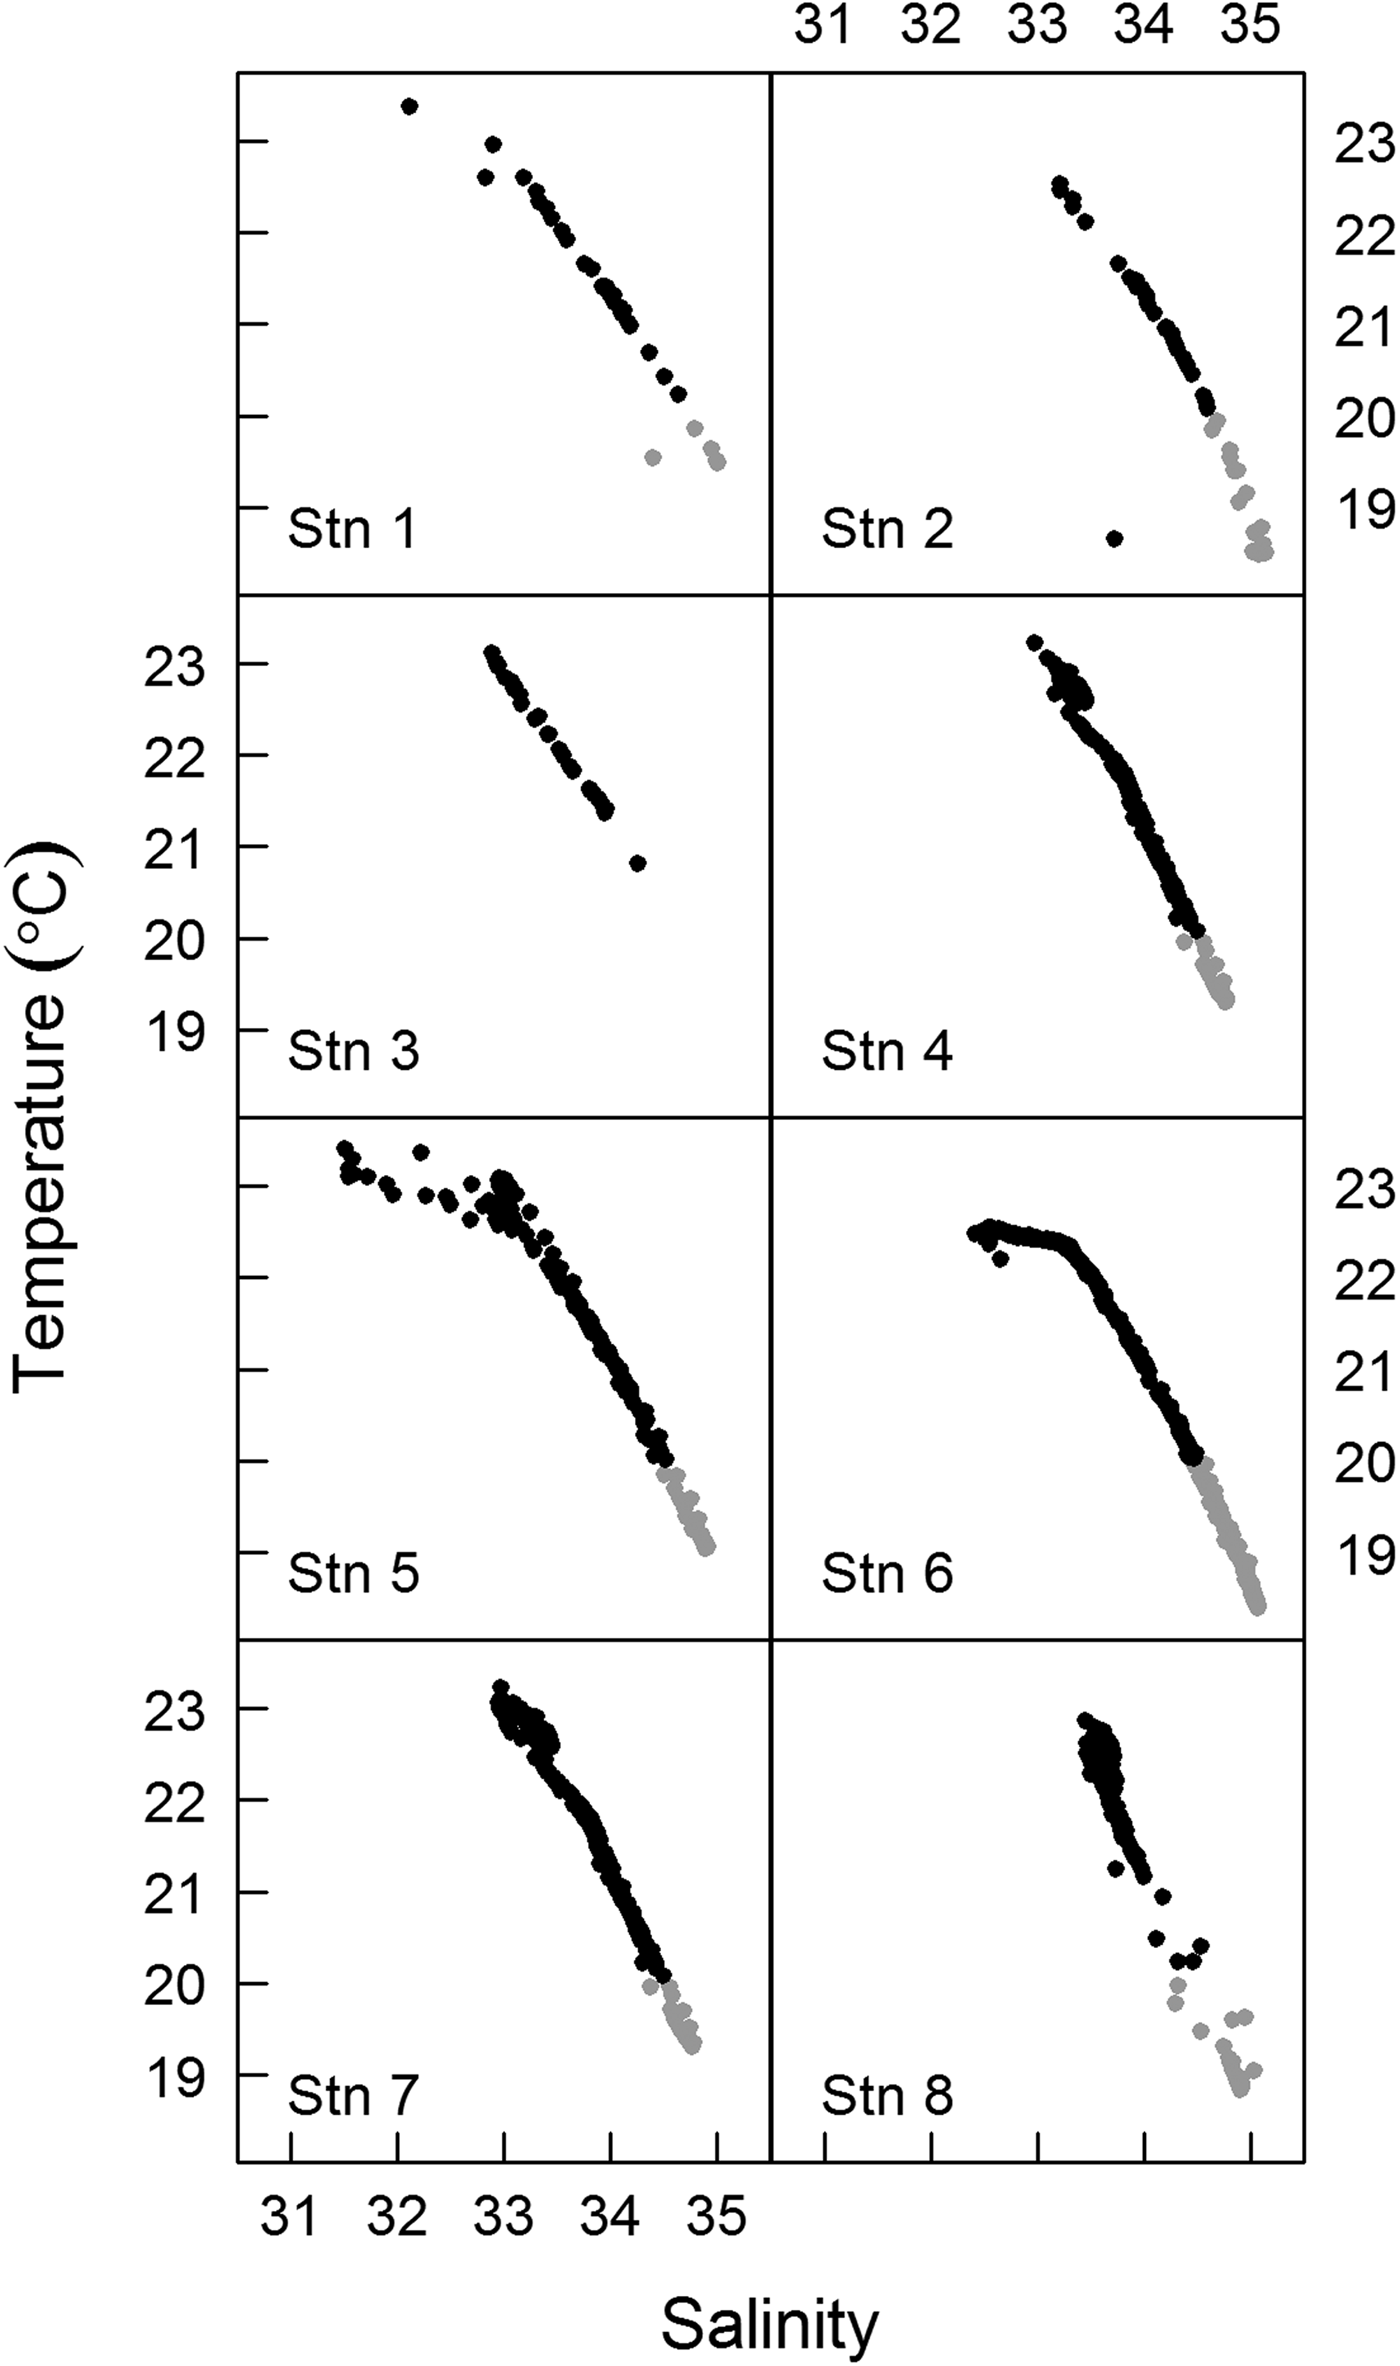
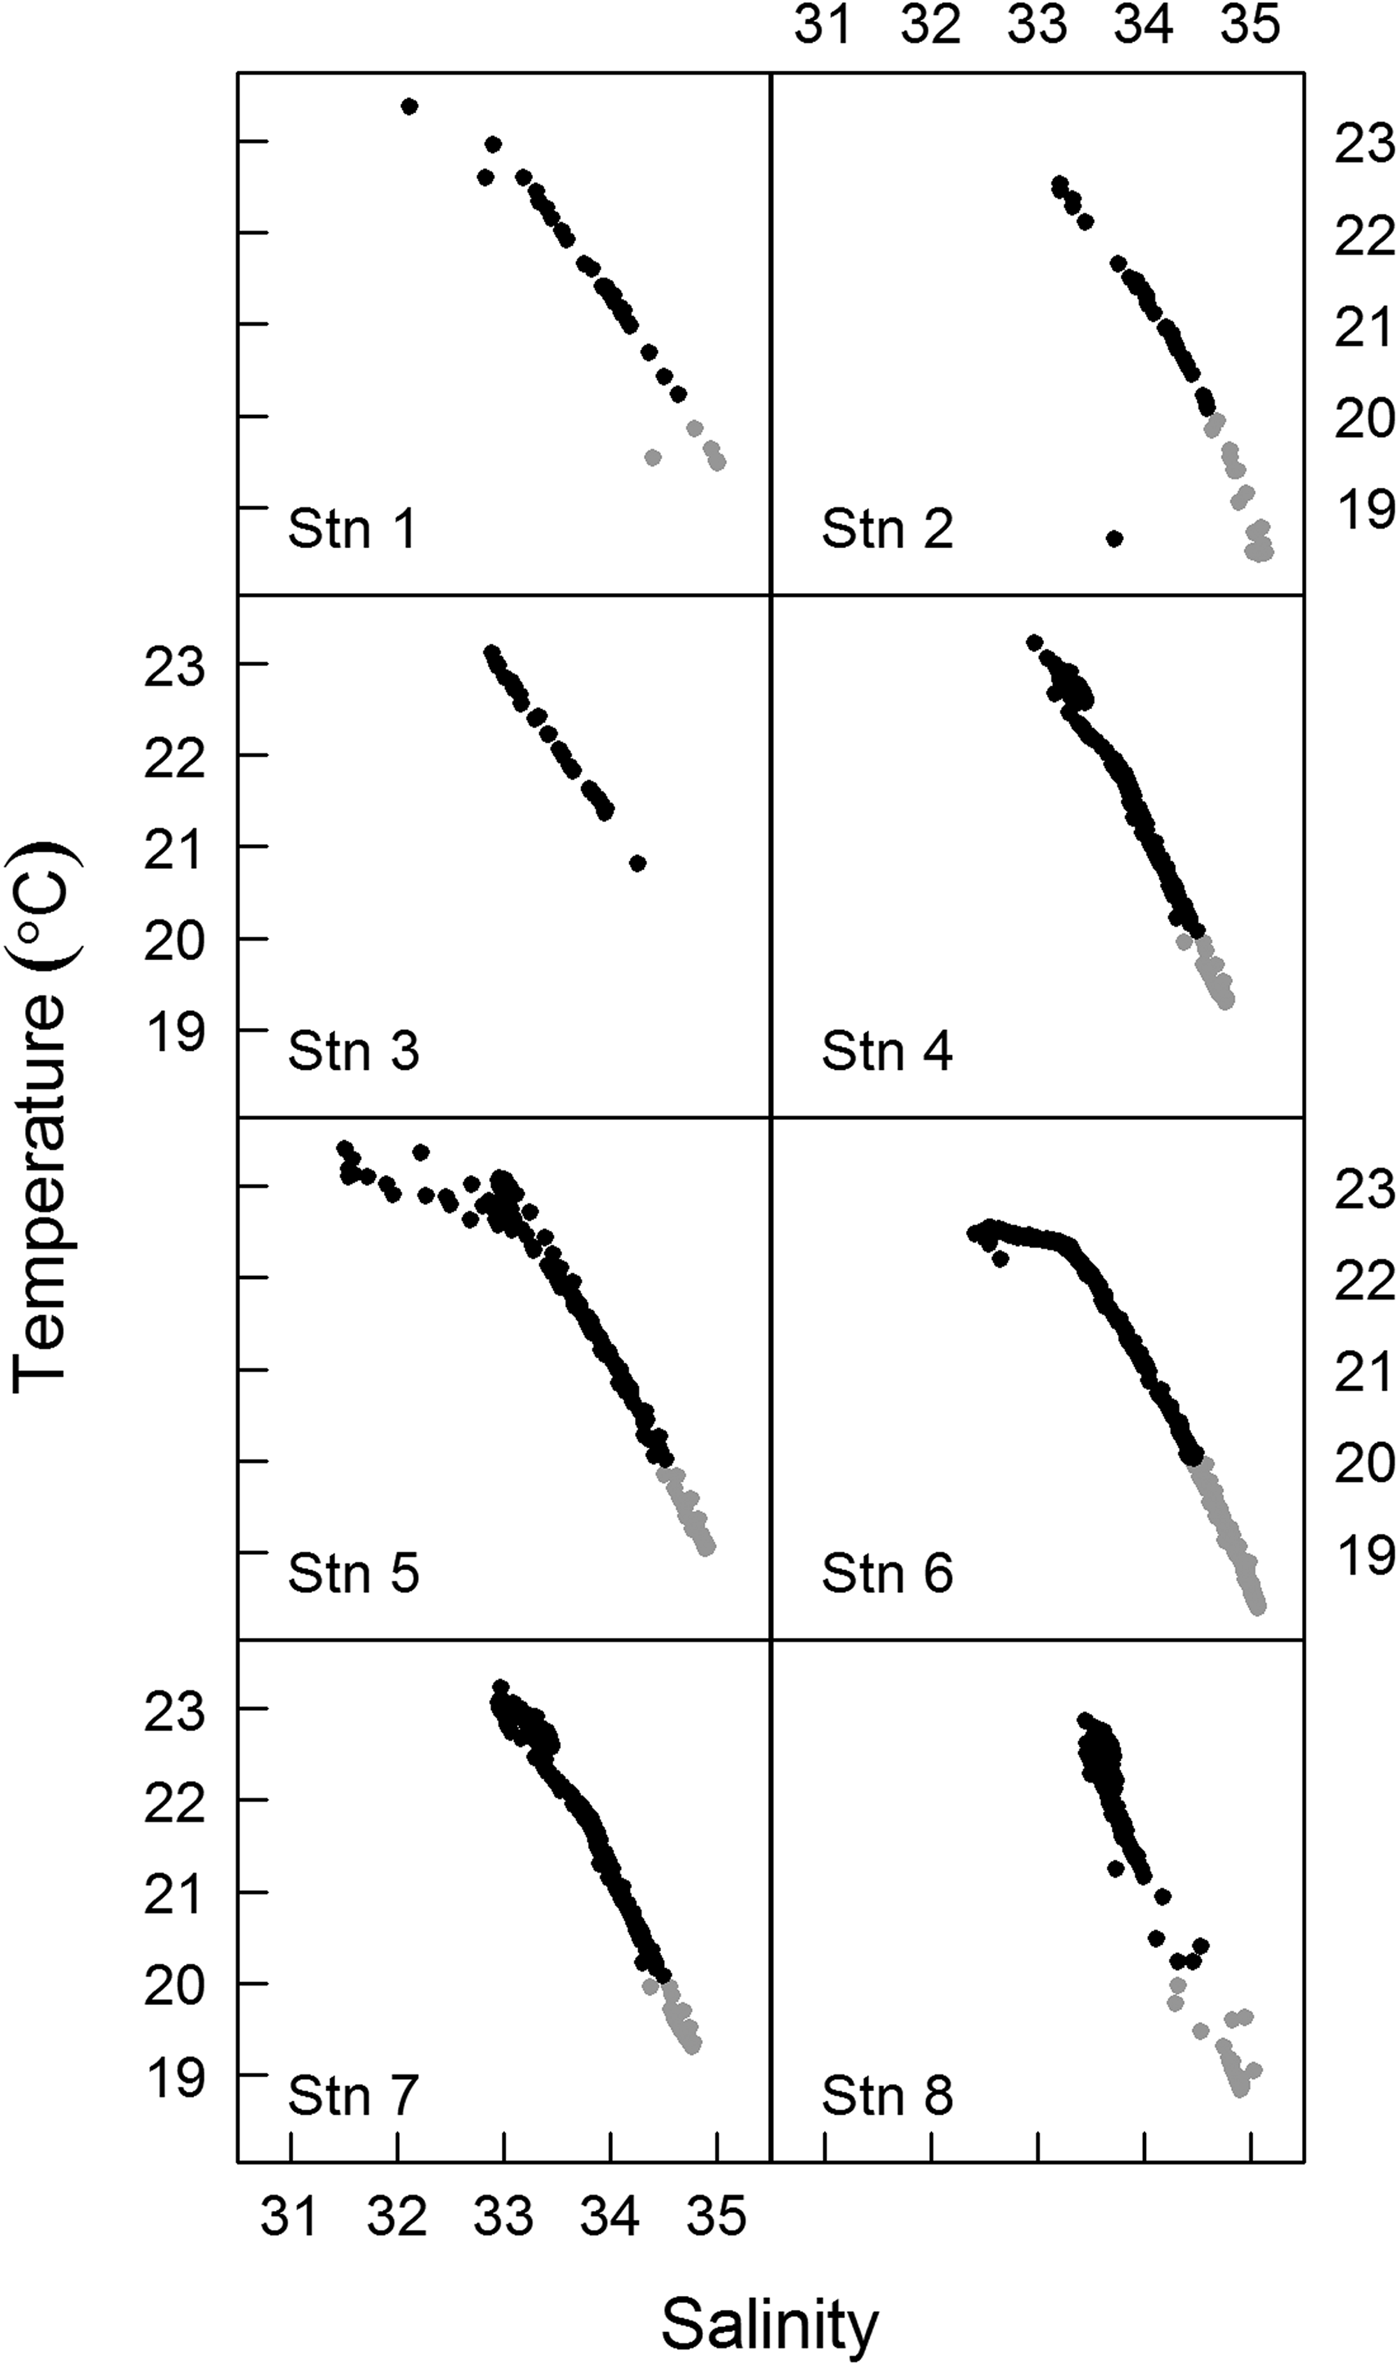
For each sampling time, the water column was characterized through a T–S (Temperature–Salinity) diagram using CTD data (Figure 2). The boundaries defining the water masses were determined according to the criteria suggested by Braga & Niencheski (Reference Braga, Niencheski, Rossi-Wongtschowski and Madureira2006) for Coastal Water (CW) and by Stramma & England (Reference Stramma and England1999) for South Atlantic Coastal Water (SACW). Analyses of inorganic nutrients were conducted after samples were thawed at room temperature via colorimetry, in accordance with the methodology described by Aminot & Chaussepied (Reference Aminot and Chaussepied1983). Chlorophyll-a concentration was determined according to the equations provided by Neveux & Lantoine (Reference Neveux and Lantoine1993) following chlorophyll-a extraction by centrifugation with acetone and measurement through a Varian Cary Eclipse® spectrofluorometer.
T–S diagrams for sampling stations. Grey dots indicate the SACW (South Atlantic Central Water) and black dots the CW (Coastal Water). Stn 1–1600 h, Stn 2–1900 h, Stn 3–2200 h, Stn 4–0100 h, Stn 5–0400 h, Stn 6–0700 h, Stn 7–1000 h, Stn 8–1300 h.
Plankton abundance and biomass
Picoplankton samples were immediately taken to the laboratory and filtered onto black Nucleopore polycarbonate filters (0.2 µm pore size), stained with DAPI, and stored in the dark at 4°C. At least 400 cells were counted in random fields of each slide under an epifluorescence microscope using UV light (Porter & Feig, Reference Porter and Feig1980). The number of heterotrophic cells was estimated based on the difference between the total number of cells and the number of autotrophic cells. For biomass determination, a total of 30 cells were measured under a microscope equipped with a digital camera and imaging software (AxioVision Rel. 4.7.2). Nano- and microplankton samples (5–10 ml), after being settled according to Utermöhl (Reference Utermöhl1958), were counted and identified to the species level (when possible). For nanoplankton samples, 30 random fields were observed at 400× magnification and at least 400 cells were counted; for microplankton samples, the whole chamber was analysed at 200–400× magnification and a minimum of 300 cells were counted. Both nano- and microplankton cells were classified as autotrophic or heterotrophic on the basis of species identification. The linear dimensions of 30 cells were measured for each taxonomic group that contributed at least 10% of the abundance of all the samples, as described above for picoplankton. Three aliquots (10 ml) of copepod samples were counted and identified to the lowest taxonomic level possible using a binocular microscope. Copepod nauplii and early copepodites stages were not identified to the species level. For each sampling time (N = 8), prossome length and width were measured for each 30 individuals of nauplii, copepodite and adult under a microscope equipped with a digital camera and imaging software.
The biomass in carbon of pico-, nano- and microplankton was estimated after determining the cell biovolume based on simple geometric forms and converting to carbon using carbon:volume equations from previous literature (Verity et al., Reference Verity, Robertson, Tronzo, Andrews, Nelson and Sieracki1992; Loferer-Krössbacher et al., Reference Loferer-Krössbacher, Klima and Psenner1998; Menden-Deuer & Lessard, Reference Menden-Deuer and Lessard2000). As a consequence of fixation, cell volume may either shrink or expand, depending on the species, but it is nonetheless unnecessary to use correction factors when estimating the biomass of samples containing many species (Menden-Deuer et al., Reference Menden-Deuer, Lessard and Satterberg2001). Copepod biomass was determined based on size-dry weight regression according to the literature (Durbin & Durbin, Reference Durbin and Durbin1978), and converting dry-weight to carbon using a 45% factor (Kiørboe et al., Reference Kiørboe, Møhlenberg and Riisgárd1985).
Size-specific ingestion
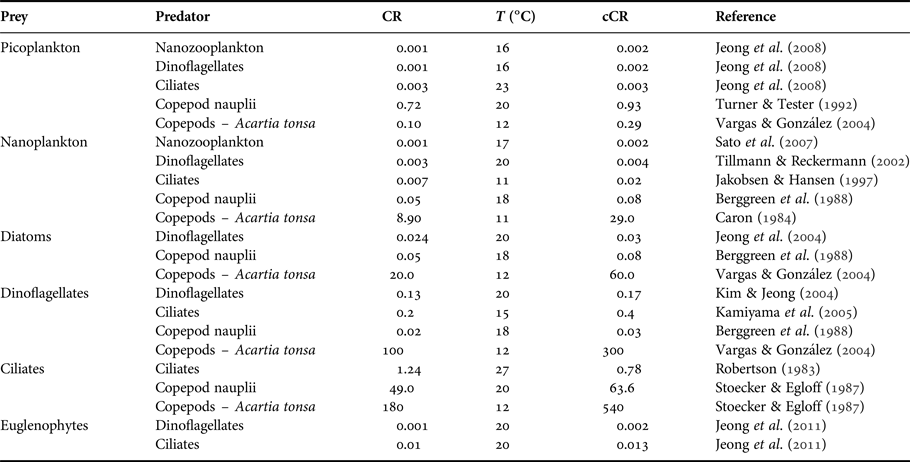
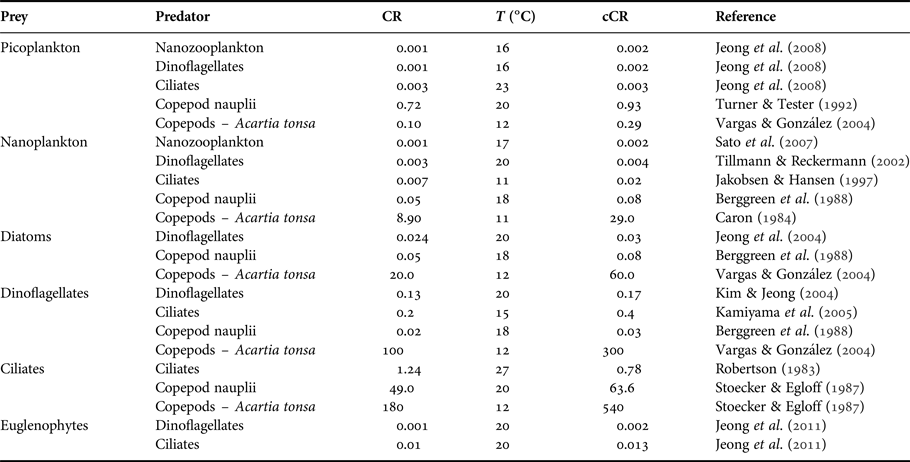
The potential ingestion of heterotrophic dinoflagellates, heterotrophic ciliates, copepod nauplii, copepodites and adult copepods was estimated. The description of trophic interactions took into account the minimum and the maximum prey size that can be accessible to the predator based on the findings of Hansen et al. (Reference Hansen, Bjørsen and Hansen1994) for ciliates, copepod nauplii, copepodites and adults and of Fuchs & Franks (Reference Fuchs and Franks2010) for dinoflagellates. Ultimately, we applied the ratios of predator: prey sizes from these works to our own measurements of size for each type of prey and predator considered in our food web analysis. These relationships were expressed in equivalent spherical diameters [ESD = (V/0.523)0.33], where V is the volume in μm3 and ESD is expressed in μm. Since plankton predators exhibit size selectivity, such that there is an optimum prey size at which their clearance rates are maximal (Hansen et al., Reference Hansen, Bjørsen and Hansen1994), we did not consider the whole prey size spectrum which would overestimate the potential ingestion. In contrast, we considered only the optimum prey size (optimal predator: prey size ratio – 1:1 for dinoflagellates, 8:1 for ciliates, and 18:1 for copepods) to estimate the potential ingestion rates by multiplying clearance rate by prey biomass. Clearance rates were selected from the literature taking into account specific predator-prey interaction, the already-known relationships (e.g. ciliates clearance rate is twice that of dinoflagellates (Hansen et al., Reference Hansen, Koefoed and Hansen1997)), multi-prey experiments, and experiments considering the range of prey density/biomass that occurred in Guanabara Bay (Table 1). Whenever possible, for copepods we used the clearance rates determined for the dominant species (Acartia tonsa) from experiments conducted with both female and male copepods (Table 1). Clearance rates were corrected for the mean local temperature observed during Lagrangian sampling (22.5°C) by applying a Q 10 value of 2.8 (Hansen et al., Reference Hansen, Koefoed and Hansen1997).
Clearance rate (CR, ml d−1) and temperature (T, °C) (laboratory or in situ experiments) used to estimate the potential ingestion during the Lagrangian sampling. Clearance rates were corrected for 22.5°C (cCR, ml d−1) using a Q 10 = 2.8.
Statistical analysis
Because the data showed no homogeneity of variance (Bartlett's test, P < 0.0001), Wilcoxon non-parametric tests were used to conduct pairwise comparisons of the densities and biomass of nauplii, copepodites and adults. Standard error (±SE) was used as a measure of dispersion for all analyses. Total potential ingestion was compared among predators (dinoflagellates, ciliates, copepods nauplii and copepods) using paired t-tests. Statistical analyses and preparation of figures were carried out using R software (version 3.0.3 for Windows; R Core Team, 2016).
RESULTS
Lagrangian, hydrographic and chemical characterizations
The drifting buoy remained in the estuary throughout the diel cycle, with a total displacement of 18.3 km. The buoy displacement was enhanced by the spring tide, which had an amplitude of ~1.2 m. Buoy displacement was larger during ebb tides (stations 1–2 and 4–7; see Figure 1) than during flood tides (stations 2–4 and 7–8; see Figure 1). Moderate to weak southerly winds prevailed during the sampling period, except at the last sampling site (station 8, 1300 h), where strong winds were observed. Over the diel cycle, the temperature and salinity of the surface water presented small variations (~0.6°C and ~1, respectively). The T–S diagrams showed strong stratification, but without significant changes at the surface during the drift path (Figure 2). It was possible to identify the Coastal Water (CW) at the surface and the South Atlantic Coastal Water (SACW) near the bottom. Station 3 (2200 h) was the only site at which the influence of SACW was not detected (Figure 2). Mean nutrient concentrations (μM) in the surface water over the day (N = 8) were: ammonium 20.7 (±2.8); nitrite 5.1 (±0.4); nitrate 3.9 (±0.3); phosphate 2 (±0.5); and silicate 2.9 (±0.3). Chlorophyll-a ranged from 18 µg l−1 (station 5, 0400 h) to 30 µg l−1 (station 7, 1000 h) and remained constant over the course of sampling at stations 1 to 4 (1600–0100 h; ~ 22.5 µg l−1).
Species composition, abundance and biomass
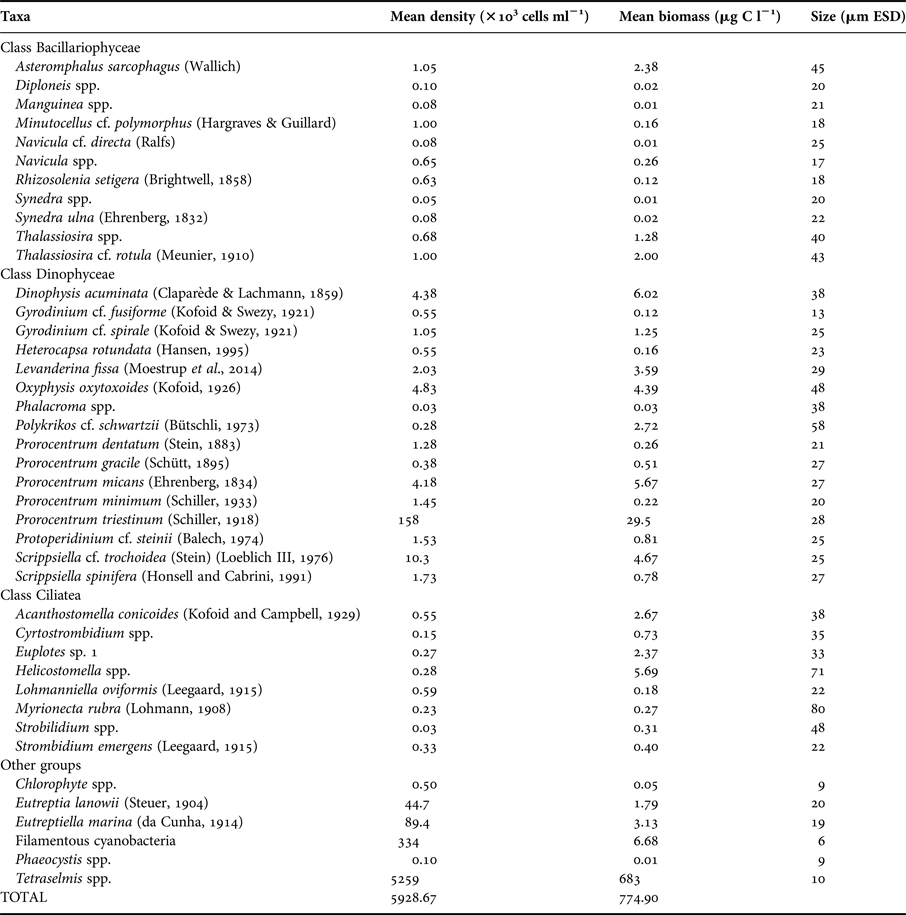
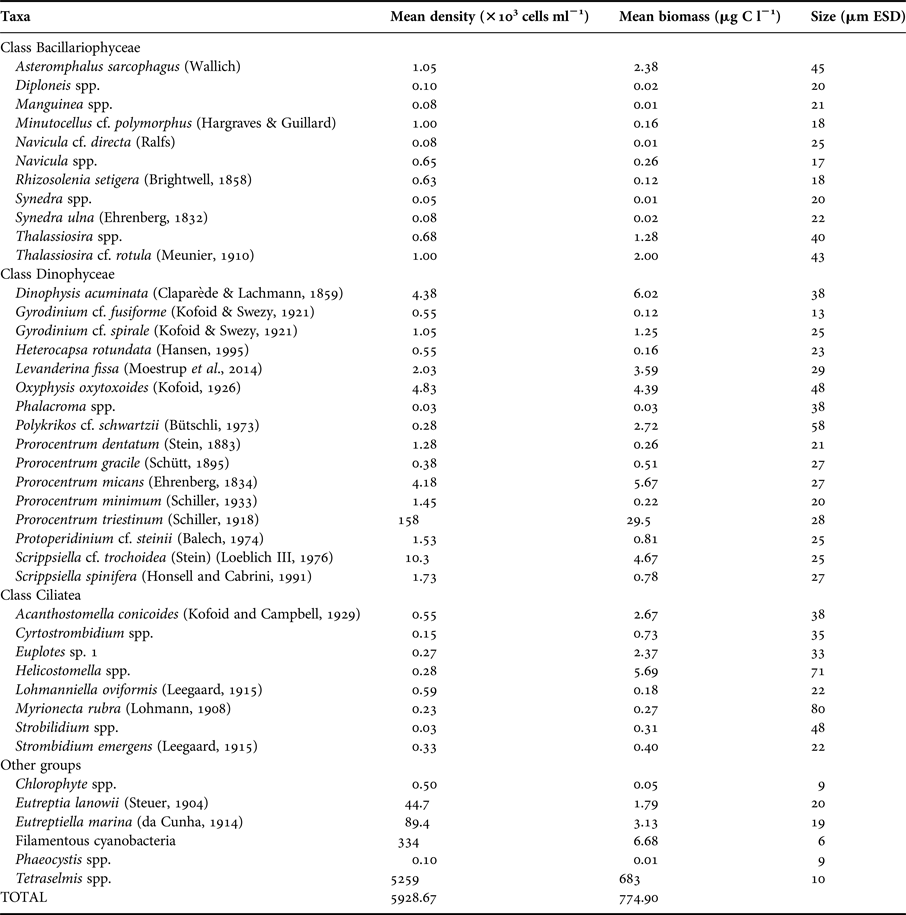
Picoplankton was composed of bacteria and cyanobacteria. The most abundant species that composed nano- and microphytoplankton were Tetraselmis spp. and the dinoflagellate Prorocentrum triestinum (Schiller, 1918), respectively (Table 2). Nano- and microprotozooplankton were dominated by oligotrich ciliates and dinoflagellates; Levanderina fissa (Moestrup et al., 2014) was the most abundant heterotrophic dinoflagellate (Table 2).
Nano- and microplankton species identification, mean density and biomass estimates and size in ESD.
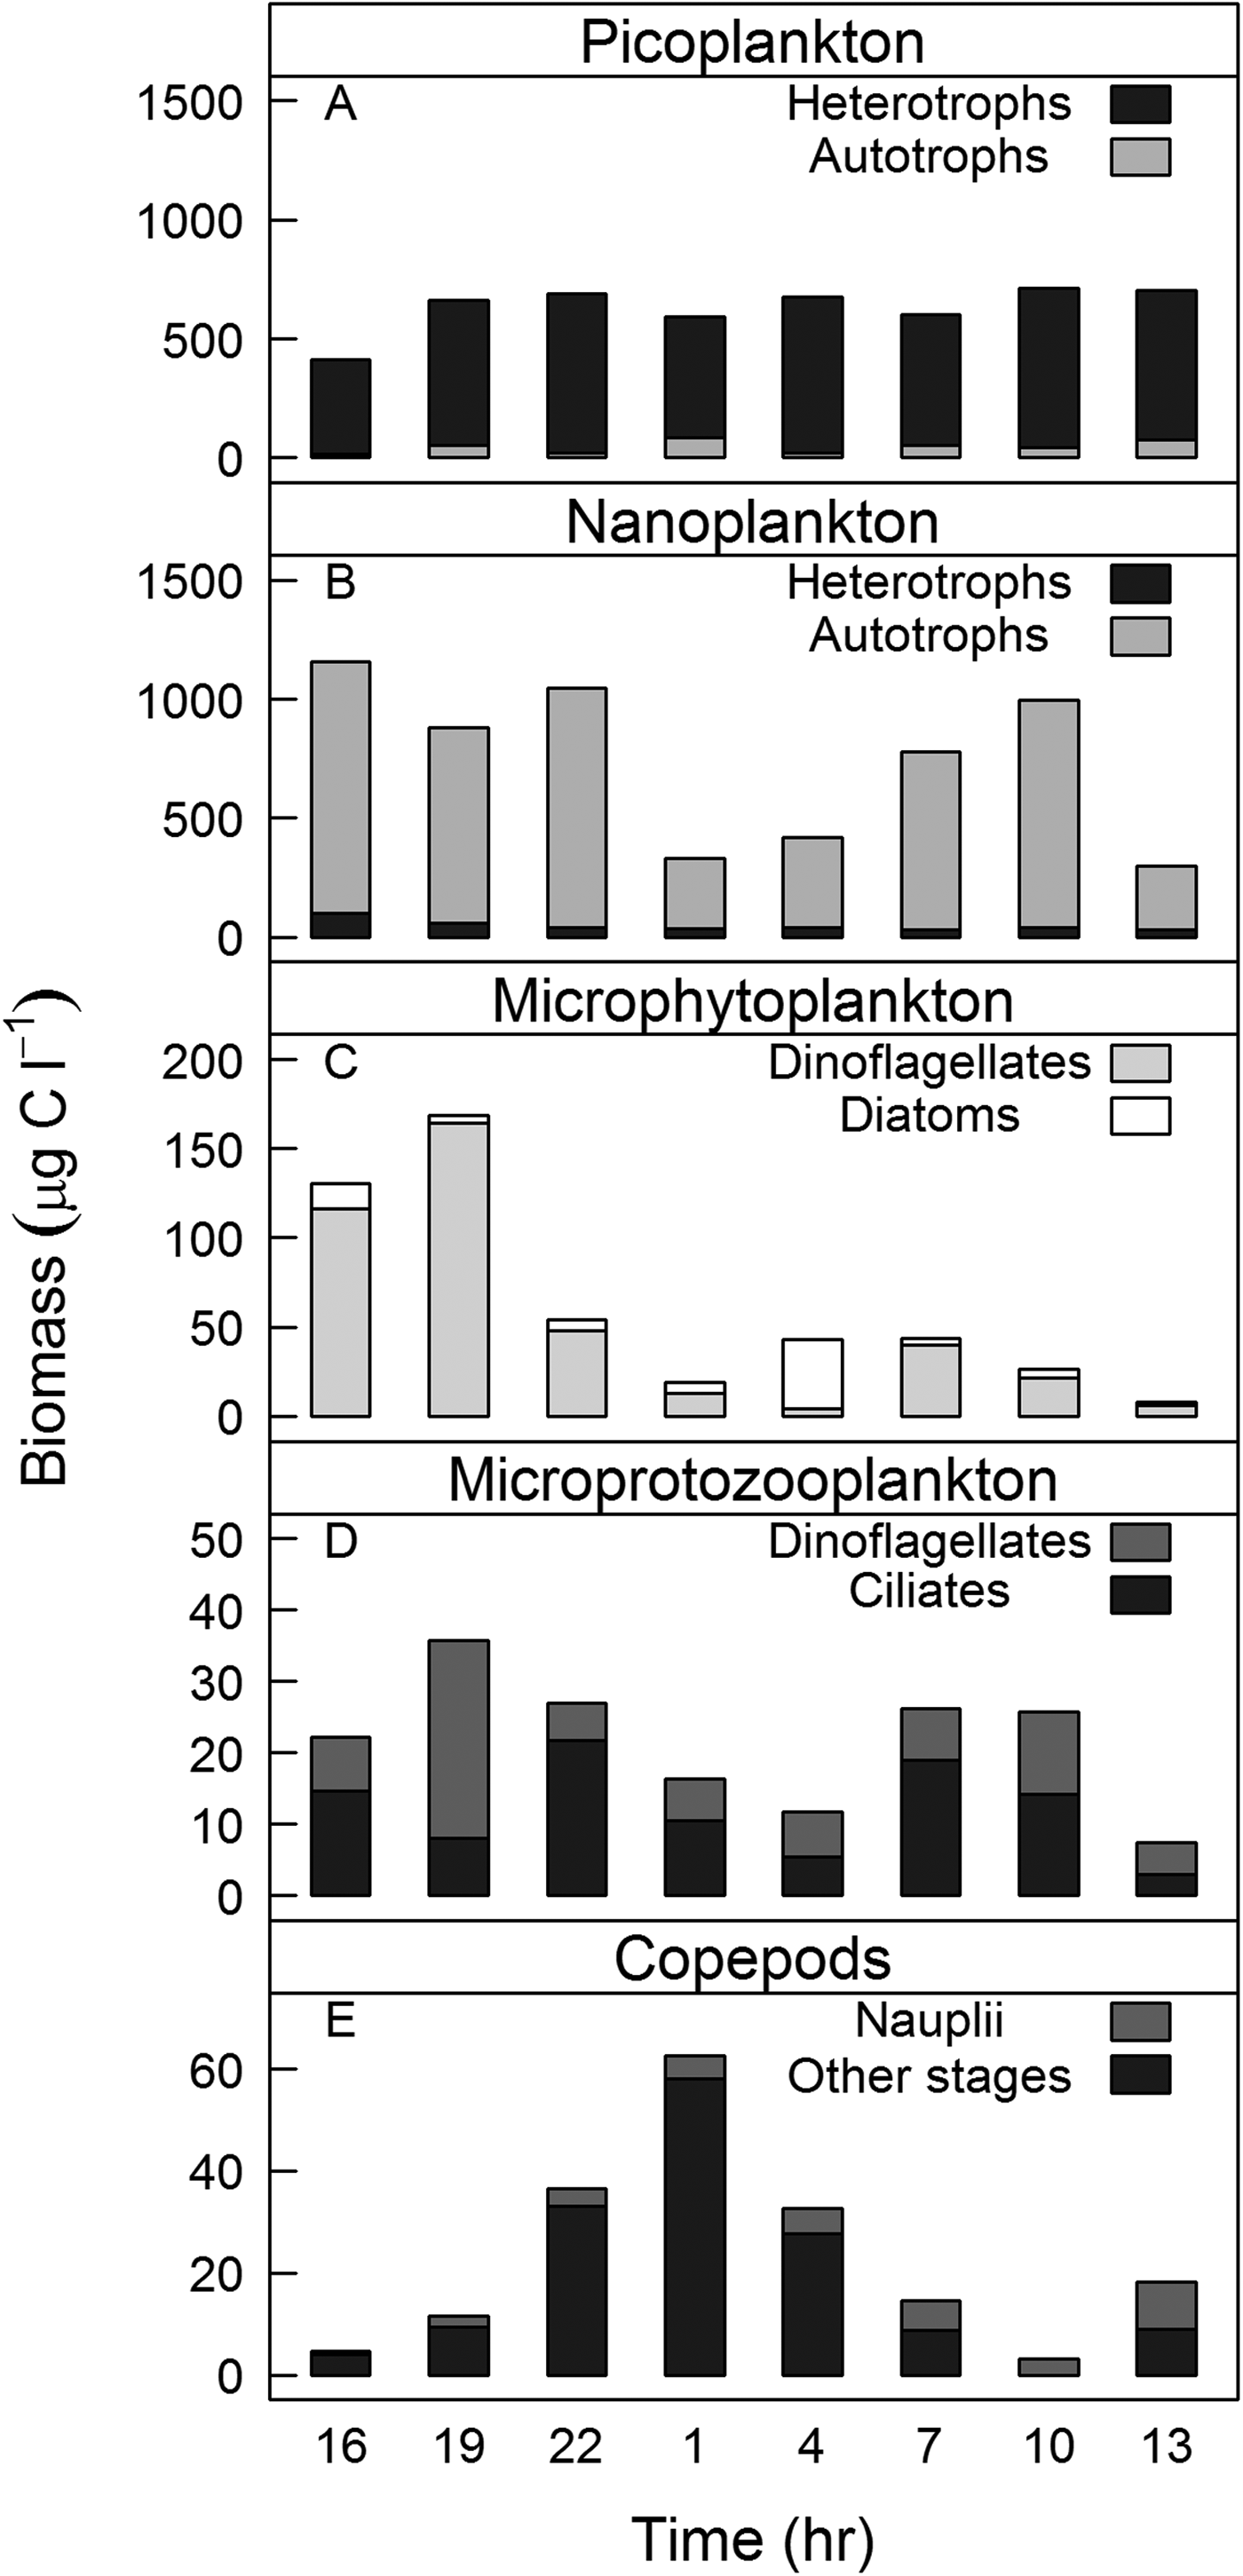
Picoplankton abundance and biomass remained constant over the course of sampling (4.9 × 10⁹ ± 2.8 × 10⁸ cells l−1/590 ± 34 µg C l−1, N = 8, respectively). Heterotrophic picoplankton contributed more than 90% of the total picoplankton biomass (Figure 3A). The opposite was observed for nanoplankton (abundance: 5.6 × 10⁶ ± 2.8 × 10³ cells l−1/biomass: 690 ± 116 µg C l−1, N = 8), where autotrophic cells dominated the biomass (Figure 3B). The microphytoplankton mean density and biomass during sampling (3.5 × 10⁵ ± 9 × 10⁴ cells l−1 and 67 ± 19 µg C l−1, N = 8, respectively) were higher than those of microprotozooplankton (abundance: 7 × 10³ ± 1 × 10³ cells l−1/biomass: 21 ± 3 µg C l−1, N = 8; Figure 3C, D). Nano- and microplankton biomass varied in time with minimum values during the night and at station 8 (Figure 3B–D). The contribution of nanophytoplankton to the total phytoplankton biomass was an order of magnitude greater than that of microphytoplankton (Figure 3B, C). The opposite was observed for protozooplankton biomass: the contribution of microprotozooplankton was two-fold higher than that of nanoprotozooplankton (Figure 3B, D).
Plankton biomass (μgC l−1) at surface over the sampling period for: (A) picoplankton; (B) nanoplankton; (C) microphytoplankton; (D) microprotozooplankton; and (E) copepods. Note that the scales are different.

Acartia tonsa (Dana, 1849) and Paracalanus spp. dominated copepod composition, contributing 62–97% of total copepod density. Mean copepod density and biomass were 56 ± 9 ind l−1 and 23 ± 7 µg C l−1, respectively (N = 8). When comparing the densities of copepods nauplii, copepodites and adults in each sampling time, we found that the nauplii density was significantly higher than the densities of copepodites (Wilcoxon signed-ranks test, T = 33, N = 3, P = 0.04) and adults (Wilcoxon signed-ranks test, T = 36, N = 3, P = 0.008). Copepodite biomass was higher than those of nauplii (Wilcoxon signed-ranks test, T = 8, N = 3, P = 0.004) and adults (Wilcoxon signed-ranks test, T = 6, N = 3, P = 0.01), particularly copepodites in the size range 400–600 µm. Copepod biomass varied significantly over the course of sampling (Wilcoxon signed-ranks test, T = 4, N = 8, P = 0.0001) and was highest during the night (stations 3, 4 and 5; 2200–0400 h). Changes in copepod biomass over the sampling period (Figure 3E) showed an opposite pattern to those of nano- and microplankton biomass (Figure 3B–E).
Predator-prey interactions based on size
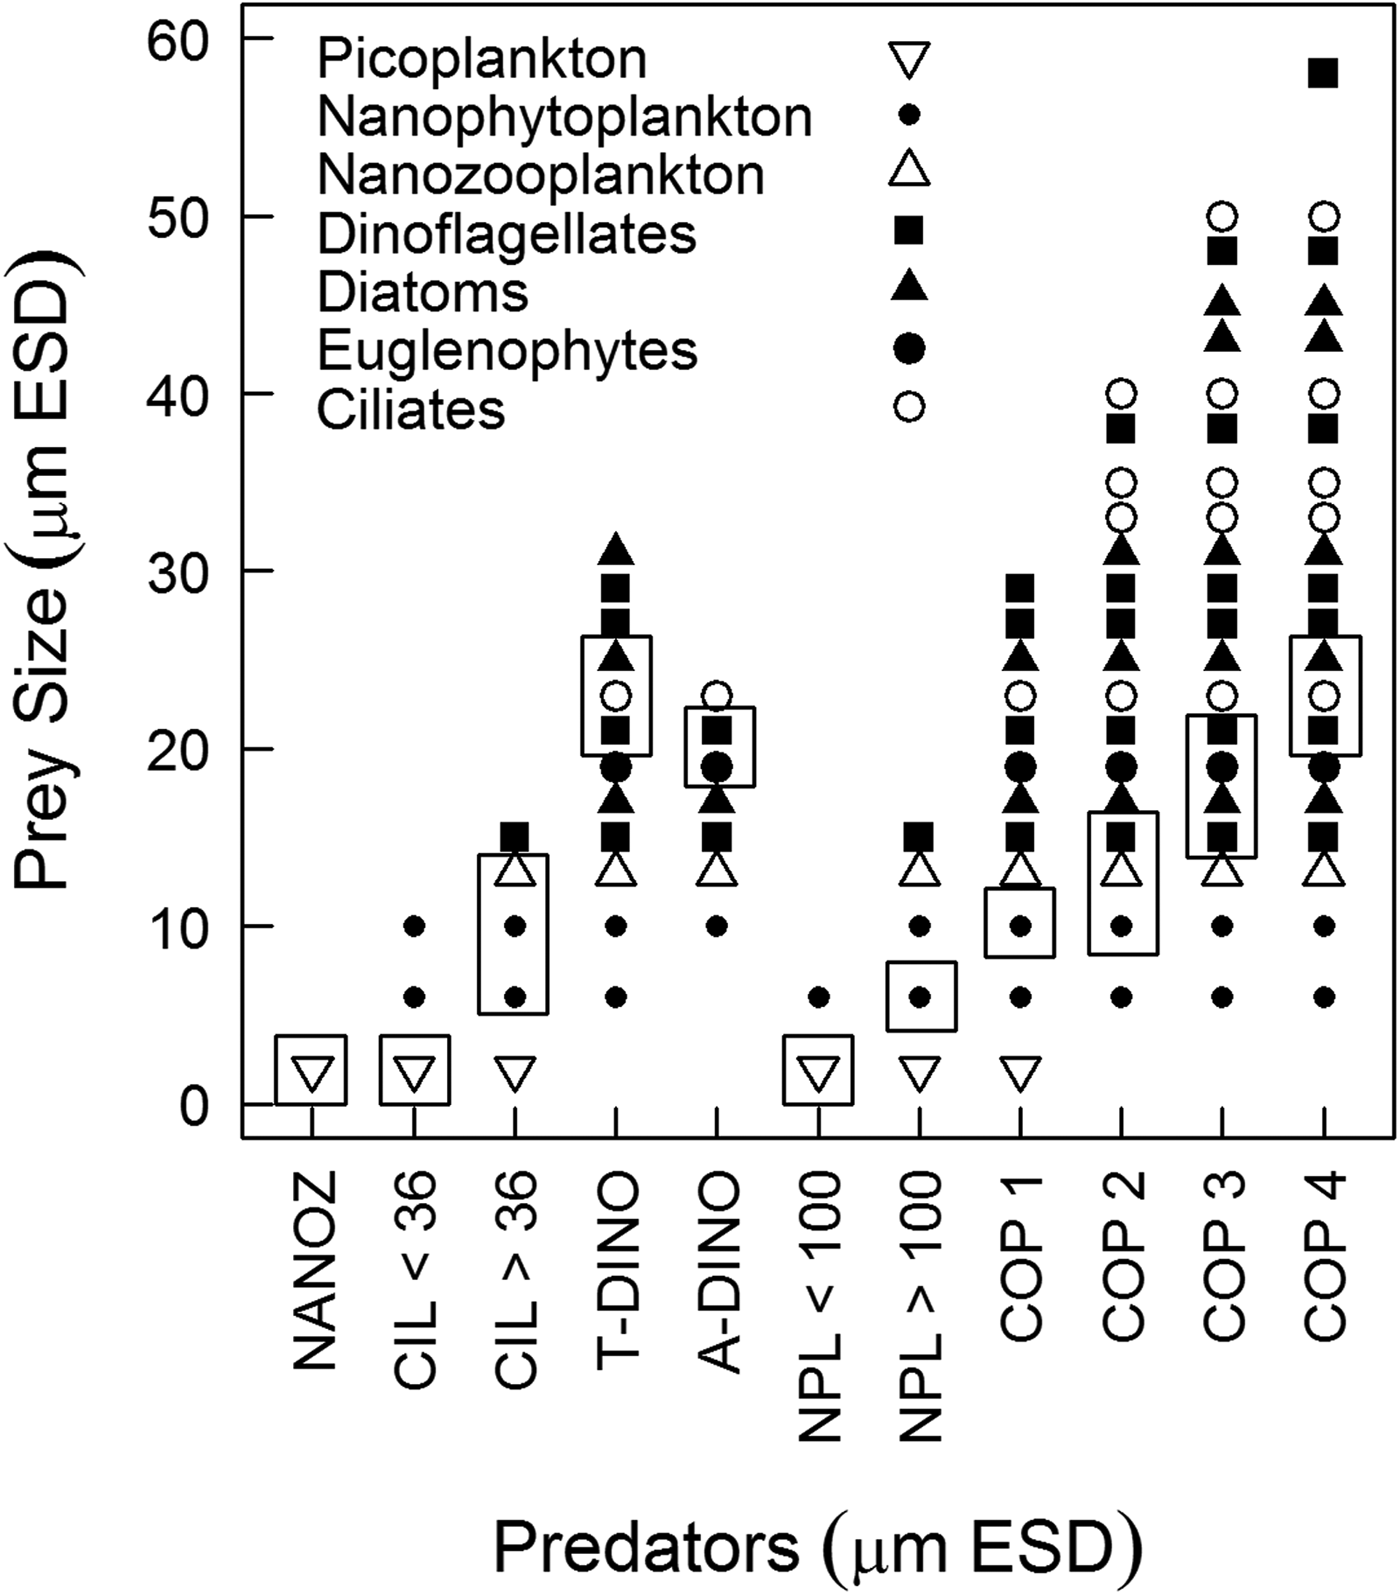
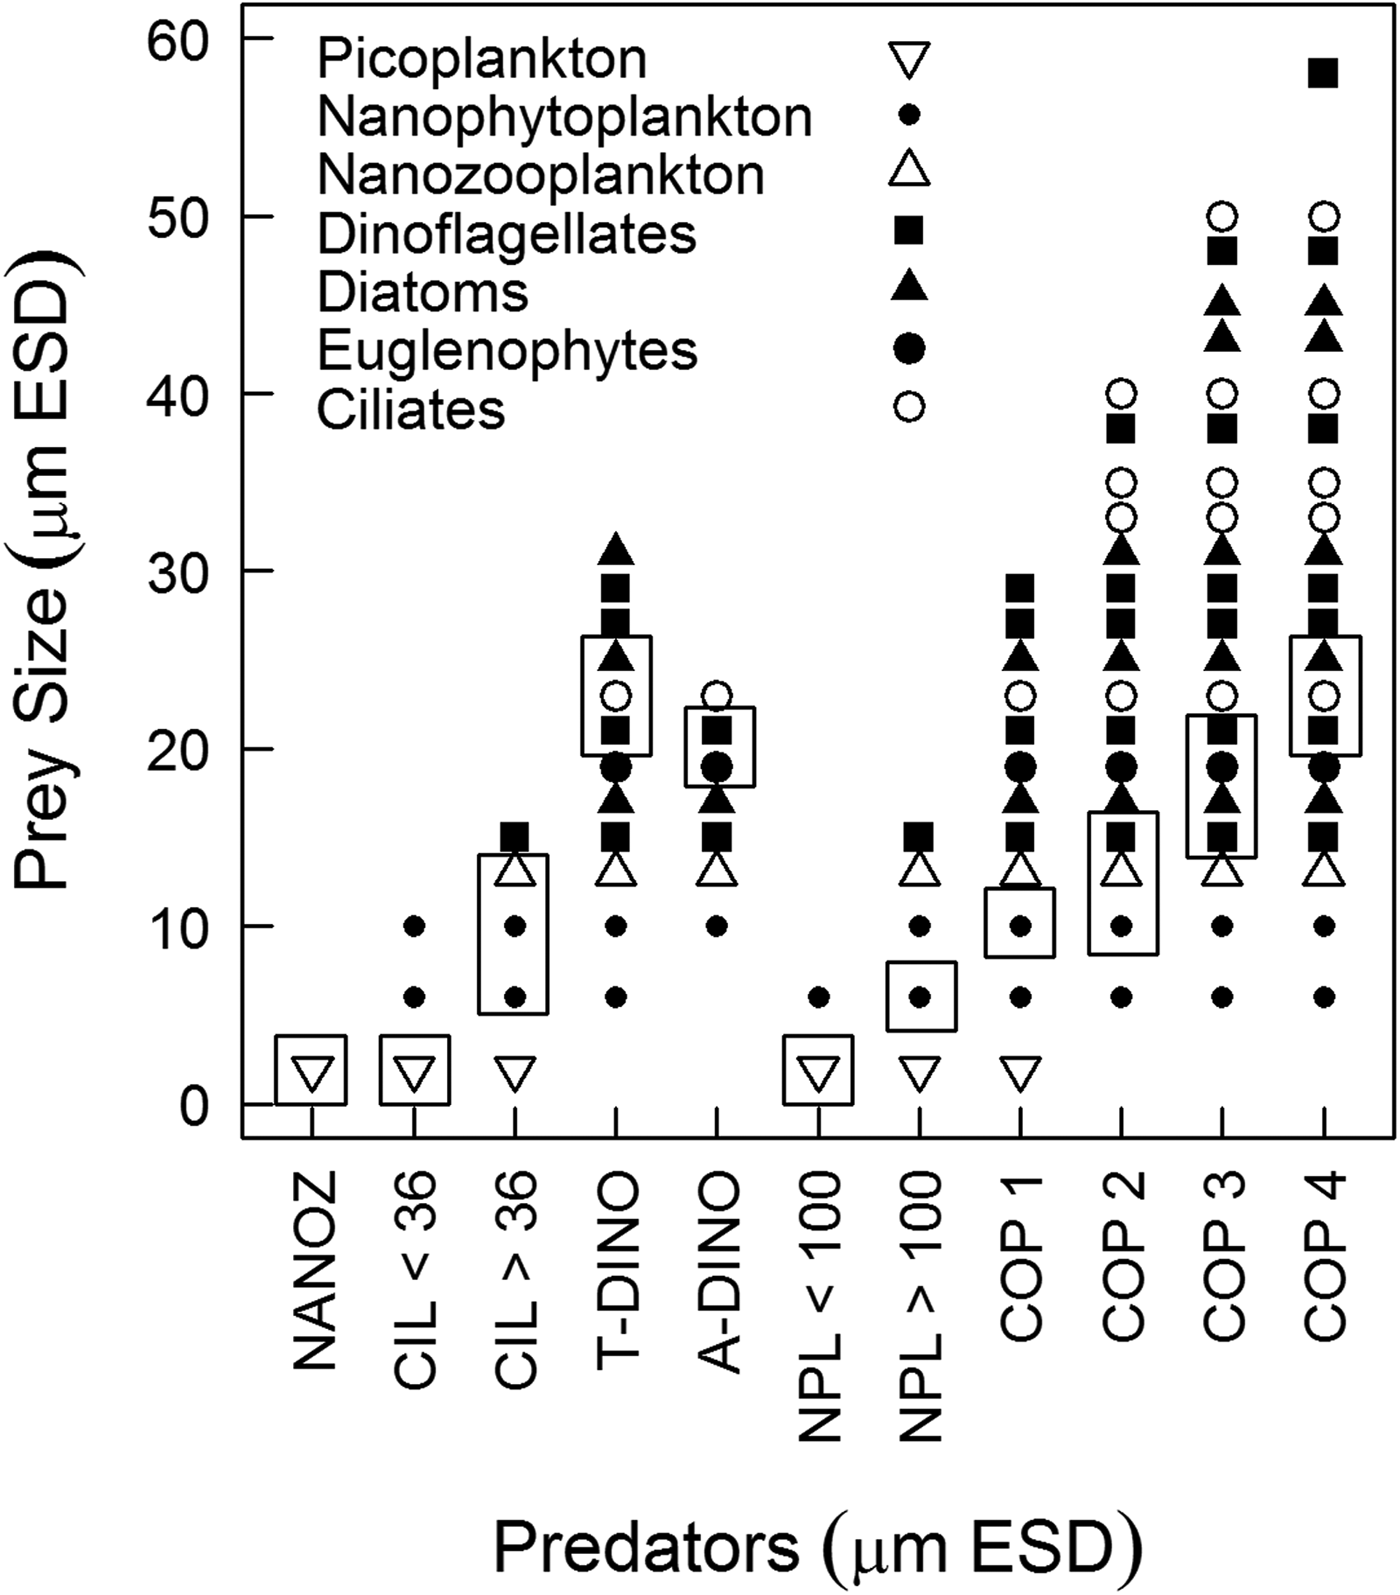
Predator-prey interactions were assessed based on the optimum prey size spectrum accessible for each predator (Figure 4). Nanoprotozooplankton could access only picoplankton, while the prey for ciliates ranged from picoplankton up to dinoflagellates 15 µm ESD; however, according to the optimum prey size, ciliates < and >36 µm ESD could access only picoplankton and nanoplankton, respectively. Heterotrophic dinoflagellates could access diatoms, ciliates, euglenophytes and dinoflagellates, although picoplankton was out of their prey size spectrum. Copepod nauplii could access only picoplankton and autotrophic nanoplankton (Figure 4). Copepodites and adult copepods exhibited a broader size spectrum of prey, but only copepods <300 µm ESD could ingest nanoplankton; the optimum prey size of larger copepods would not include such small prey (Figure 4).
Maximum prey size spectrum for each predator by prey type. Rectangles highlight the window of optimum prey size used to estimate potential predation. The size relationships were derived from predator: prey size ratios from the literature (Hansen et al., Reference Hansen, Bjørsen and Hansen1994; Fuchs & Franks, Reference Fuchs and Franks2010) applied to our own measurements of size for each type of prey and predator considered in our food web analysis. NANOZ – nanozooplankton, CIL < 36–ciliates <36 µm ESD, CIL > 36–ciliates >36 µm ESD, ADINO – athecate dinoflagellates, TDINO – thecate dinoflagellates, NPL < 100 – copepod nauplii <100 µm ESD, NPL > 100 – copepod nauplii >100 µm ESD, copepods – COP 1 (<220 µm ESD), COP2 (220–300 µm ESD), COP3 (300–370 µm ESD), COP4 (370–450 µm ESD).
Size-specific ingestion
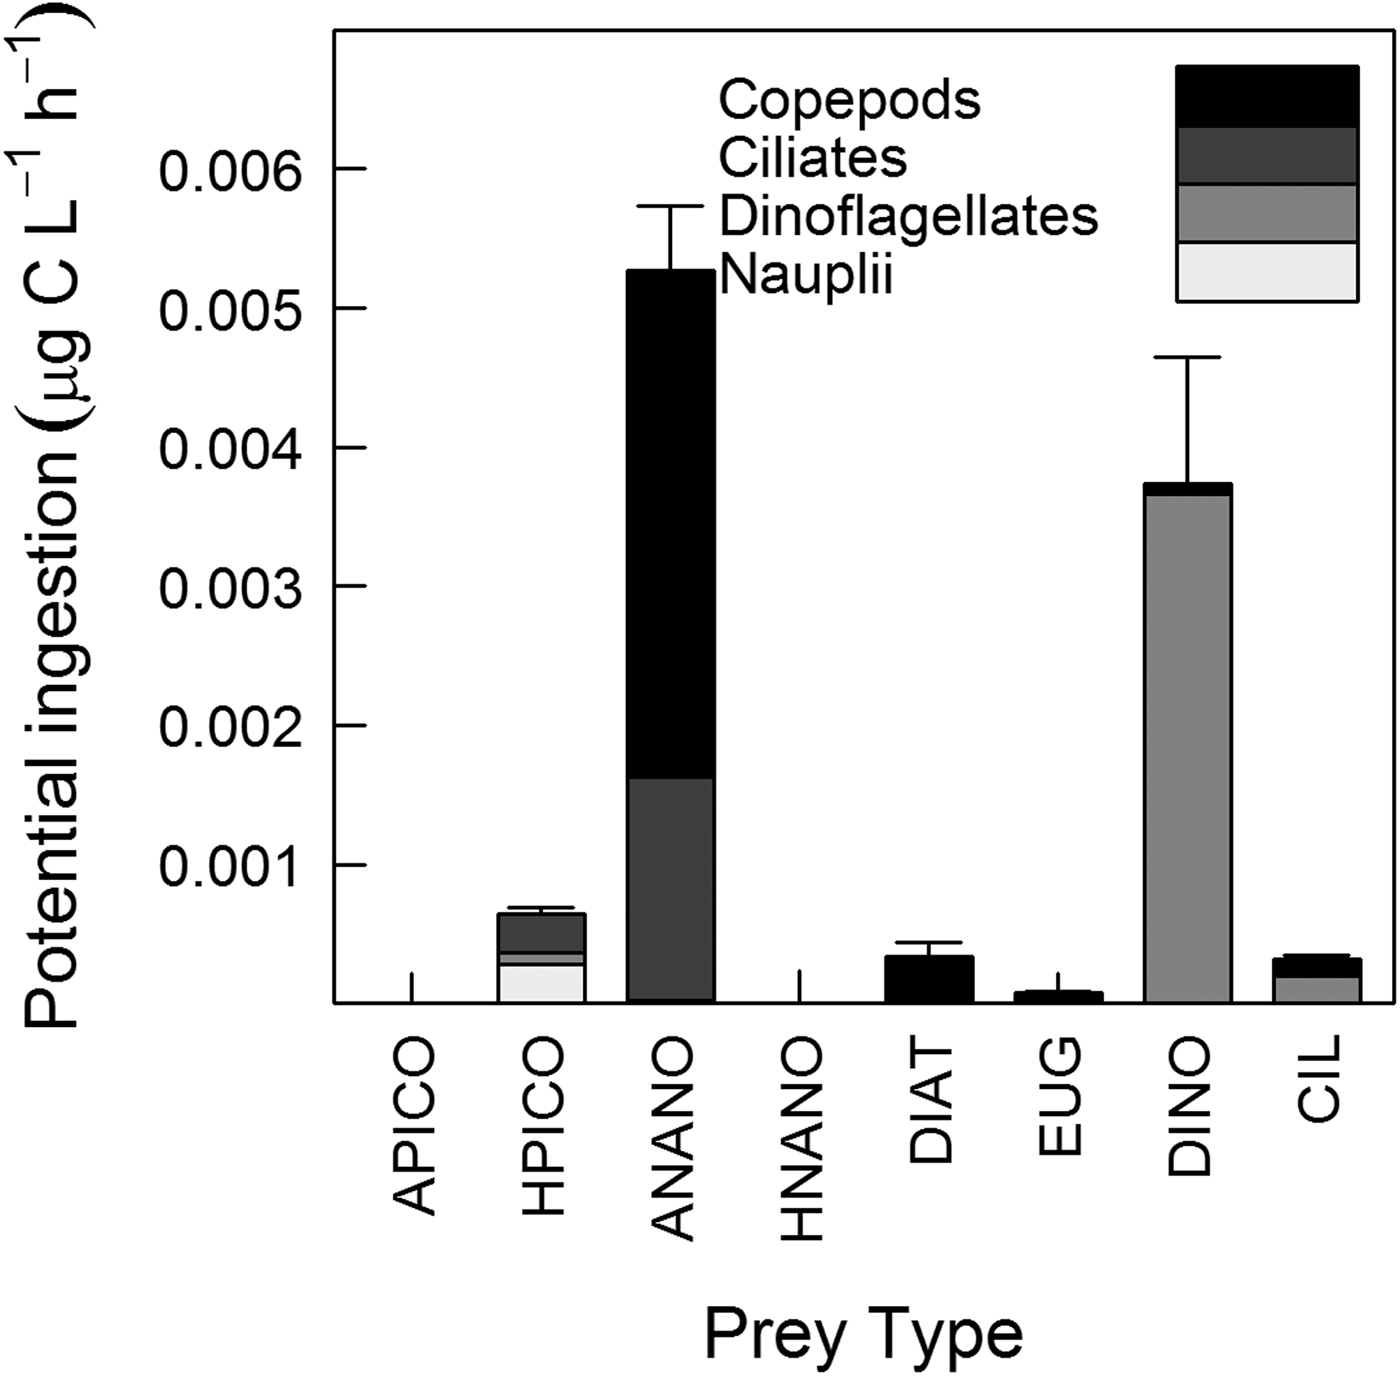
Daily mean (N = 8) of total potential ingestion (dinoflagellates + ciliates + nauplii + copepods) was 0.01 ± 0.003 µg C l−1 h−1 (Figure 5). There was no significant difference in potential ingestion of phytoplankton and bacteria between copepods and total microzooplankton (dinoflagellates + ciliates + nauplii) (paired t-test, t8 = 0.37, P = 0.7). Comparing copepod ingestion with each microzooplankton group separately, showed that copepods had higher potential ingestion of phytoplankton than ciliates (paired t-test, t8 = 2.63, P = 0.03) and nauplii (paired t-test, t8 = 4.68, P = 0.0008), but there was no significant difference between copepods and dinoflagellates. The potential ingestion by ciliates was not significantly different from that of dinoflagellates, but was higher than that of copepod nauplii (paired t-test, t8 = 2.58, P = 0.04). Potential ingestion did not differ between dinoflagellates and copepod nauplii.
Mean potential ingestion (μgC l−1 h−1) of copepod nauplii, dinoflagellates, ciliates and copepods. Prey type: A-PICO – autotrophic picoplankton, H-PICO – heterotrophic picoplankton, A-NANO – autotrophic nanoplankton, H-NANO – heterotrophic nanoplankton, DIAT – diatoms, EUG – euglenophytes, DINO – dinoflagellates, CIL – ciliates. Bars correspond to the standard error of the mean of total potential ingestion (N = 8).

For all predators, potential ingestion of autotrophic prey (mainly nanophytoplankton and autotrophic dinoflagellates) was higher than ingestion of heterotrophic prey (paired t-test, t8 = 3.18, P = 0.01). Copepod potential ingestion of nanophytoplankton was higher than ingestion of microphytoplankton prey (Paired t-test, t8 = 4.07, P = 0.005), while potential ingestion by microzooplankton was high for both types of prey. Heterotrophic picoplankton was ingested primarily by copepod nauplii and ciliates, while autotrophic nanoplankton was ingested primarily by copepods (size range 400–600 µm) and ciliates (<50 µm). Larger prey, such as diatoms and euglenophytes, were ingested primarily by copepods larger than 600 µm, while dinoflagellates were most often ingested by heterotrophic dinoflagellates. The potential ingestion of ciliates by copepods and dinoflagellates was similarly high (Figure 5).
DISCUSSION
Lagrangian, hydrographic and chemical interpretation
The 1-day Lagrangian sampling enabled us to track the same water parcel on the surface over the diel cycle as shown by physico-chemical properties which remained constant through time (22.5 ± 0.6°C). In addition, the T–S profiles showed traits of the water masses within the water column (CW in the surface and SACW near the bottom) at all samples, except for station 3 (2200 h), where SACW was not detected (Figure 2). This was probably related to the action of internal tides, i.e. internal gravity waves generated mainly by the interaction between tides and topography that propagate through isopycnals (Muir, Reference Muir, El-Shaarawi and Esterby1982). The slack ebb tide observed at station 3 probably corresponded to a local internal trough, which likely brought SACW very close to the bottom, to a point where the CTD sensor is not able to read and register values. Although SACW was not registered during this sampling, the surface water parcel did not show physical and chemical variations compared with the other samples. Since the water column was stratified during our sampling, our results were not representative of the entire water column.
As physico-chemical properties remained constant through time, the biomass variation in different planktonic groups over time was most likely the result of growth and predation rather than physical processes (e.g. mixing). Although Lagrangian sampling enabled us to follow the plankton community over time while minimizing the effect of advection, we must still discuss the possible effects of diffusion. Diffusion seems to have a smaller influence than advection in the ocean (Olbers et al., Reference Olbers, Willebrand and Carsten2012). Indeed, it has been demonstrated that in stratified waters, such as in Guanabara Bay, transport must occur along rather than across the different density surfaces, supporting the idea that diffusion in dynamic models of the thermocline may be ignored (Ledwell et al., Reference Ledwell, Watson and Law1993). Thus, we assumed that diffusion was of minor importance in our study and did not influence our results.
The occurrence of SACW in Guanabara Bay is common in austral spring (Kjerfve et al., Reference Kjerfve, Ribeiro, Dias, Filippo and Quaresma1997) but was also previously detected in other periods of the year (Fistarol et al., Reference Fistarol, Coutinho, Moreira, Venas, Cánovas, de Paula, Coutinho, de Moura, Valentin, Tenenbaum, Paranhos, Valle, Vicente, Filho, Pereira, Kruger, Rezende, Thompson, Salomon and Thompson2015) and represents an important physico-chemical influence because it brings cold and nitrate-rich water. During our sampling, the nitrate concentration at the surface (3.9 ± 0.3 µM, N = 8) was higher than previously observed in the absence of SACW (0.07 to 2.35 µM), while the ammonium concentration was similar to those previously reported for the bay (Santos et al., Reference Santos, Villac, Tenenbaum and Paranhos2007) and for other eutrophic estuaries (Gifford, Reference Gifford1988; McManus & Ederington-Cantrell, Reference McManus and Ederington-Cantrell1992). This suggests that, days prior to our sampling, some mixing occurred between Guanabara Bay waters and SACW near the surface. From data observations and numerical modelling, internal tides have been identified in the Guanabara Bay with isopycnal displacement up to 15 m, sometimes capable of outcropping SACW, which might explain the elevated nitrate concentration observed near the surface (A. Fernandes, Rio de Janeiro, personal communication).
Species composition, abundance and biomass
Pico- and nanoplankton densities were high (106 and 109 cells l−1, respectively), as previously observed for Guanabara Bay (Gomes et al., Reference Gomes, Santos, Tenenbaum and Villac2007; Santos et al., Reference Santos, Villac, Tenenbaum and Paranhos2007; Guenther et al., Reference Guenther, Lima, Mugrabe, Tenenbaum, Gonzalez-Rodriguez and Valentin2012) and other estuaries (Murrel & Hollibaugh, Reference Murrel and Hollibaugh1998; Froneman, Reference Froneman2002). The heterotrophic picoplankton dominated over autotrophic picoplankton mainly due to the elevated concentration of dissolved and particulate organic material associated with sewage discharge into Guanabara Bay, which favours heterotrophic metabolism. The biomass of autotrophic nanoflagellates (8–15 µm size) contributed more to the total phytoplankton biomass than either pico- and microphytoplankton; these results matched the findings of Guenther et al. (Reference Guenther, Lima, Mugrabe, Tenenbaum, Gonzalez-Rodriguez and Valentin2012), which also detected the influence of SACW in Guanabara Bay. The density of microplankton was in accordance with the documented range (103–104 cells l−1) for eutrophic estuaries, with dinoflagellates ~30 µm in size highly contributing to microphytoplankton density and biomass (Gomes et al., Reference Gomes, Santos, Tenenbaum and Villac2007; Chen et al., Reference Chen, Liu, Landry, Chen, Sun, Shek, Chen and Harrison2009). Over the sampling period, diatoms were less abundant due to silicate limitation in the Bay (N: Si: P = 17: 2: 1). Ciliates were dominated by cells 40–60 µm in size, with a density of ~103 cells l−1; our findings contrast with those of other studies, which report smaller cells and higher abundance for ciliates from Guanabara Bay (Guenther et al., Reference Guenther, Lima, Mugrabe, Tenenbaum, Gonzalez-Rodriguez and Valentin2012) and other eutrophic estuaries (Iriarte et al., Reference Iriarte, Madariaga, Revilla and Sarobe2003; Chen et al., Reference Chen, Liu, Landry, Chen, Sun, Shek, Chen and Harrison2009). In accordance with the findings of other studies in Guanabara Bay (Schwamborn et al., Reference Schwamborn, Bonecker, Galvão, Silva and Neumann-Leitão2004; Guenther et al., Reference Guenther, Lima, Mugrabe, Tenenbaum, Gonzalez-Rodriguez and Valentin2012), copepod density was 7–90 ind l−1, and Acartia tonsa and Paracalanus spp. were the dominant taxa. The small size (~500 µm prossome length) and biomass (8–48 µg C l−1) of copepods were also similar to those in other eutrophic bays (Lonsdale et al., Reference Lonsdale, Cosper, Kim, Doall, Divadeenam and Jonasdottir1996; López et al., Reference López, Viesca and Anadón2007).
The plankton community in Guanabara Bay is expected to change over the year according to the wet (summer) and dry (winter) seasons, as expected in tropical environments such as in south-eastern Brazil, but also due to the entry of the SACW in the eutrophic estuary. The annual variability of plankton abundance was investigated previously by Gomes et al. (Reference Gomes, Santos, Tenenbaum and Villac2007) and Santos et al. (Reference Santos, Villac, Tenenbaum and Paranhos2007) for microzooplankton and nanoplankton, respectively. Their observations of plankton abundance during spring corroborate our findings. According to their results, plankton abundance was minimal during winter and increased towards summer. Thus, our results are representative of spring conditions, under a certain level of rainfall, on which Guanabara Bay waters are influenced by the entry of upwelling water. This hydrological phenomenon has ecological implications to plankton composition, for example, changing the ratio of autotrophic to heterotrophic biomass; indeed, our results showed that the nanoplankton size fraction was autotrophic-dominated, contrary to what is usually expected for eutrophic estuaries and from previous observations in Guanabara Bay in periods with no penetration of SACW in the bay (Santos et al., Reference Santos, Villac, Tenenbaum and Paranhos2007). Changes in plankton composition and biomass will be reflected in changes in plankton trophodynamics; thus, we expect that in the absence of the influence of SACW, plankton trophodynamics in Guanabara Bay will differ from our results, with the prevalence of the microbial trophic pathway.
Diel variations of plankton abundance and biomass were observed for all planktonic groups, except for picoplankton, which biomass remained relatively constant during our sampling (Figure 3A). In contrast to shelf and oceanic waters on which bacterial abundance is usually higher during the day than at night, showing close coupling to phytoplankton (Fuhrman et al., Reference Fuhrman, Eppley, Hagström and Azam1985), diel periodicity of picoplankton in coastal waters do not show a well-defined pattern (Pagano et al., Reference Pagano, Champalbert, Maryse, Kouassi, Arfi, Got, Troussellier, N'Dour, Corbin and Bouvy2006; Santos et al., Reference Santos, Mendes, Gomes, Henriques, Correia, Almeida and Cunha2009; Parvathi et al., Reference Parvathi, Jasna, Haridevi, Jina, Greeshma, Breezy and Nair2013). The absence of fluctuations in picoplankton biomass might be a result of similar rates of growth and death (e.g. due to predation), which end up cancelling each other. A rough comparison of our estimated potential ingestion rate of picoplankton by microzooplankton (0.001 µg C l−1 h−1) and the rate of bacterial production estimated previously in surface waters of Guanabara Bay (3 µg C l−1 h−1; Guenther et al., Reference Guenther, Paranhos, Rezende, Gonzalez-Rodriguez and Valentin2008) suggests that picoplankton was not controlled by microzooplankton predation and, other factors, such as viral control, might be down-regulating picoplankton biomass (Parvathi et al., Reference Parvathi, Jasna, Haridevi, Jina, Greeshma, Breezy and Nair2013).
Interestingly, nano- and microplankton diel cycles were opposite to that of copepods (Figure 3B–E). Such a pattern might be a result of the predation pressure by copepods on nano- and microplankton during the night followed by the relaxation of predation during the day. Phytoplankton biomass might also be expected to follow the diel cycle of primary production, i.e. higher values during daytime and lower values during night-time due to the restriction of carbon fixation only to daylight hours (Fuhrman et al., Reference Fuhrman, Eppley, Hagström and Azam1985). However, microphytoplankton biomass (contrary to nanophytoplankton) remained low in the beginning of our second day of sampling suggesting that loss rates (e.g. predation and sinking rates) overcame growth rate (Figure 3C). Heterotrophic protists, in general, present higher growth and feeding rates during daytime, when phytoplankton are photosynthetically active (Jakobsen & Strom, Reference Jakobsen and Strom2004). In Mediterranean waters, ciliate biomass was also found to be maximal during the day and minimal during the night (Pérez et al., Reference Pérez, Dolan, Vidussi and Fukai2000). A previous study in Guanabara Bay investigated diel variations of plankton abundance over three consecutive days corroborating our findings for phytoplankton, but they did not find any clear diel pattern for microzooplankton (Guenther et al., Reference Guenther, Lima, Mugrabe, Tenenbaum, Gonzalez-Rodriguez and Valentin2012).
Predator-prey interactions based on size
To establish predator-prey relationships, we assumed that copepod nauplii were able to feed; in addition, we did not take into account the occurrence of mixotrophy in nano- and microplankton. First, previous studies indicate that nauplii feed both on bacteria (Turner & Tester, Reference Turner and Tester1992) and on nano- and microplankton (Stoecker & Egloff, Reference Stoecker and Egloff1987; Berggreen et al., Reference Berggreen, Hansen and Kiørboe1988). Because nauplii have been recognized as grazers, their predation was estimated. Second, the contribution of mixotrophy to the auto and heterotrophic groups was ignored. Here, it was assumed that all athecate dinoflagellates larger than 50 µm and all ciliates, with the exception of Myrionecta rubra, were heterotrophs. The estimates of autotrophic biomass from cell volume (761 ± 129 µg C l−1) and from chlorophyll-a concentration (using a ratio chlorophyll-a: carbon of 1: 40; Riemann et al., Reference Riemann, Simonsen and Stensgaard1989) (811 ± 86 µg C l−1) were similar, suggesting that mixotrophy on primarily heterotrophic protists (i.e. mainly mixotrophic ciliates) did not bias our estimation of autotrophic biomass. On the contrary, the heterotrophic fraction and, consequently, the predation by microplankton (particularly predation related to dinoflagellates in the size range 20–50 µm) may have been underestimated. Nonetheless, our finding that copepod and microzooplankton predation were not significantly different would not change even if we had assumed that all mixotrophic dinoflagellates were predators (paired t-test, t8 = 0.32, P = 0.76). Moreover, the autotrophic Tetraselmis spp. contributed ~92% of nanoplankton biomass, suggesting that mixotrophy in nanoplankton would have little influence on our results. While mixotrophy did not have a strong influence on trophic functioning in our study, it is possible that mixotrophy may have greater relevance under other hydrological conditions within Guanabara Bay.
It is known that predators have an optimum prey size at which their clearance rates are maximized. In this study, our approach to food web dynamics was based on optimum prey size because, in a non-limited environment, the predator is expected to feed on its preferential prey (Hansen et al., Reference Hansen, Bjørsen and Hansen1994) (Figure 4). Ingestion was estimated with respect to the optimal prey size for each functional group (dinoflagellates, ciliates, copepod nauplii and copepodites) because zooplankton show a variety of feeding mechanisms (e.g. ciliates and certain copepods are filter-feeding, while dinoflagellates can use feeding tubes or engulf the prey) and exhibit a broad prey size spectrum (Hansen et al., Reference Hansen, Bjørsen and Hansen1994). In contrast, if we had considered the biomass of all prey in the size range accessible to each predator in estimating ingestion (Figure 4), then the total potential ingestion (copepod + microzooplankton) would be three-fold higher and would have reflected an overestimation, particularly for copepods (due to their wide prey size spectrum) (Figure 4). According to the theory of optimum foraging (MacArthur & Pianka, Reference MacArthur and Pianka1966), predators display prey preference based on nutritional value and palatability, that were not considered here, nonetheless, prey size is considered to be the most important feature determining predator-prey interactions according to previous studies (Hansen et al., Reference Hansen, Bjørsen and Hansen1994, Reference Hansen, Koefoed and Hansen1997; Fuchs & Franks, Reference Fuchs and Franks2010).
Potential trophic functioning
Nanoplankton represented the optimum prey size for the majority of copepods stages, with the exception of copepods larger than 600 µm, for which microplankton was the prey of optimum size (Figure 4). Feeding on nano-sized prey may be explained by the feeding apparatus of copepods, which does not increase proportionally with body size (Wirtz, Reference Wirtz2012). For copepods larger than 600 µm, considering only the microplankton density measured in this study and applying the functional response equation described for A. tonsa in Tiselius (Reference Tiselius1989), copepods would ingest ~13% of their body C d−1 and would not reach their daily food requirement. Therefore, copepods (>600 µm) feeding only on microplankton would have been food limited; as a result, they would also need to ingest the most abundant item, nanoplankton. According to the literature, predators may feed on sub-optimum prey or detritus if the availability of that source is sufficiently high, or if the preferred prey is scarce (Heinle et al., Reference Heinle, Harris, Ustach and Flemer1977; Hansen et al., Reference Hansen, Koefoed and Hansen1997). In fact, copepods can display non-selective feeding (Kozlowsky-Suzuki et al., Reference Kozlowsky-Suzuki, Carlsson, Rühl and Granéli2006); in Guanabara Bay, even if the nanoplankton was not the preferred prey for the largest copepods, it may be an important supplementary item.
During our sampling, the base of the plankton food web in Guanabara Bay was composed of small cells (i.e. nanophytoplankton and autotrophic dinoflagellates up to 30 µm), supporting our hypothesis. Despite the elevated biomass observed during sampling, bacteria did not contribute significantly to the potential ingestion of the predators (Figures 3A & 5). Bacteria was accessible to copepod nauplii, ciliates and heterotrophic dinoflagellates <20 µm in size. Jeong et al. (Reference Jeong, Seong, Yoo, Kim, Kang, Kim, Park, Kim, Kim and Song2008) found that dinoflagellates were able to feed on bacteria, however the dinoflagellates observed in that study were smaller (15–30 µm) than those observed here (30–70 µm). In addition, Jeong et al.'s observations were made in a confined system; such behaviour may be different in natural environments. Contrary to what was expected, the potential ingestion of copepods was equivalent to that of microzooplankton, such that the latter was not the main consumer of the primary production in the bay. This unexpected result was likely related to the low microzooplankton density (mainly ciliates) in the bay, which tends to be higher in other estuaries (Iriarte et al., Reference Iriarte, Madariaga, Revilla and Sarobe2003; Chen et al., Reference Chen, Liu, Landry, Chen, Sun, Shek, Chen and Harrison2009). A top-down control upon the ciliate assemblage, whether by copepods (Vargas & González, Reference Vargas and González2004) or other predators such as larval fish (Figueiredo et al., Reference Figueiredo, Nash and Montagnes2005), may have contributed to the non-detection of higher ciliate densities during sampling.
Although we did not experimentally determine clearance rates or phytoplankton growth rates, we assessed plankton trophodynamics in Guanabara Bay on the basis of data related to nutrient concentration, plankton abundance, biomass and the sizes of predator and prey, in addition to the predator-prey size relationships and clearance rates reported in the literature. Based on specific prey characteristics (size, composition and biomass), it was possible to infer which predator would have higher ingestion rates and higher predation impacts upon its prey. Such an approach has been used in a number of other studies on plankton trophodynamics (Hunt & Matveev, Reference Hunt and Matveev2005; Ohman et al., Reference Ohman, Durbin, Runge, Sullivan and Field2008; Riisgård et al., Reference Riisgård, Madsen, Barth-Jensen and Purcel2012).
Especially given that Guanabara Bay is a highly dynamic system influenced not only by upwelling water but also by rainfall, tidal currents and sewage discharge, we are aware that our results are somewhat restricted because they are based on a 1-day observation and are representative from middle portions to the entrance of the Bay, since the drifter path over the day covered this area. Firstly, it is likely that in other periods, when the entrance of SACW into the bay does not occur, the microbial pathway predominates in the plankton food web. Secondly, in inner portions of the Bay the system becomes highly eutrophic and the influence of SACW is expected to be lower. In fact, this study did not aim to describe the planktonic trophodynamic in a large spatio-temporal scale, in contrast we focused in describing and estimating the predator and prey interactions and, therefore to understand the trophic functioning of the Bay in surface waters under SACW influence. This is the first study to provide information about plankton trophodynamics in Guanabara Bay, an important ecosystem for fisheries that has been highly impacted by anthropogenic forces.
In this study, the Lagrangian method and the fine temporal-scale sampling revealed that nanophytoplankton was an important prey for microzooplankton and copepods and that bacterial production was of minor importance in Guanabara Bay (Figure 5). Our observations reflect the particular influence of upwelling water in the highly eutrophic estuary occurring during austral spring and summer. In other periods of the year, the influence of rainfall is also expected to change the plankton trophodynamics in Guanabara Bay conforming to what is observed in other eutrophic estuaries around the world, i.e. highly influenced by heterotrophic bacteria and its subsequent consumption by microzooplankton. The entrance of upwelling water in the Guanabara Bay may favour the development of nanophytoplankton which, in turn, rapidly changes the composition and the size-structure of the plankton food web, potentially affecting secondary production. Studies approaching variations in planktonic community composition (species and size) and trophic interactions in a small time scale are still scarce but they are useful to the comprehension of the ecosystem functioning. Here we point out that short-term changes in the size-based predator-prey relationships had important implications for the understanding of the plankton food web complexity and dynamics.
ACKNOWLEDGEMENTS
We thank the crew on board and the boat captain for the sampling and Ricardo Pollery, Márcio Tenório and Diogo Lannes for laboratory analysis. We are grateful to Dr Betina Kozlowsky Suzuki, Dr Frederico Brandini, Dr Alexandre Azevedo and two anonymous reviewers who made valuable comments on this manuscript.
FINANCIAL SUPPORT
This study was part of the Long Term Ecological Project (PELD) funded by CNPq (Conselho Nacional de Desenvolvimento Científico e Tecnológico) and FAPERJ (Fundação de Amparo à Pesquisa do Estado do Rio de Janeiro). Suzana Leles had a fellowship from CAPES (Coordenação de Aperfeiçoamento de Pessoal de Ensino Superior).