


Introduction
The RADARSAT-1Antarctic Mapping Project (RAMP) is a collaboration between NASA and the Canadian Space Agency (CSA) to map Antarctica using synthetic aperture radar (SAR). SAR is used because of its ability to image the surface in all weather conditions and during the day or at night. SAR also yields high-resolution imagery with good contrast between sea ice, glacier ice and rocky outcrops, as well as discriminating features on the ice-sheet surface such as snow facies, crevasses, flow stripes, snow dunes and even evidence of human activity such as aircraft landing strips and traverse tracks.
The first Antarctic Mapping Mission (AMM-1) was successfully completed in October 1997 and has yielded the first high-resolution radar mosaic of Antarctica (Reference JezekJezek, 1999). The Modified Antarctic Mapping Mission (MAMM) occurred during the fall of 2000. MAMM has two goals, which complement science objectives for understanding the mass balance of the polar ice sheets and the response of the polar ice sheets to changing climate. The MAMM goals are:
(1) Produce high-resolution image mosaics of Antarctica north of 80˚ S latitude for change-detection measurements and studies to understand the response of the ice sheet to climate change;
(2) Measure the surface velocity field over coherent and/or trackable areas of the ice sheet north of 80˚ S latitude for ice-dynamics studies and for exploring time variations in the surface velocity through comparisons with earlier datasets.
This paper presents an overview of the MAMM acquisition campaign and discusses some of the early change-detection measurements made possible with this dataset. Reference JoughinJoughin (2002) discusses early interferometric velocity results in a paper included in this volume.
Acquisition Phase
The RADARSAT-1SAR is a C-band (5.3 GHz) instrument flown in a 24 day repeat orbit. Normally, the satellite is navigated so as to maintain its ground-track position within a ±5 km guard band about the nominal ground track prescribed at the Equator. To maintain the 24 day repeat cycle, the satellite elevation is routinely adjusted by firing its single thruster to compensate for deceleration due to drag. As drag acts on the satellite it slows and eventually descends. As it does so, the satellite position drifts laterally relative to the nominal nadir track. The shape of the satellite-track drift curve relative to the nominal track and measured over time is roughly parabolic. During low-drag periods, the parabola is flattened and interferometry is possible because of the small lateral displacements over time and the generally symmetric shape of the parabola. Consequently, there is a relatively infrequent requirement for accelerating the satellite back to a higher elevation, and thruster firings can be separated by over 40 days.
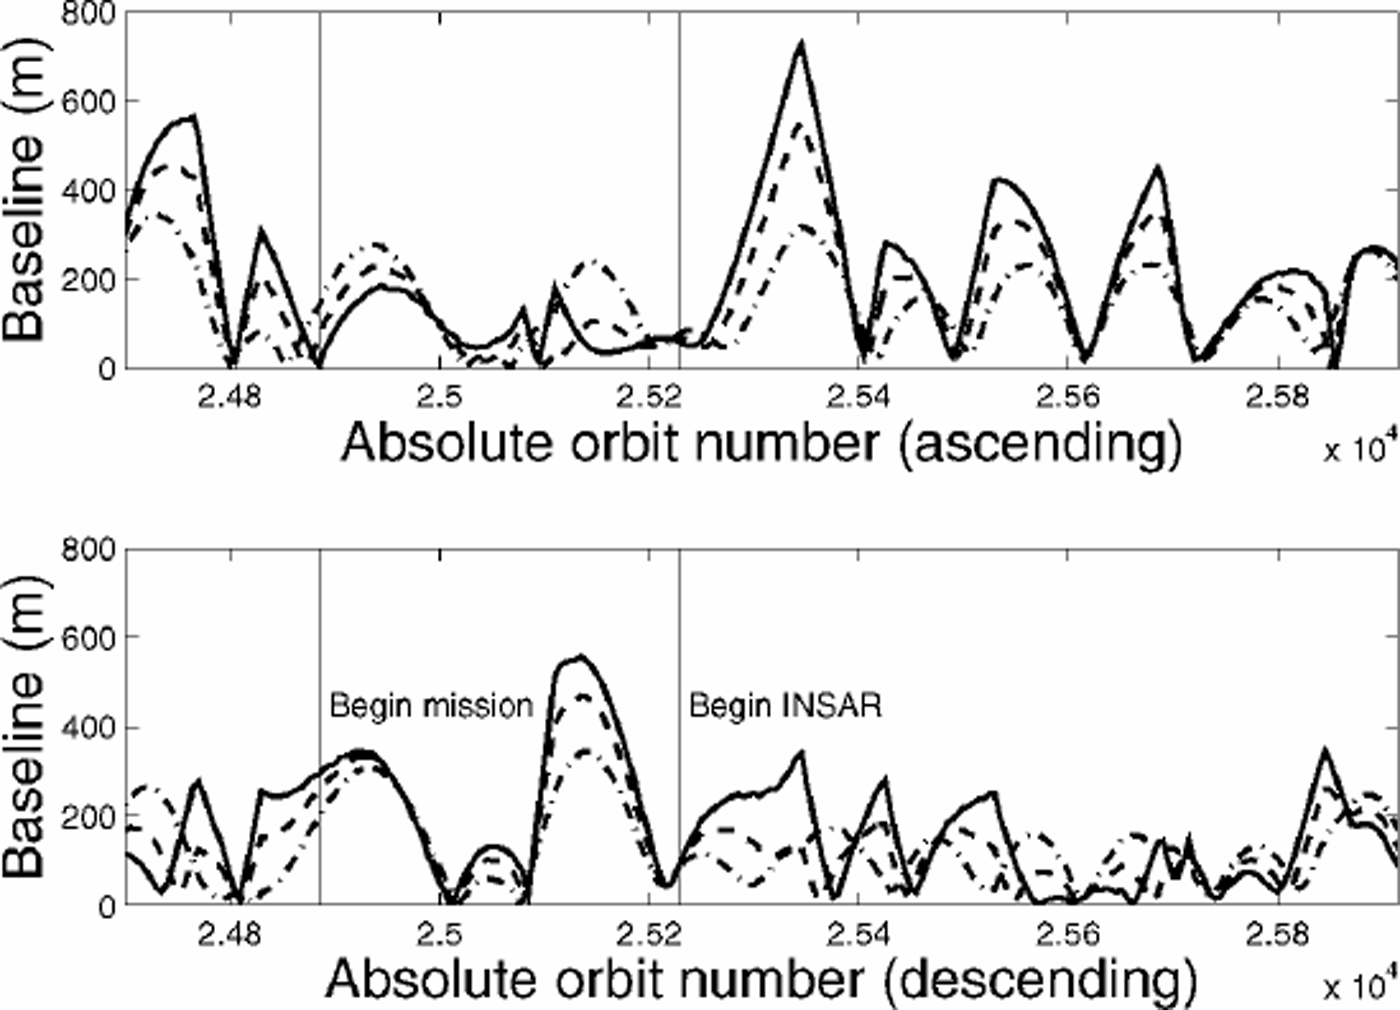
Unlike AMM-1, the MAMM campaign occurred during the peak of the solar activity cycle. Variable and at times high drag levels change the form of the ground-track drift curve into a steeper parabolic-like shape, which may be asymmetric if there are bursts in solar activity. To compensate for these conditions, more frequent, custom-designed adjustments to the satellite orbit are necessary in order to meet navigation requirements for interferometric applications. The basic navigational requirement for RADARSAT-1 interferometry is that the relative distance between repeat satellite observation positions should be less than about 250 m in order to maintain acceptable coherence, a quantity which improves with increasing radar-system bandwidth, signal wavelength and incidence angle. To meet this requirement, the CSA flight-dynamics team implemented a series of orbit maneuvers based on the measured satellite orbit and the predicted solar drag. Maneuvers occurred with periods as short as 6 days. Frequent orbit maneuvers can only be executed in north-looking mode because of the spacecraft design that includes only a single thruster. North-looking operations restricted coverage to regions north of 80.1˚ S (Fig. 1) but enabled the satellite to be routinely positioned to within several hundred meters of a modified nominal track, which was defined by position of the satellite during the first cycle of acquisitions. On average, CSA succeeded in keeping the satellite to within better than 500 mof the nominal track at the Equator. Because the orbits converge towards the pole, baselines at polar latitudes were about 200 m on average for ascending orbits and about 110m on average for descending orbits at 70˚ S during the interferometric-acquisitions part of the campaign (Fig. 2). Differences in the ascending and descending baselines are attributable to slight variations in the orientation of the satellite orbit plane between repeat cycles.
Ascending (upper) and descending (lower) cumulative-coverage maps for the three MAMM acquisition cycles. Maximum southerly coverage is 80.1˚ S.

Baselines (inmeters and plotted against RADARSAT-1 absolute orbit number) measured between satellite positions on successive repeat cycles for ascending (upper) and descending (lower) orbits. Baselines estimation was begun prior to the start of the mission (the first MAMM cycle began on absolute orbit 24885) to verify procedures. Baseline values associated with the MAMM interferometric SAR mission began after absolute orbit 25228, which corresponds to the start of MAMM cycle 2. Baselines are computed at 60˚ S (solid line), 70˚ S (dashed line) and 80˚ S (dot-dashed line).
RADARSAT-1 Fine-1 beam data were acquired to optimize the dataset for change-detection and surface velocity measurements. These data provide an unprecedented opportunity to make detailed images of many of Antarctica’s fast glaciers, whose extent was revealed through AMM-1data (Reference JezekJezek, 1999). The dataset was also optimized for interferometric analysis of the surface velocity field by using Fine-1 beam data, specified by nominal, single-look products having azimuth resolution of 8.9 m and a range resolution of 6 m (as referenced on the RADARSAT International web site: www.rsi.ca). This is because interferometric coherence becomes less sensitive to the satellite baseline as the range resolution improves. Said alternatively, the coherence improves as radar system bandwidth is increased for a fixed baseline separation. RADARSAT-1 Fine-1 beam data are collected with a bandwidth almost twice that of standard beams 1and 2 and almost three times that of standard beam 6.
MAMM began on 3 September 2000 and lasted till 14 November 2000, an interval corresponding to three repeat cycles. Acquisitions were scheduled by the CSA, and data were downlinked to the Alaska SAR Facility (ASF), Prince Albert Satellite Station, Gatineau Satellite Station and the McMurdo Ground Station. The acquisition plan was developed by theJet Propulsion Laboratory (JPL), Pasadena, CA, U.S.A., and designed to maximize fine-beam coverage over fast glaciers, obtain ascending and descending coverage of the viewable area using a combination of fine, standard beam and extended low beams, and to obtain three complete cycles of data for interferometric analysis. This meant that most of the continent was imaged six times during the 72 day period. The cumulative coverages over the 72 days in both orbit ascending and descending modes are shown in Figure 1. Wider-swath, extended low beams (16˚ depression angle, defined as the beam pointing angle from nadir) form the inner annulus of observations. Standard 1 (23˚ depression angle) and Standard 2 (27˚ depression angle) beams form the next ring. The perimeter of the continent was mapped with Standard 6 beams (43˚ depression angle) and with Fine 1 beams (38˚ depression angle), which are represented by the narrower swaths that usually extend across the coastline.
Data Analysis
ASF processed selected test data during MAMM. Our testdata processing strategy was designed to verify coverage and interferometric data quality during the mission. We also selected test sites of scientific interest based on either recently reported variability in the ice-sheet margin location or the presence of fast glaciers. ASF provided the acquisition-phase science team (which included members from The Ohio State University, JPL, ASF and the Canadian Center for Remote Sensing) with either signal data (level-0) or ground-range image (level-2) data products. Level-2 data are discussed here. We mosaicked the ground-range-projected level-2 data using image corner coordinates determined from the satellite ephemeris estimated using satellite state vectors measured during the acquisition phase. Experience from AMM-1 showed the RADARSAT-1 ephemeris yields accurate geolocation estimates to about 200m at sea level. We have not yet applied any other radiometric or geometric corrections to the data, and so restrict our analysis to the seaward ice margin so as to avoid elevation-induced distortions. Comparison between AMM-1 coastlines with either rocky or stagnant-ice locations on the MAMM images shows that relative geolocation is consistent to within at least 600 m in our study areas.
Ice-Margin Change Measurements
We investigated ice-margin position fluctuations in three areas: the Larsen Ice Shelf, Wordie Ice Shelf and Shirase Glacier study areas. For the Larsen Ice Shelf, we compared the Antarctic Digital Database (ADD) version 1 coastline (corresponding to a 1989 coastline estimate) (BAS, SPRI and WCMC, 1993; Reference Thomson and CooperThomson and Cooper, 1993), a July 1992 coastline manually derived from European Remote-sensing Satellite-1 (ERS-1) SAR data, the manually derived AMM-1 coastline and the coastline derived from the 2000 MAMM local mosaic (Fig. 3). Here, we define the coastline to be the boundary separating ocean from the contiguous ice sheet and rock outcrops of the continent. As documented by several previous investigators using combinations of visible and microwave imagery (Reference SkvarcaSkvarca, 1993; Reference Rott, Skvarca and NaglerRott and others, 1996; Reference Scambos, Hulbe, Fahnestock and BohlanderScambos and others, 2000), the Larsen Ice Shelf north of Seal Nunataks (frequently referred to in the literature as Larsen A) has nearly disappeared. The SAR data clearly show that the ice shelf has been replaced by thin sea ice and coastal polynyas, which appear dark on the SAR image. We speculate that the replacement of relatively thick ice shelf by thin sea ice and polynyas may play a role in the future local environment by increasing the amount of heat flux from the coastal ocean into the atmosphere.
Northern Larsen Ice Shelf imaged by ERS-1in1992 (upper left), RADARSAT-1 in 1997 (middle left) and RADARSAT-1 in 2000 (lower left). Images are centered at 64°43’ S, 59°15’W. Line map on the right shows ice margins and grounding lines from the ADD version 1 (1989) as the thick solid line, 1992 ERS-1SARdata as the short dashed line, 1997 RADARSAT-1data as the long dashed line, and 2000 RADARSAT-1 data as the thin solid line. The images depict the retreat of the ice shelf that bridgedJames Ross Island (RI) to the Antarctic Peninsula. Also shown is the retreat of Larsen A between the Sobral Peninsula (SP) and Seal Nunataks (SN) as well as the retreat of ice-shelf remnants in Larsen Inlet (LI). A small glacier, located in the southerly junction of the Sobral and Antarctic Peninsulas, retreated an additional 3 km from 1997 to 2000. Larsen B located between Seal Nunataks and the Jason Peninsula (JP) retreated 31.5 km from 1997 to 2000. We note that the ice shelf south of the Jason Peninsula (Larsen C) is little changed over the observing period.

The Larsen Ice Shelf south of Seal Nunataks (Larsen B) advanced some 3 km from 1989 to 1992 before retreating 31 km from 1992 to 1997 along a center line roughly paralleling the strikes of Seal Nunataks and the Jason Peninsula. The ice shelf retreated an additional 31.5 km from 1997 to 2000. Using the ADD and SAR coastlines, we estimate that the area of this portion of the Larsen Ice Shelf has shrunk from 11900km2 in 1989 to 9790km2 in 1997 and finally to 7460 km2 in 2000. The area actually increased slightly (*1%) from 1989 to 1992. We note that the rate of Larsen B retreat increases northward from the tip of the Jason Peninsula. This observation seems to be consistent with the interpretation of ice-shelf strain-rate fields modeled by Reference Doake, Corr, Rott, Skvarca and YoungDoake and others (1998). Theirmodel suggests that the more northerly part of the ice-shelf front has now retreated well past a compressive arch, which is related to the geometry of the ice-shelf bay and serves as a threshold position for ice-shelf stability. The implication drawn from their model is that the northern part of Larsen B will continue to retreat. Their model also suggests that the southerly part of the ice shelf may regain a measure of stability as the front sweeps south into a secondary embayment bounded to the south by the Jason Peninsula and to the west by the Antarctic Peninsula.
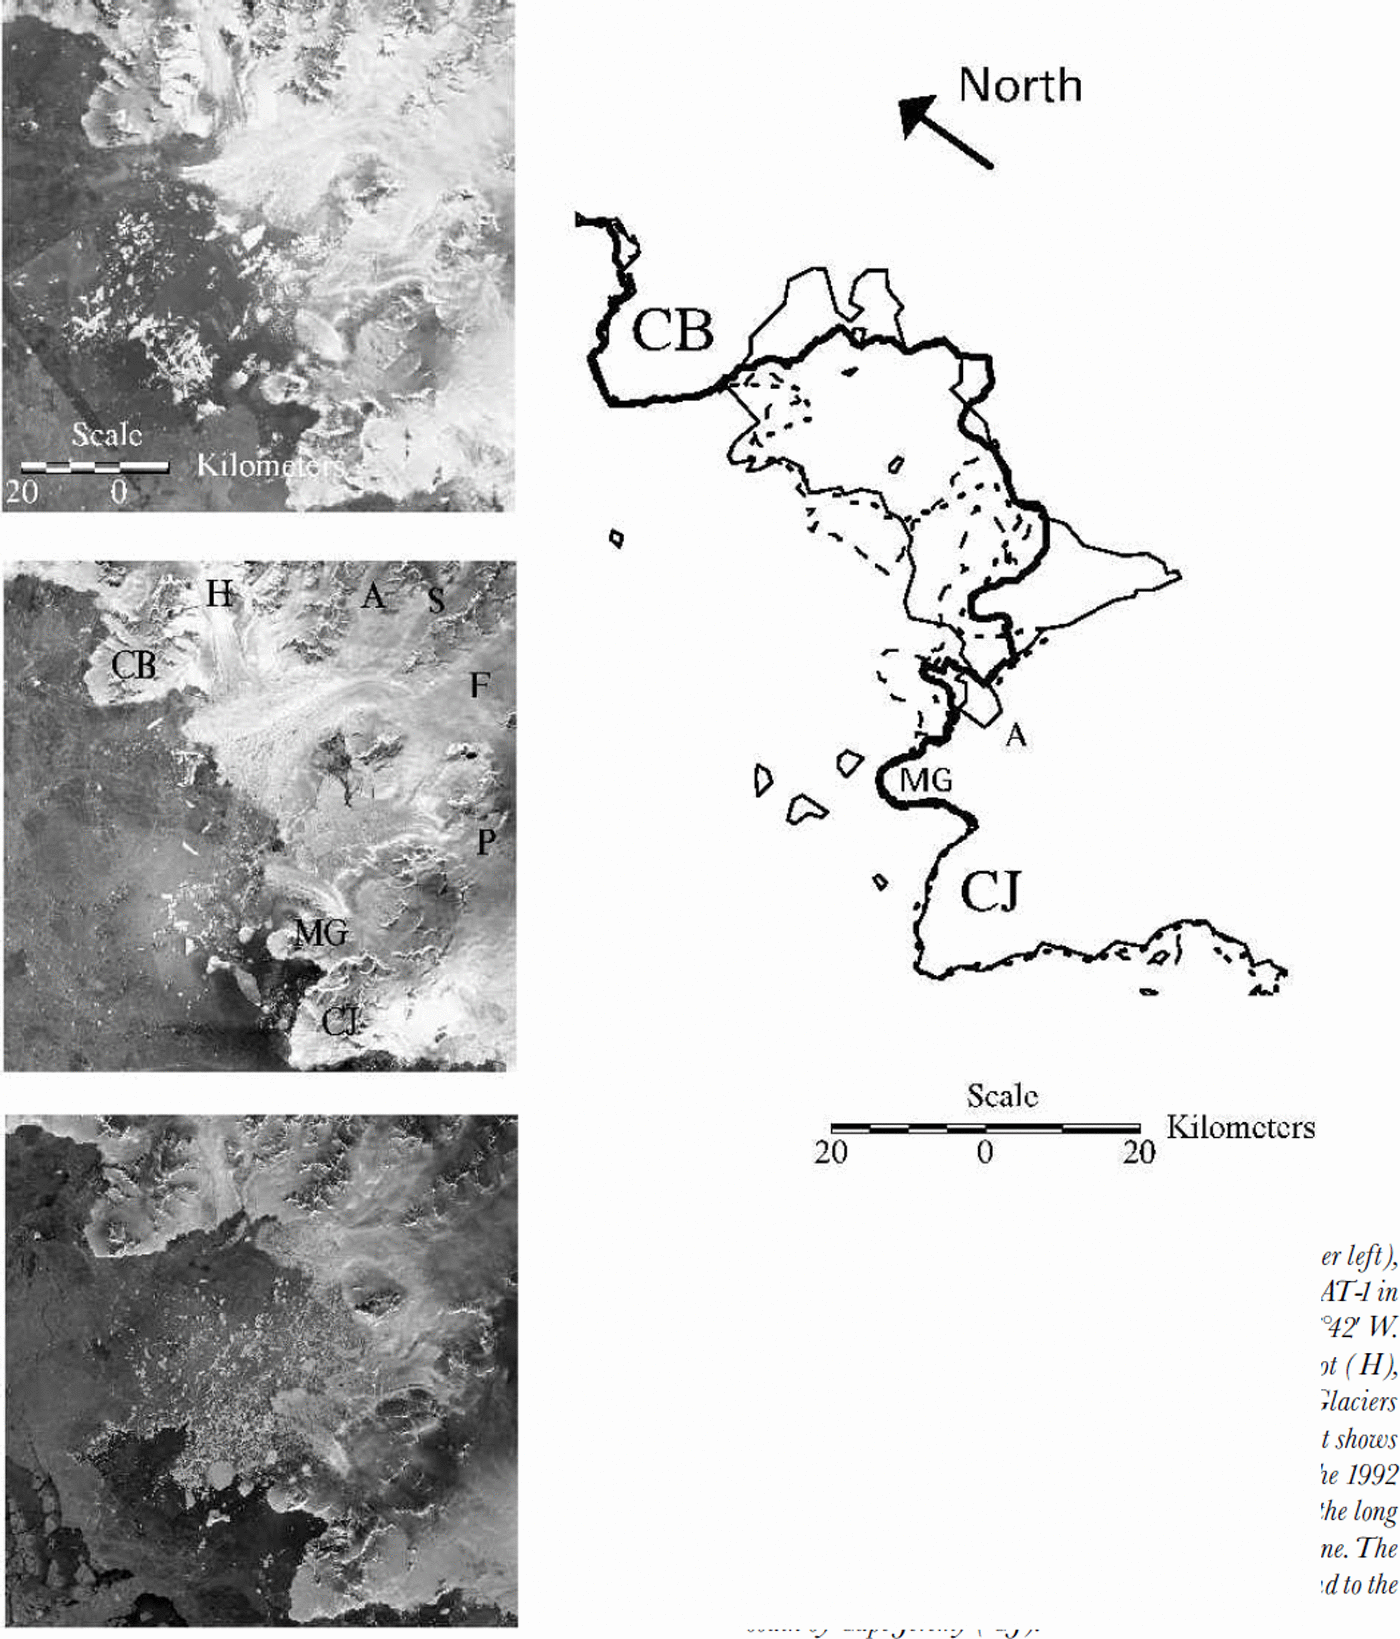
Our Wordie Ice Shelf study area is shown in Figure 4. The continuing collapse of the Wordie Ice Shelf, as originally described by Reference Doake and VaughanDoake and Vaughan (1991) on the basis of airborne reconnaissance and Landsat imagery, is evidenced by an additional 25 km of retreat from 1997 to 2000 to the south of Cape Berteaux. The three images shown in Figure 4 capture the interplay between the Hariot, Airy and Seller Glacier ice tongues from 1992 to 1997 and until 2000, when the ice tongues/ice shelf have largely disappeared. Curiously, we also observe that between 1992 and 1997 a small glacier tongue (identified by A on the line map in Figure 4) flowing along the eastern flank of Mount Guernsey advanced 47 km into Wordie Bay. By 2000 it had receded back to near its 1992 position. We cannot offer a quantitative explanation for the behavior of the glacier. We note that the seaward extent of flow from Prospect Glacier, which may have once dammed the flow of this small glacier, had retreated eastward by 1989. Perhaps back pressure on the small tributary glacier was reduced as the ice shelf retreated and the glacier was able to extend briefly into Wordie Bay (see Reference VaughanVaughan, 1993, fig. 2). Reference VaughanVaughan (1993) concludes that the rapid retreat of the Wordie Ice Shelf has resulted in no appreciable change in the behavior of the major tributary glaciers draining into Wordie Bay. At the very least, the behavior of the small tributary glacier suggests that this hypothesis should be re-examined.
Wordie Ice Shelf imaged by ERS-1 in 1992 (upper left), RADARSAT-1 in 1997 (middle left) and RADARSAT-1 in 2000 (lower left). Images are centered at 69³15'S, 67³42'W. Also shown on the 1997 image are the positions of Hariot (H), Airy (A), Seller (S), Fleming (F) and Prospect (P)Glaciers and Mount Guernsey (MG).The line map on the right shows the ADD version 1 coastline as the thin, solid line, the 1992 coastline as the short dashed line, the 1997 coastline as the long dashed line, and the 2000 coastline as the thick solid line.The map is bounded to the north by CapeBerteaux (CB) and to the south by CapeJeremy (CJ).
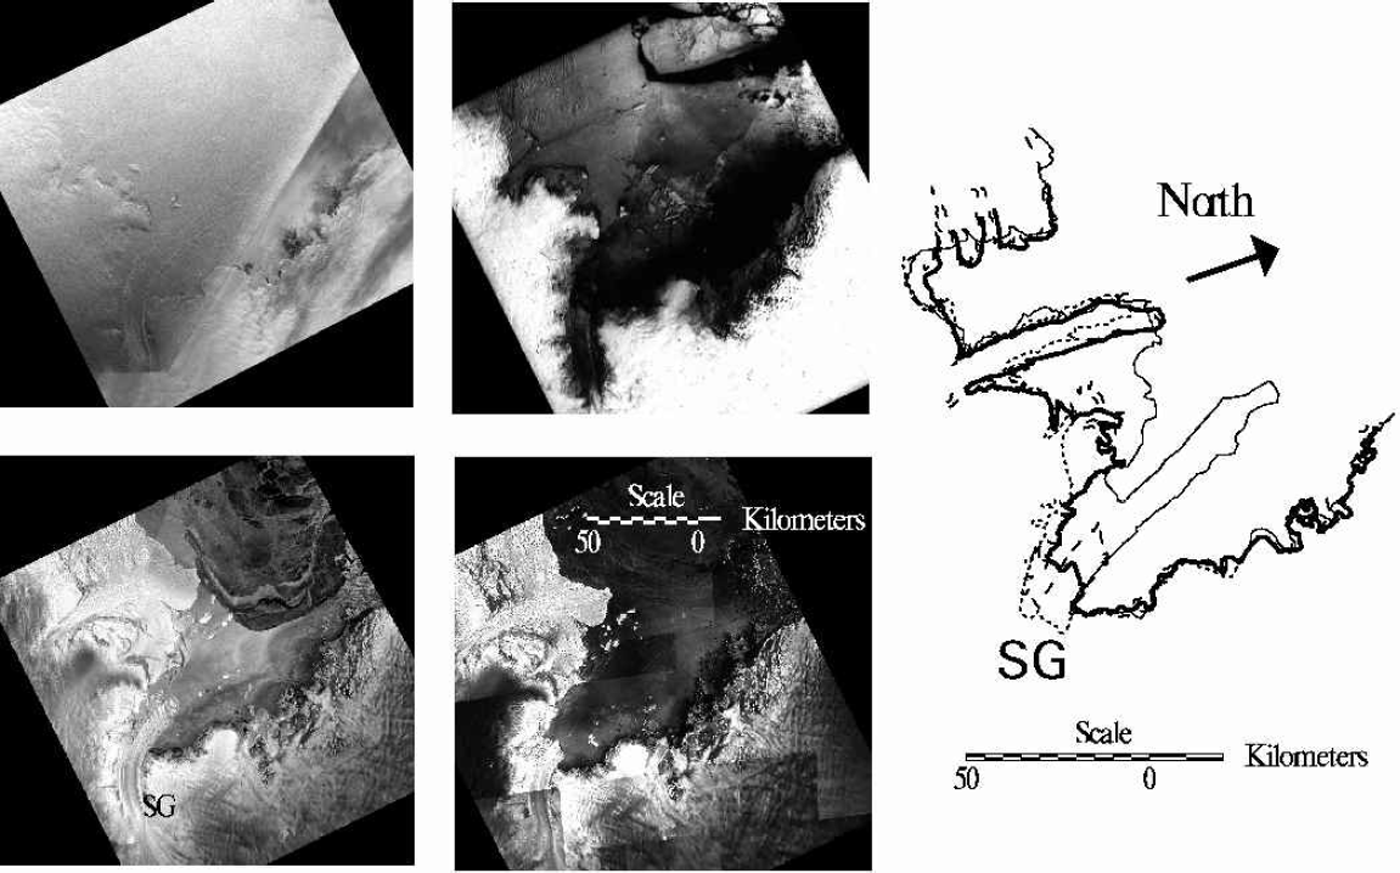
We measured similarly complex behavior of the glacier tongue extending seaward from Shirase Glacier (Fig. 5). In this case, we incorporated coastlines from 1963 Declassified Intelligence Satellite Photography (DISP) (Reference Kim, Jezek and SohnKim and others, 2001), a 1998 Landsat image, the AMM-1 coastline and the MAMM local mosaic. Using the 1988 ice-tongue position as a reference, the DISP data record a 91 km seaward extension of the glacier tongue into Lützow-Holm Bay. The glacier tongue shrank to a length of 55 km in 1974 (Swithinbank, 1988, fig. 5), and retreated to the reference point in 1988. The tongue grew to 21 km in 1997 before shrinking again to 9 km in 2000. The behavior of the Shirase Glacier tongue seems largely uncorrelated with the nearly invariant ice tongue just to the west.
Shirase Glacier imaged by the Argon satellite in 1963 (upper left), Landsat in 1988 (upper center), RADARSAT-1 in 1997 (lower left) and RADARSAT-1 in 2000 (lower center). Images are centered at 69°40 ‘S, 38°50’ E. The Shirase Glacier (SG) line map on the right depicts the 1963 coastline (thin solid line), the 1988 coastline (short dashed line), the 1997 coastline (long dashed line) and the 2000 coastline (heavy solid line).
In addition to these multiple dataset comparisons, we compared the AMM-1 coastline and available MAMM data for several other ice shelves around the continent. We found that the Amery Ice Shelf, the Fimbul Ice Shelf north of Jutulstraumen Glacier and Pine Island Glacier all advanced several kilometers in the 3 year period. A large segment of the Ross Ice Shelf margin retreated with the calving of iceberg B-15 in March 2000 (Lazarra and others, 1999). The Shackleton Ice Shelf was negligibly different between 1997 and 2000.
Reference Kim, Jezek and SohnKim and others (2001) have examined ice-margin positions along the Dronning Maud Land coast through a comparison of RADARSAT-1 1997 imagery, 1963 Argon imagery and the Antarctic Digital Database version 1 coastline (derived from Landsat imagery). The positions of these ice-shelf margins, which exist at about the same latitude as the southerly part of the northern Larsen Ice Shelf, seem to fluctuate about a more or less stable mean position over the 34 year period of observations. Kim and others report that the largest changes are associated with episodic calving events from glacier tongues and their subsequent readvance. On the basis of local climatology, they conclude that the Dronning Maud Land ice margins are likely to remain relatively stationary for hundreds of years. As part of a U.S. Geological Survey analysis of Landsat imagery of the Antarctic coast, Reference Ferrigno, Williams, Rosanova, Lucchitta and SwithinbankFerrigno and others (1998) have studied ice-margin fluctuations for the Marie Byrd Land and Ellsworth Land coasts using early 1970s to early 1990s Landsat imagery. They also report fluctuations about a more or less stable mean ice-margin position over the period of observations.
Summary
RAMP has now accumulated data for two snapshots of Antarctica, the first being a complete portrait and the second capturing the outer part of the continent which is most likely to experience relatively rapid change. The combined interferometric coverage from both datasets offers the opportunity for estimating surface velocities over a substantial fraction of the ice-sheet surface. We believe these snapshots will be important for understanding how and why the ice sheet will respond to changing climate. Indeed, much use has already been made of satellite observations of the Antarctic Peninsula and the retreat of Antarctic Peninsula ice shelves (Reference Doake and VaughanDoake and Vaughan, 1991; Reference Rott, Skvarca and NaglerRott and others, 1996; Reference Skvarca, Rackand and RottSkvarca and others, 1999). That research and ours has been stimulated by the possibility that the ice-shelf retreat is diagnostic of warming temperatures (Reference MercerMercer, 1978). The RAMP data help place those observations within a continental reference frame and reveal that the behavior of the ice sheet varies appreciably with region. Taken together, those observations and the results we present here seem consistent with a general picture of a continental ice sheet that is changing, and changing measurably within just a few years. But it is also a complex picture that shows that at least the margins of the ice sheet are not yet changing in a spatially or temporally systematic fashion.
Acknowledgements
This research is supported by a grant from NASA’s Pathfinder and Polar Oceans and Ice Sheets Program. RADAR-SAT-1 image data are copyrighted by the CSA. ASF, JPL and Vexcel Corporation are partners with The Ohio State University on RAMP. Successful execution of the acquisition phase resulted from exceptional efforts by the CSA flight-dynamics and mission-planning teams.



