1 Introduction
The low take-up of annuities by US retirees, better known as the annuity puzzle, has been intensively researched. Several explanations have been put forward, among them ‘rational explanations’ rooted in economic theory and ‘behavioral explanations’ based on human biases in valuing annuities (Brown, Reference Brown2007). The Dutch pension fund system, where the current payout is exclusively in annuities, is considering the introduction of a pension payout in the form of partial lump sums. This possible change is stimulated by the recent change in UK legislation that allows for the withdrawal of pension capital in the form of full or partial lump sums as an alternative to full annuitization. These reforms create unique opportunities to test important hypotheses about the US annuity puzzle in both the Netherlands as well as the UK.
Standard economic theory suggests that a utility-maximizing individual with an uncertain lifetime would prefer to convert his or her entire wealth into an actuarially fair annuity (Yaari, Reference Yaari1965). This suggestion, however, differs greatly from empirical research observations, leaving economists puzzled about actual agents’ behavior. With standard theory failing to satisfactorily explain this annuity puzzle, more promising explanations come from behavioral economists, who stress that decisions in the pension domain are subject to a number of behavioral biases. Using prospect theory (Kahneman and Tversky, Reference Kahneman and Tversky1979) and mental accounting (Thaler, Reference Thaler1985), annuities are shown to be systematically undervalued by retirees (Hu and Scott, Reference Hu and Scott2007). Individuals of lower cognitive ability especially tend to make mistakes in valuing annuities (Brown et al., Reference Brown, Kapteyn, Luttmer and Mitchell2013). One line of research focuses on the use of so-called investment framing instead of consumption framing (Brown et al., Reference Brown, Kling, Mullainathan and Wrobel2008). The key to the undervaluation of annuities may be that retirees in the USA are stuck in an investment frame, in which the annuity is perceived as a risky gamble depending on their uncertain remaining lifetime rather than a collective longevity insurance scheme. Consumption framing would stress the latter with its focus on a steady stream of income as long as one lives. Mottola and Utkus (Reference Mottola and Utkus2007) indeed find higher annuitization rates in traditional defined benefit (DB) plans (where a consumption frame is more likely to be the default frame) than in defined contribution plans. Benartzi et al. (Reference Benartzi, Previtero and Thaler2011) find similar results with a larger sample of plans. They find that retirement plans that change from DB to defined contribution suffer a decrease in annuitization rates. Brown et al. (Reference Brown, Kapteyn and Mitchell2016) investigate the potential effects of extending the investment- and consumption frames with loss and gain frames on the annuitization decision but do not find significant results.
To the best of our knowledge, the framing hypothesis has so far only been tested for the USA (Agnew et al., Reference Agnew, Anderson, Gerlach and Szykman2008; Brown et al., Reference Brown, Kling, Mullainathan and Wrobel2008, Reference Brown, Kapteyn and Mitchell2016; Beshears et al., Reference Beshears, Choi, Laibson, Madrian and Zeldes2014). These experiments are characterized by two major drawbacks. First, the choices often are presented to (internet) test groups without an explicit link to the respondents’ real-life situation and, second, the specific institutional environment has probably educated and framed the US respondents in a specific way, stressing pension capital rather than pension annuities. Testing the framing hypothesis outside the USA allows us to evaluate its general validity. Since Dutch plan members are used to annuities, they are likely to evaluate them through a consumption frame and to be less sensitive to the investment frame.
This paper uses a survey-based experiment with 3,161 members of a Dutch pension fund to study the impact of framing on the annuitization decision with the effects of consumption and investment frames combined with loss and gain frames. In the experiment, respondents make two hypothetical pension choices. The first one concerns the choice on the fraction of pension wealth that is paid out as a partial lump sum (0%, 5%, 10%, 15%, or 20%). The remaining pension wealth is annuitized. This paper is primarily focused on this first choice option. The second choice allows individuals to vary the payout profile of the remaining annuity during retirement. The choices are based on the respondents’ real pension accrual and on their own pension plan, which makes the experiment as realistic as possible.
The contribution of the paper to the existing literature is threefold. First, this paper is among the first applications of the framing hypothesis within the pension domain outside the USA.Footnote 1 Unlike Brown et al. (Reference Brown, Kapteyn and Mitchell2016), we find strong and highly significant effects of the extended framing hypothesis (i.e., the combination of investment and consumption frames with loss and gain frames) in line with predicted effects. This may be explained by the realistic setting of the experiment in which participants are shown personalized information such as income, pension accrual and projections. Second, the paper indicates that the institutional environment probably matters for explaining puzzles in annuity demand. The institutional environment predefines the perspective through which individuals filter annuities. We find Dutch plan members to seek for relatively high annuitization rates, much higher than known from the USA. Dutch pension choices and pension information is communicated mostly in consumption language. Dutch plan members therefore appear to filter the annuitization decision through a consumption frame, leading to what we call a ‘reversed annuitization puzzle’. Therefore, when explaining annuity demand, one needs to keep in mind not only the underlying human biases but also the institutional environment. US plans with annuity payoff as primary design also show up a relatively high annuity preference, compare Hurd and Panis (Reference Hurd and Panis2006), Beshears et al. (Reference Beshears, Choi, Laibson and Madrian2009) and Benartzi et al. (Reference Benartzi, Previtero and Thaler2011). We also find risk aversion, time preference and trustworthiness of the pension system explain annuity demand differences between Dutch plan members. These factors typically will vary across countries, each with their own pension institutions, and so they may contribute in explaining the international differences in annuity demand. Finally, heterogeneity among plan participants also plays an important role in the effect of framing on annuitization preferences. We find gender is of relevance to framing, supporting the findings of Agnew et al. (Reference Agnew, Anderson, Gerlach and Szykman2008) that men and women are responsive to different frames. We also find that the effectiveness of framing is low for plan members with long debt positions as they have an outspoken preference for lump sum take-up.
The remainder of this paper is organized as follows. Section 2 gives an overview of the literature on the framing hypothesis. Section 3 provides a brief introduction to the Dutch pension system and its implications for research into annuitization behavior. Section 4 describes the methodological approach, as well as the datasets. Section 5 presents and evaluates the empirical results. Section 6 discusses findings in relation to the annuity puzzle and the role of professionals in offering pension choice options. Finally, Section 7 concludes the paper.
2 Literature review
In a series of publications, Kahneman and Tversky challenged the theory of rational consumer choice when demonstrating that the stability of preferences is strongly affected by the frames through which prospects and outcomes are evaluated (Kahneman and Tversky, Reference Kahneman and Tversky1984; Tversky and Kahneman, Reference Tversky and Kahneman1981). Describing a decision problem in terms of gains or losses and suggesting certainty in a situation of uncertainty (pseudo-certainty effect) for example are shown to reverse preferences.
These concepts have been recently applied to explain the annuity puzzle. Since annuities are both collective longevity risk insurances as well as financial products, highlighting either aspect will change how people perceive an offered contract. Annuities appear more attractive when framed as the former (Gentry and Rothschild, Reference Gentry and Rothschild2006). Another kind of framing occurs when people receive their pension statement in terms of retirement income streams, as opposed to total lump sum values. Benartzi et al. (Reference Benartzi, Previtero and Thaler2011) find that plan members receiving their pension statement in terms of retirement income streams are more likely to annuitize, other things being equal.
2.1 Framing
Brown et al. (Reference Brown, Kling, Mullainathan and Wrobel2008) argue that mental accounting applies and annuities are evaluated as either just one possible investment among many (investment frame) or as only a smooth retirement consumption path (consumption frame). In an investment frame, annuities appear to be relatively unattractive, because their total payoff depends on an unknown lifetime length. Income from a riskless bond, in turn, will be independent from that stochastic variable. Additionally, the owner of the annuity runs the risk of losing the entire principle, while a bond could be passed on as a bequest. Since people are loss averse, this aspect makes the annuity become even more unattractive. Furthermore, annuities appear as poor investments because of fiercer liquidity constraints.
On the other hand, individuals filtering annuities through a consumption frame appreciate the protection against outliving their resources and not having to cut down on consumption when living longer than expected. Loss aversion will further strengthen their preference for annuities, since the loss of longevity protection looms stronger than possible gains from holding another asset (e.g., a riskless bond).
To put respondents in a consumption or investment frame in experiments, Brown et al. (Reference Brown, Kling, Mullainathan and Wrobel2008) alter the vocabulary used in explaining a specific decision problem. For the investment frame, the decision problem is explained in investment-related language, using words such as invest, risk, return, and payoff. For the consumption frame, the language avoids anything related to financial products and instead talks about purchasing power, consumption, regular payments, income, and so forth.
Brown et al. (Reference Brown, Kapteyn and Mitchell2016) combine the consumption versus investment frames presented to respondents with effects from gains and losses. They thus create four different frames, which are also part of our research: investment gain (IG), investment loss (IL), consumption gain (CG), and consumption loss (CL). Two behavioral effects are at play in the four combined frames: loss aversion and the pseudo-certainty effect. These two behavioral effects interact with each other and form the reflection effect (Fagley, Reference Fagley1993).
2.1.1 Loss aversion
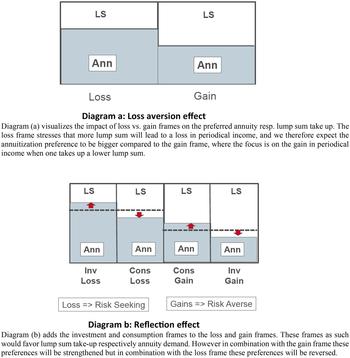
Prospect theory suggests that, departing from a reference point, losses have much stronger effects than gains do and hence more potential to influence decisions (Kahneman and Tversky, Reference Kahneman and Tversky1979). Since losses loom heavier than gains, annuities are more appealing in a loss frame than in a gain frame. Figure 1a below illustrates the annuity position in the gain and loss examples.
(Colour online) The impact of loss aversion (Diagram a) and reflection effect (Diagram b) on annuity demand.

2.1.2 Pseudo-certainty effect
The key difference between the consumption and investment frames is how agents perceive the risks associated with annuities. In a consumption frame, annuities are appealing because they are perceived as a certain payout (longevity insurance). In an investment frame, they are unattractive, because they are perceived as an uncertain payout, since the return depends on the remaining lifetime. Since the underlying risk is identical and only the perceived riskiness (certainty) is different, this can be seen as a practical application of the pseudo-certainty effect as implied by prospect theory. The consumption frame perceives annuities rather as a certainty, whereas the investment frame evaluates annuities as an uncertainty.
2.1.3 Reflection effect
According to the so-called reflection effect (Fagley, Reference Fagley1993), describing a decision problem in terms of gains or losses as well as suggesting certainty or uncertainty (pseudo-certainty effect) can reverse preferences. People show risk aversion for positive gambles and risk-seeking behavior for negative gambles. To put it differently, they gamble to avoid losses but they avoid gambling to capture possible gains. Hence, they will prefer certain gains over uncertain gains but uncertain losses over certain losses. Individuals are likely to show a strong preference for annuities when additional annuitization is explained in consumption language (certain gain). When investment language is used, additional annuitization is perceived as an uncertain gain. Individuals then will be more inclined to enlarge their lump sum position (certain gain). On the other hand, explaining the effects of lower annuitization in investment language is experienced as an uncertain loss and agents will be inclined to gamble by holding or more probably by enlarging their annuity position (uncertain loss). Less annuitization explained in consumption language is perceived as a certain loss. Individuals prefer to take a gamble by moving to the risky position of more lump sum (uncertain loss).
Figure 1b illustrates the changes in the initial annuity positions in the loss respectively, gain frames (dotted lines) by the interaction of gain and loss examples with investment and consumption language respectively.
3 The Dutch pension system and its relation to framing
The pension system in the Netherlands is based on three pillars: a first pillar, the public pay-as–you-go pension (AOW pension); a mandatory occupational second pillar funded system; and a complementary voluntary third pillar to provide for additional tax-sheltered retirement savings (PensioenFederatie, 2015).
The first pillar pension offers a flat-rate benefit to all residents at retirement age, regardless of previous income or employment. The gross benefit level is around US$1,700 per month for married couples and $1,200 for singles (2015).Footnote 2 The first pillar pension represents a considerable amount of retirement income at the lower end of the income distribution. It must be assumed that whatever annuitization behavior is observed, it will be partly driven by the relative importance of the first pillar.
Participation in a fully funded second pillar pension scheme is mandatory for most employees. These pension plans are mainly run by pension funds and are independent from the plan sponsor. Pension funds in the Netherlands can be industry-wide funds, corporate funds, or funds for independent professionals. In the past, nearly all schemes were traditional DB plans with fully indexed pension rights based on final salaries. Even though there has been shift toward average-pay DB plans with conditional indexation, most employees are covered by a collective plan in which accruals, contribution levels, indexation, and investment strategies are uniform among plan participants (Kemna et al., Reference Kemna, Ponds and Steenbeek2011).
The third pillar comprises tax-facilitated individual pension products. It is mainly used by the self-employed and employees for whom no collective scheme is available or who want to build up additional pension rights.
The pension law requires all pension payouts in the second pillar to be annuitized.Footnote 3 Various studies suggest that the welfare of citizens in the Netherlands might be improved by reducing the level of mandatory annuitization in order to address liquidity needs, precautionary motives, and bequests (Brown and Nijman, Reference Brown, Nijman, Bovenberg, van Ewijk and Westerhout2012; Bart et al., Reference Bart, Boon, Bovenberg, van Ewijk, Kortleve, Rebers and Visser2016). Pension funds increasingly allow plan members to choose variation of the annuity level. Lump sum payouts are not allowed, but introduction of this option is currently under debate. This study should help to determine the extent to which Dutch plan members will make use of possible partial lump sum payouts and how professionals could influence and support individual decision making with regard to these new choice options.
Dutch plan members receive annual statements on their projected accrual upon retirement. These statements do not indicate the total value of accrued wealth but provide an expected yearly gross pension income if the plan member continues his or her career at current salary levels until reaching retirement age. This has important implications for the framing hypothesis. Mottola and Utkus (Reference Mottola and Utkus2007) find significantly higher annuitization rates, when pension accrual is stated in terms of annuities rather than lump sums. Benartzi et al. (Reference Benartzi, Previtero and Thaler2011) find the same pattern and argue that this is because communicating accrual in annuities promotes consumption framing, while reporting accrual in lump sums fosters investment framing.
4 Methodology and data
We analyze data from a survey-based experiment with a hypothetical annuitization decision. The stated annuitization and lump sum preferences are matched with an array of behavioral and rational variables, motivated through earlier findings and models and economic theory. Observations are taken from a survey among participants of a large pension fund. The survey is personalized using proprietary pension plan data.
4.1 Two-step approach
The analysis of lump sum take-up proceeds in two steps:
1. We first present the choice options as neutral as possible. The evidence from this neutral setting allows us to draw a picture of the typical full annuitizer as well as the typical lump sum taker. This is an important step in our research, since this baseline level of lump sum take-up will serve as the benchmark when assessing framing effects.
2. Second, we assess the impact of framing choice settings. Keeping other things equal, we alter the language and explanatory examples in the experiment in accordance with the four frames explained above: CG, CL, IG, and IL. The assessment of framing effects proceeds in three sub-steps:
2.1 The level of lump sum take-up across the different frames is analyzed, giving a first indication of the direction in which the frames and defaults work.
2.2 Regression analyses ensure the statistical significance of the results of item 2.1 and test the robustness of the framing effect to the inclusion of other variables. Control variables are introduced to the analysis.
2.3 Finally, as sub-groups may differ in sensitivity to framing we also test for split datasets (gender, debt positions).
4.2 The experiment
The experiment is a personalized two-step allocation procedure. In step 1, respondents allocate their projected pension income to a lifetime annuity and a (partial) lump sum payment of up to 20% of the projected accrued pension capital. In step 2, respondents can decide to receive the remaining pension benefits, after lump-sum take up as a flat annuity or opt for actuarially fair variations in the payout profile. They can choose either a high–low profile, where the pension payment is higher in the first years and thereafter lower than the level annuity payment, or a low–high construction, where the annuity payments are first lower and then higher than the level payment. Respondents were allowed to switch back and forth between the two steps to ensure they chose what they considered an optimal allocation. The second step was included in the decision because both high–low and low–high constructions are available options in the Dutch system, and choosing a high–low or low–high combination of annuity payout may relate to a lump sum take up. To avoid further complications, a number of real-life options were fixed in the experiment: the retirement age was fixed at the age set in the first pillar (67 years), partner pension reallocation was omitted, and the high–low switching point was set to age 70. Further, the conversion between annuity payments and lump sum payments as well as among high–low payments is based on uniform actuarially fair discount and conversion factors as used by the pension fund, including gender and birth cohort-specific mortality tables.
4.2.1 Methodological remarks on annuity experiments: advances and pitfalls
Two major issues concerning experiment-based annuity preferences must be pointed out. First, respondents’ decisions have no consequences in real life. Obviously, the stakes would feel much higher if this was a real-life decision. Hence, some bias may occur, since people may not put as much thought into their decision as they would otherwise.Footnote 4 Second, the respondents may not be able to relate in a meaningful manner to the decision problem, its dimensions, and the hypothetical stakes. In fact, many annuitization experiments suffer from alienation bias (Hanemann, Reference Hanemann1994; Whittington, Reference Whittington2002), stemming from the applied ‘one size fits all’ decision problems.Footnote 5 The setup of our study limits alienation bias, since it uses the individual respondent's actual personal data provided by the pension fund on the accrued pension income upon retirement. The respondents should recognize the presented information from their annual pension statements, which creates a realistic scenario of choice options, which the respondent can actually relate to. This is a major advantage over the uniform amount decision problems often applied in the experimental literature.
4.2.2 Setting up the choice decision problem
The respondents are asked to imagine they retire at age 67, by which time they will have accrued €X in annual gross pension rights. They are told that they can decide on their preferred payout scheme in two subsequent steps. After a brief introduction to the two steps, it is explicitly stated that the first choice will influence the options in the second step and that one can switch back and forth as often as preferred. Additionally, the respondents are informed that the pension fund aims to adjust for inflation. Then, an example explains how much lump sum people can get when they retire and how a decrease/increase in the lump sum take-up affects one's annuity payments. In the introduction and in the explanatory example, different respondents are confronted with different wording according to the four frames and a neutral frame.
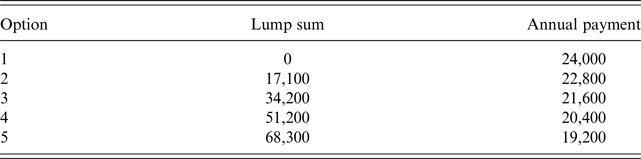
On the same page, respondents are asked to take the first step and select one of five lump sum cash outs (0%, 5%, 10%, 15%, and 20% of total pension rights). For every option, the remaining annual pension rights are displayed as well. Table 1 reports the choice options in step 1 for an individual with €24,000 of projected gross annual pension rights. In this research we are primarily interested in the lump-sum take up, the first step.
Choice options in Step 1

4.2.3 Frame implementation
In total, we distinguish five different frames: neutral (baseline), CG, CL, IG, and IL.Footnote 6 All frames are designed to contain the same amount of information and the same explanatory examples. They only differ in the specific framing. For details on the wording, see the exact Dutch survey questions in Appendix C. It is important to note that all respondents were randomly assigned to only one of the frames (around 470 participants each) to ensure high-quality data with no interference from learning and spillover effects.
The neutral frame uses neither explicit consumption-related language nor explicit investment-related language and only states the facts. The explanatory example can be interpreted either way, giving an example in terms of gains as well as in terms of losses, to ensure neutrality. It provides a hypothetical baseline level of annuitization for the Dutch case once partial lump sum payments are allowed. It also serves as the benchmark lump sum pick-up for the other frames.
The CG frame differs from the neutral frame in terms of language and examples. The wording explains the tradeoff between lump sum payments and annuities in terms of spending and income and ‘money to pay the bills.’ This frame is expected to highlight the longevity insurance component of the annuity. The examples explain how purchasing power can be increased and additional protection against having too little to spend during retirement can be gained by selecting a smaller lump sum.
The CL frame uses the same language and terms as the CG frame but instead, explains how one loses purchasing power and money to spend when selecting a higher lump sum.
The IG frame uses investment-related language, such as return on pension investments. The annuity is thereby expected to be perceived as a financial product with uncertain returns. The examples then explain how one can increase yearly returns by choosing a smaller lump sum.
The IL frame is again identical in wording to the IG frame but uses examples explaining how yearly returns will decrease once a higher lump sum is chosen.
4.3 Sample group and data
The dataset in this research is derived from a survey run at a large Dutch pension fund. The survey conducted among its plan members had two purposes: First, collect a vast set of relevant variables for the annuitization decision that was not available in the client database and, second, run an experiment with a hypothetical lump sum versus annuity choice to test plan members’ reactions to partial lump sum payments, as well as framing effects in that context.
4.3.1 Dataset
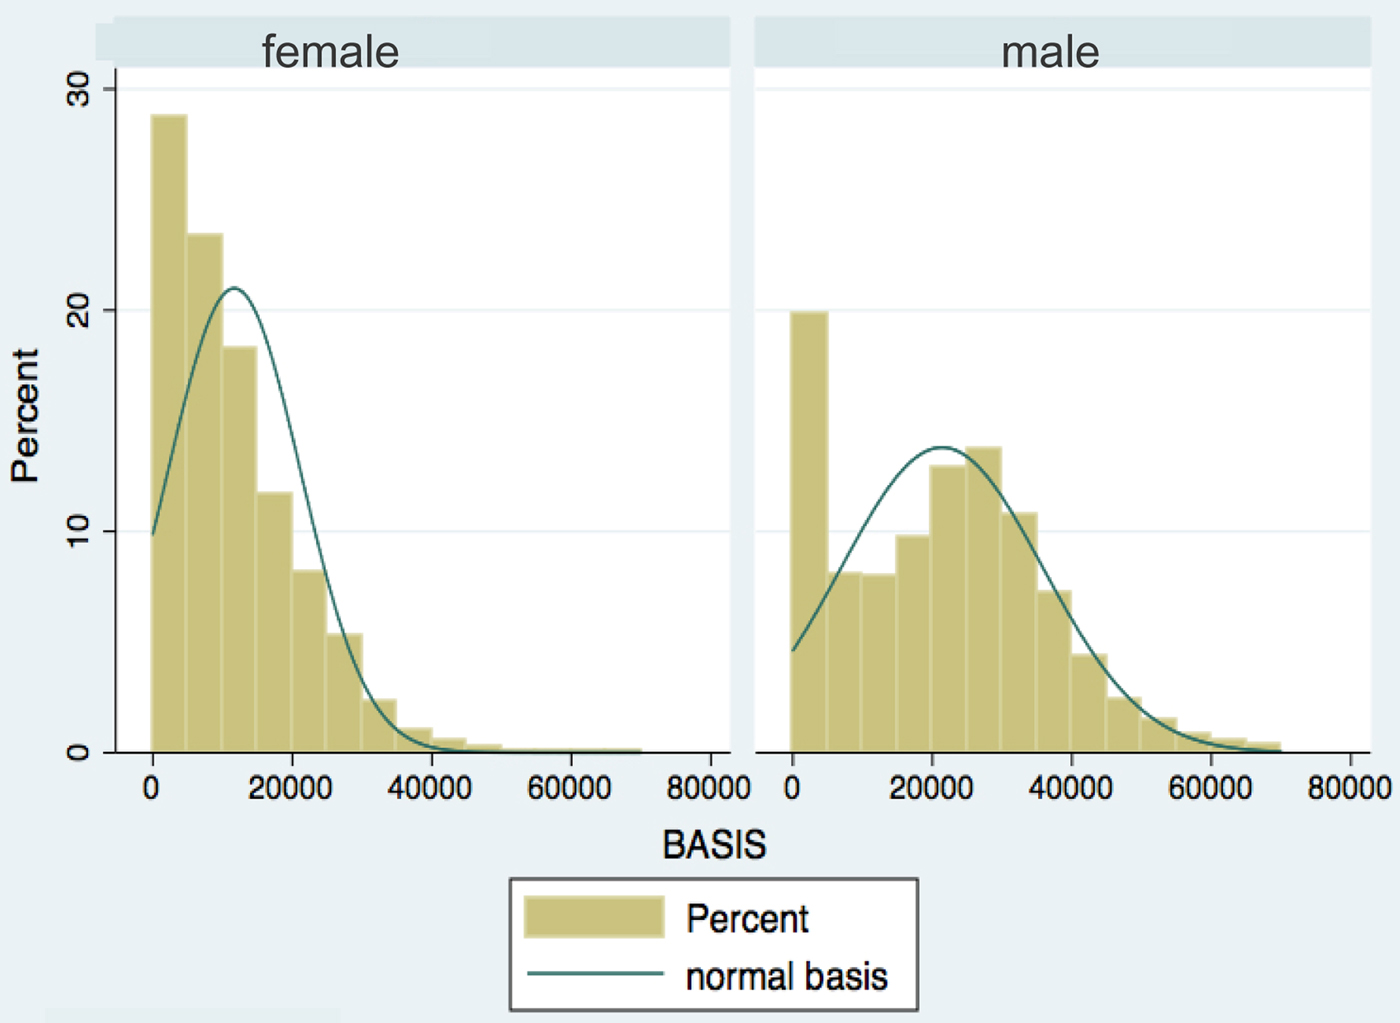
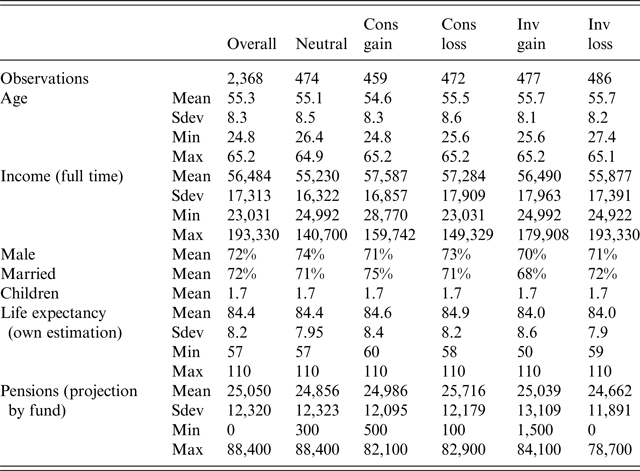
The online survey was sent to 15,000 individuals who were randomly selected from a panel of active plan members available for client research projects. In total, 2,368 plan membersFootnote 7 answered all the questions. The average age of the respondents was 55.2 years (median 57.8 years, minimum 23.4 years, and maximum 65.2 years), 72.6% were male, and 71.2% were married. The average yearly gross full-time income is €56,483 (this is for men €58,475 and for the women €50,220). Figure 2 projects the gross pension income from the pension fund, assuming individuals keep on working till retirement with the same occupational position (either part-time or fulltime). The projected gross yearly pension income is, on average, €25,049 over all participants (€27,578 for men and €17,834 for women). The biggest age group is that between 55 and 65 years, with 57% 45 years or older and 29% 55 years or older. Table 2 reports for the neutral subgroup and the four frames subgroups main statistics for key variables. As respondents were randomly assigned to a group respondent characteristics should be equal among groups.
(Colour online) Distribution of the projected pension income by gender.

Summary statistics overall and per frame

The sample is expected to contain a number of biases. First, male respondents are overrepresented. Since male plan members earn, on average, higher incomes, the average income among survey respondents will be higher. Additionally, there will be a bias toward individuals showing more interest in pension-related issues, as participation was voluntary. Since we use a number of control variables to address the expected biases in sample demographics, these biases should have no significant impact on the empirical results.
4.3.2 Derived variables
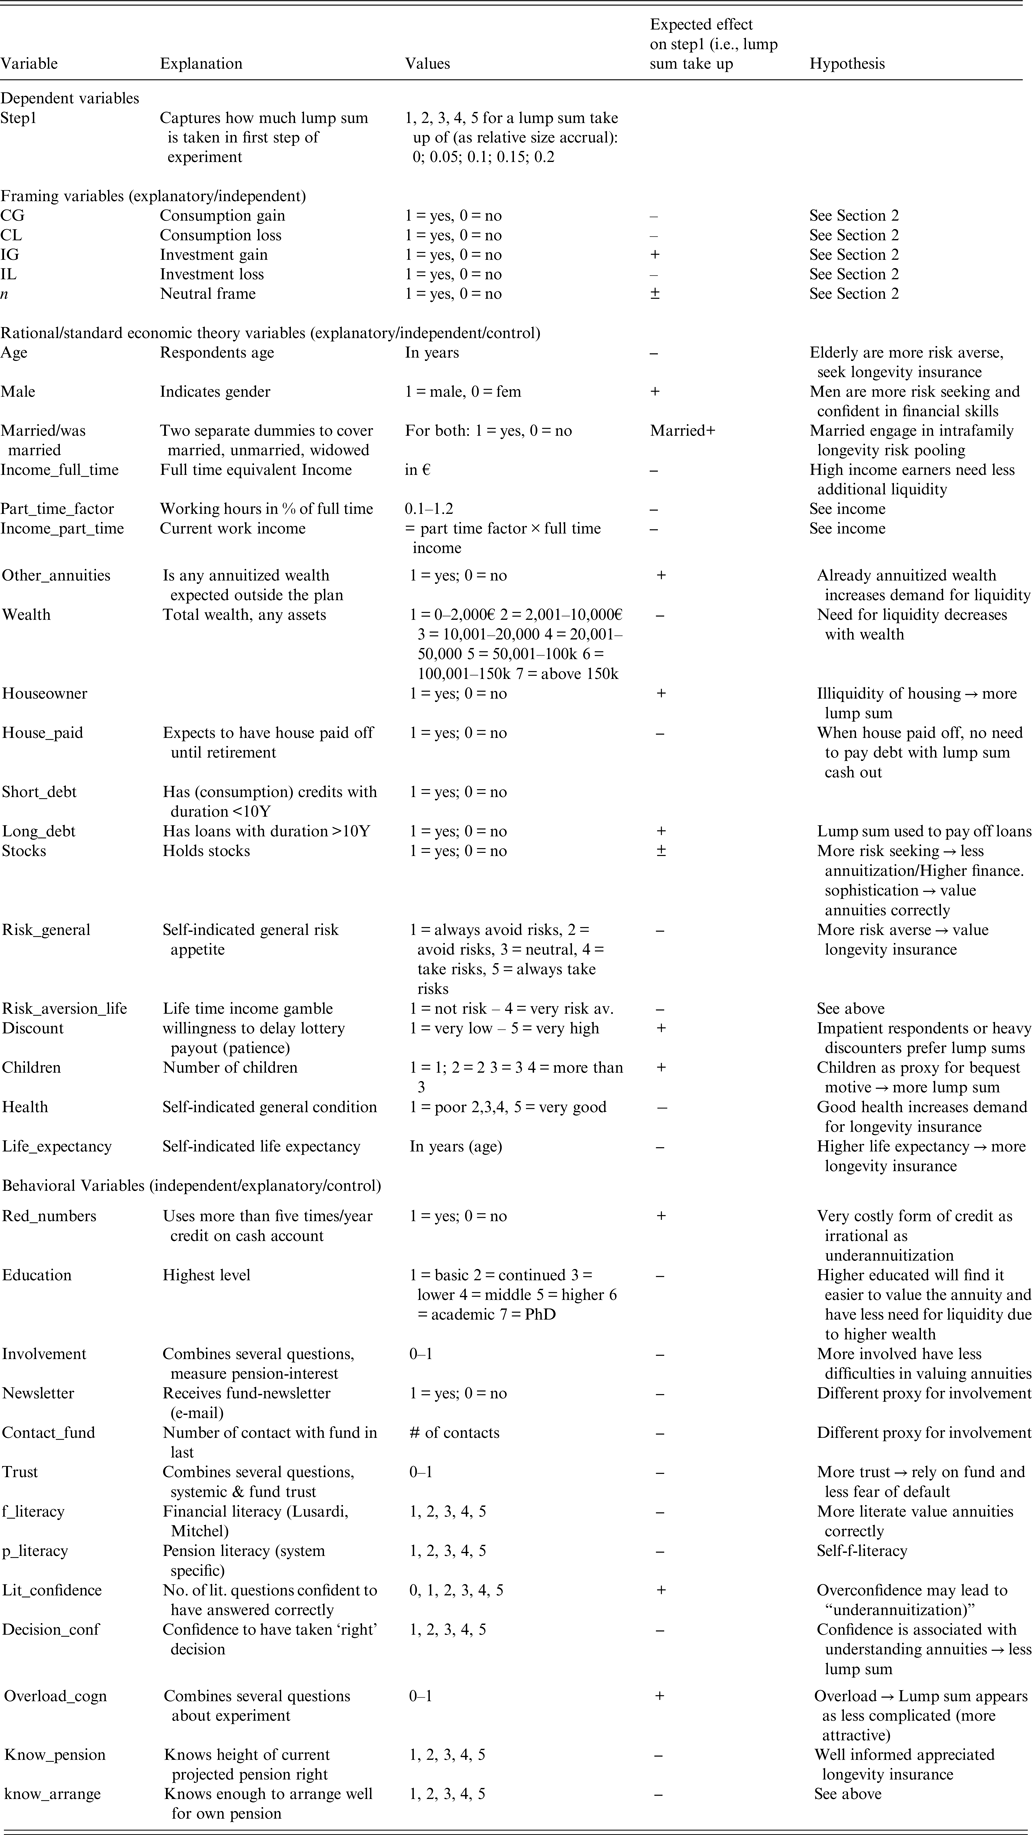
From the survey, we distinguish four types of variables: dependent variables, framing variables (independent), behavioral explanatory variables (independent/control), and rational explanatory variables (independent/control). Below, only selected variables are discussed in detail. The full list of variables is provided in Appendix B.
The lump sum take-up is the dependent variable, which captures the choices made in the first step of the experiment. The lump sum take-up can take the value of one to five referring to a take-up of, respectively, 0%, 5%, 10%, 15%, and 20% of total projected pension rights.
The framing variables are dummy variables indicating the frame in which the experiment was presented. They are used to assess the framing hypothesis in statistical testing. The following four dummies were constructed: CG, CL, IG, IL.
The rational variables are variables that could explain rationally annuity and lump sum take up preferences. These variables are used as control variables to assess the robustness of the framing hypothesis. These variables have explanatory power when defining the driving characteristics of annuities and lump sum take-ups. Appendix B presents a complete list of the variables.Footnote 8 Below we comment on two of the more complex variables:
• The risk aversion variable is measured following the survey-based approach of Barsky et al. (Reference Barsky, Juster, Kimball and Shapiro1997), in which people are subsequently offered riskier but possibly better-paying job opportunities. According to their answers to these income gamble questions, respondents have been divided into four groups.
• The variable discount measures the subjective time value of the respondents’ money. Patience in waiting for a lottery payout is employed as a proxy. The respondents are told to imagine they won a lottery that pays out in 1 year. Then they are asked how much of the prize they are willing to give up to receive the money immediately. The questions are the same as for Cappelletti et al. (Reference Cappelletti, Guazzarotti and Tommasino2013) and sort the respondents into five groups of intertemporal discounters.
The behavioral variables are designed to detect individuals showing difficulties in properly valuing annuities and are derived from the behavioral literature. Our research focuses on the framing effect as a behavioral bias. The additional behavioral variables we employ are control variables that help to assess the robustness of the framing effect and the relevance of purely rational explanations. The variables include involvement, trust, financial and pension literacy, decision confidence, education, cognitive overload from the decision problem, and regular debt on cash accounts. Appendix B contains the full list of variables with brief explanations. Below, only those variables constructed from multiple survey questions are explained in detail:
• The variable involvement ranges from zero to one and is constructed from five statements to which respondents indicated their degree of agreement on a five-point Likert scale. The questions are taken from previous internal research projects. The average score is 0.84 indicating the respondents are highly involved. Cronbach's alpha to test for the reliability of the constructed variable yields a high outcome of 0.73. The variable trust ranges from zero to one. It is derived from one question and agreement with three statements on systemic and pension fund-specific trusts, indicated on a five-point Likert scale. The average is 0.57 and Cronbach's alpha is 0.81.
• The variable cognitive overload ranges from zero to one and is constructed from agreement (on a five-point Likert scale) to four statements as brought forward by Agnew and Szykman (Reference Agnew and Szykman2010). The average equals 0.47 and Cronbach's alpha is 0.84.
• The variable pension literacy captures system-specific literacy through eight knowledge questions as previously used within the fund. They are combined into a score ranging from zero to one. The average is 0.78.
• The variable financial literacy is an application of the measure and questions developed by Lusardi and Mitchel (Reference Lusardi and Mitchel2007). It is scaled from zero to five, with an average of 4.2.Footnote 9
5 Empirical results
We first assess the lump sum take-up for the Dutch environment under a neutral frame (Section 5.1). Then we evaluate how the partial lump sum decision is steerable through framing and check for the robustness of the results (Section 5.2). Subsequently we conduct an analysis with split datasets to assess differences in responsiveness to framing in a heterogeneous sample of plan members (Section 5.3).
5.1 Hypothetical lump sum take-up in a neutral frame
This section only analyzes the acceptance by Dutch participants of the new optionality of partial lump sum payments within the neutral frame, consisting of 474 respondents.
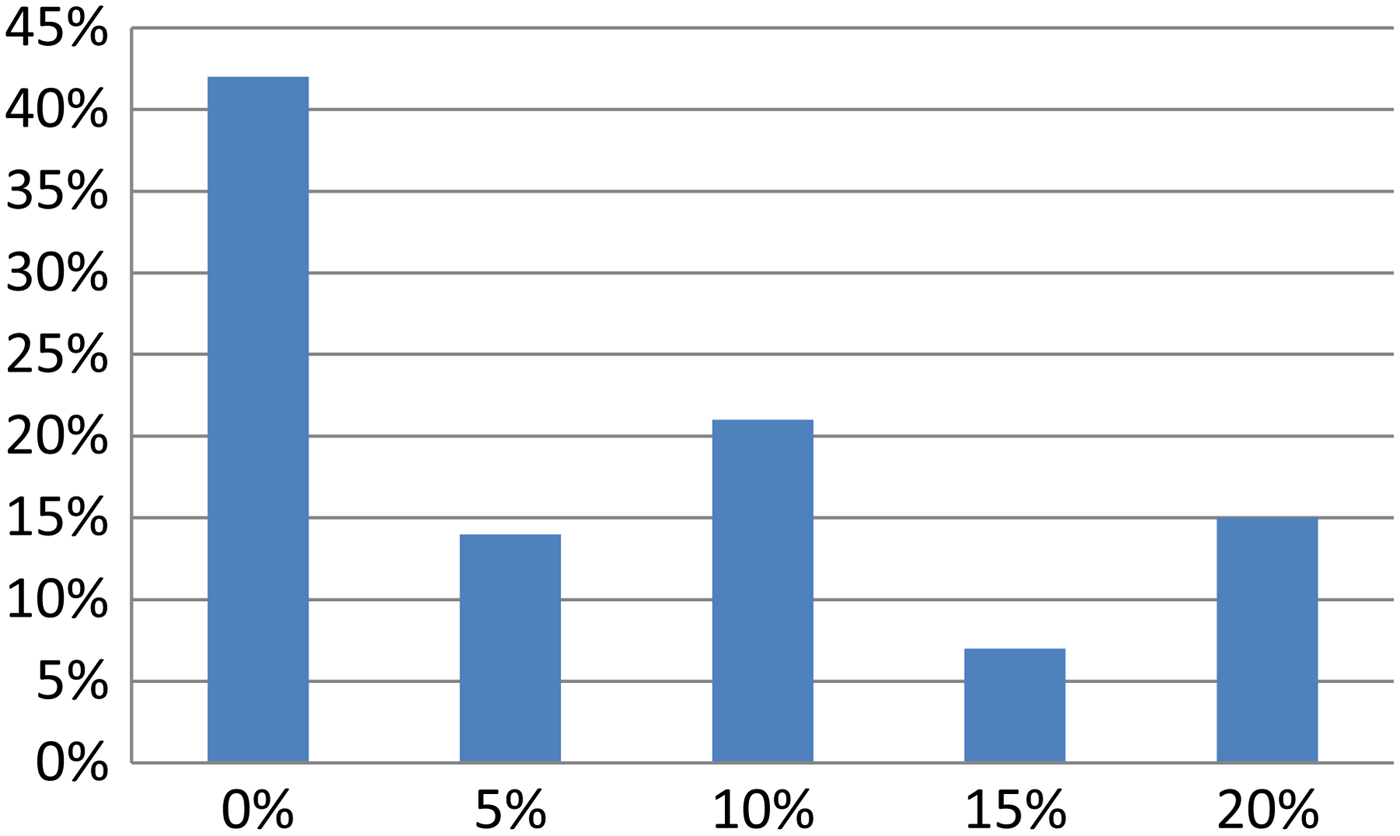
A majority of 58% of the 474 respondents in the neutral frame indicates to choose for the new optionality of a partial lump sum with an average lump sum pick-up of 12.3% (given a 20% lump sum maximum); 42% stayed with the full annuity position. Over all neutral frame respondents, the average lump sum take-up is 7.1%.
These annuitization rates are higher than the ones reported in the literature on the annuity puzzle in the USA. These higher rates can be explained by the fact that Dutch plan members are used to having their DB pensions annuitized. In the USA, Hurd and Panis (Reference Hurd and Panis2006) and Benartzi et al. (Reference Benartzi, Previtero and Thaler2011) report that US citizens in DB pension plans also choose a relatively high annuity take-up when offered a lump sum option. Furthermore, we refer to the study of Bütler and Teppa (Reference Bütler and Teppa2007), who find no annuity puzzle for Switzerland, with an average annuitization rate of 84.5%.
5.2 Steering the partial lump sum decision
This section evaluates how the partial lump sum decision is steerable through framing. The analysis proceeds in three stages: First, the differences in lump sum take-up across the different frames are described and motivated according to the predictions in Section 2. We first discuss the responsiveness to framing (Section 5.2.1). Second, standard economic as well as behavioral control variables are included in the analysis to check the robustness of the results (Section 5.2.2).
5.2.1 Impact of framing
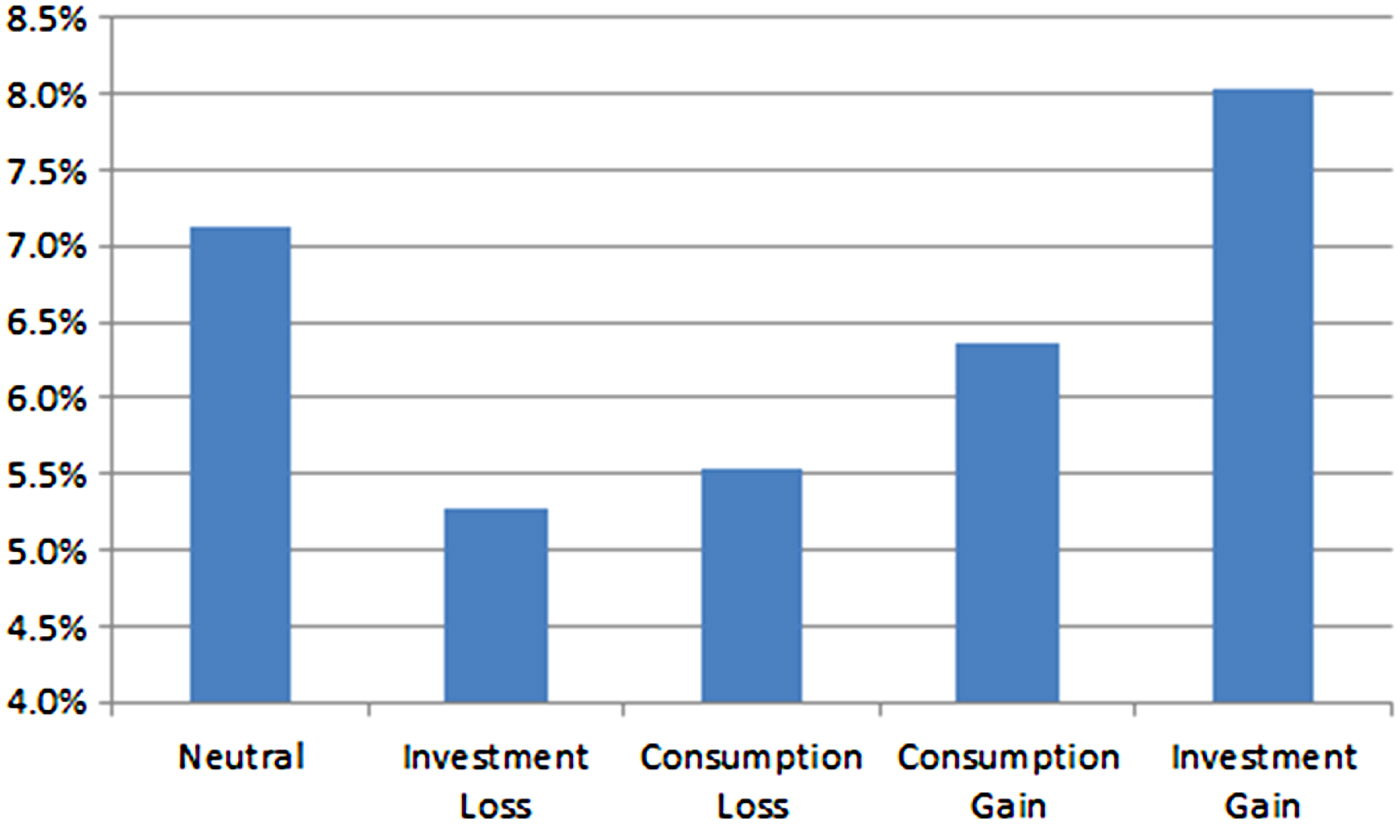
Figure 4 shows how individual choice differs (on average) across the frames for the partial lump sum decision. The effect holds for the share of those picking any partial lump sum option as well as for average annuitization rates (i.e., lump sum cash-out rates). The lowest average take-up is for the IL frame, that is 5.2%, and the highest is for the IG frame, at a little over 8%.
(Colour online) Chosen lump sum options in neutral frame.Footnote 10

(Colour online) Average lump sum pick-up by frames.

Furthermore, we make the important observation from Figure 4 that the differences between the frames are exactly in line with the predictions implied by the framing hypothesis. In Section 2 we explained how preferences are expected to change across the different frames. These mechanisms indeed can be observed in the data. Explaining the choice option with a loss example (less annuities) will lead to a lower preferred lump sum take-up compared with the take-up in the gain example (more annuities). Compared with the neutral frame, consumption framing evokes higher preference for annuities whereas investment framing stimulates a higher lump sum take-up. The combination of the investment and consumption frames with the loss and gain examples leads to interaction effects. Gains are welcomed generally, activating a risk-averse attitude. Comparing the two ‘gain-frames’, we observe that risk-averse behavior in the IG-frame leads to additional lump sum take-up. People avoid the risk of forgoing annuity payments from a short life and prefer the ‘safe’ cash in hand. In contrast CG-framed individuals are induced to increase their annuity position. Those people avoid the risk of outliving their savings with a lump sum and prefer safe retirement income streams. Losses activate risk-seeking behavior, implying an increase of the lump sum take-up in the CL-frame, but a lower preferred lump sum in the IL-frame.
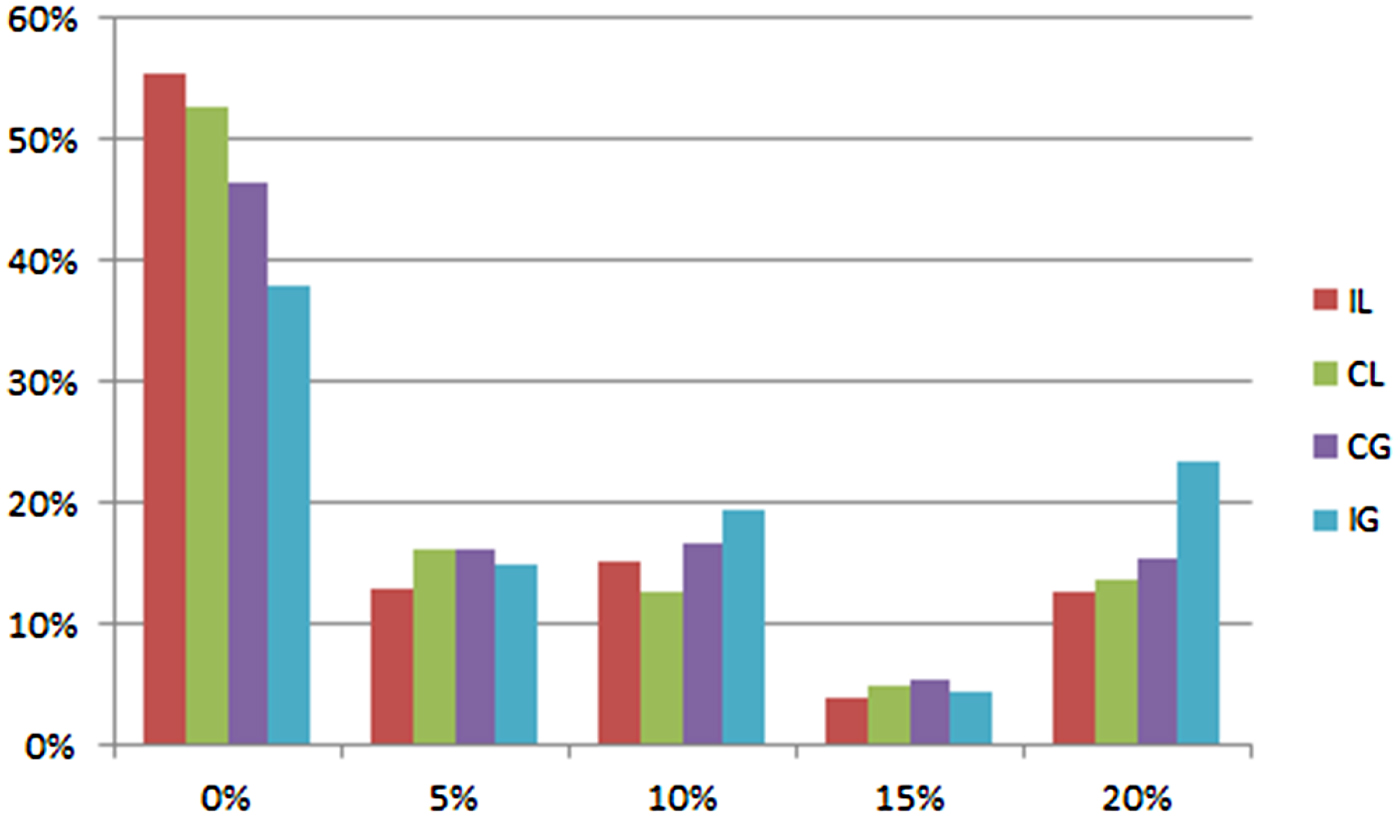
Figure 5 below reflects the preferences for the five options per frame. The two corner options, i.e., the no lump sum option (0%) and the maximum partial lump sum (20%), have an opposite ordering of the frames.
(Colour online) Chosen lump sum per frames.

So, framing does matter in the annuity decisions of individuals and does so predictably, in line with insights from behavioral economics. It should be recognized that the application of framing has been rather restricted. We simply adapted words and examples and the lump sum take up is limited to a maximum of 20%. Beshears et al. (Reference Beshears, Choi, Laibson, Madrian and Zeldes2014) also allow individuals to choose from five options in the annuity – lump sum domain, consisting of the two corners full annuitization and full lump sum and three in-between options (75%–25%, 50%–50%, 25%–75%). The effect of investment framing is a 4.8% higher preference for full lump sum and a 6%-point lower annuity demand overall, compared with their basic variant without explicit framing. These effects are in line with our findings. Given the maximum of only 20% lump sum take up, the investment gain frame leads to a 0.9%-point higher lump sum demand and so a lower annuity demand of equal size, whereas the IL frame implies a 1.9%-point higher annuity demand (cf. Figure 4). Hence we may expect larger deviations from the neutral group and across the frames when we would allow for a higher maximum lump sum take-up and/or for a more pronounced framing.
5.2.2 Robustness of the framing effects
This section checks for the robustness of the above results using multiple regression analysis. We assess both the statistical significance of framing effects as well as its robustness to the inclusion of other explanatory variables and their relative importance vis-à-vis the frames. We apply different specifications of regression analysis. In each regression, a choice variable is explained by framing variables (dummies for each frame), as well as rational and behavioral control variables:
 $${\rm decumulation}\;{\rm choice}_i = {\rm frame}_i \beta _{{\rm frame}} + {\rm econ}_i \beta _{{\rm econ}} + {\rm behave}_i \beta _{{\rm beghave}} + u_i $$
with i indexing observations, and where, for each i, frame is a 1 × k vector of all frame dummies and f rame is the k × 1 vector of all frame parameters. The same vectors are defined for all standard economic variables (econ) as well as behavioral variables (behave). U denotes the residuals (error term). Variables whose scales do not allow for a meaningful economic interpretation are standardized such that their means are zero, with a standard deviation of one. We report a minimal specification with only the framing variables, one specification controlling for (rational) economic factors, another controlling only for behavioral variables, and a combined specification putting together rational and behavioral controls. We use ordered probit model specifications for the regressions. In terms of model fit and normality of the error term, the maximum likelihood estimated ordered probit model has proven to do much better than a standard OLS model and is the preferred one. In a similar context, this model also has been applied by Cappelletti et al. (Reference Cappelletti, Guazzarotti and Tommasino2013).
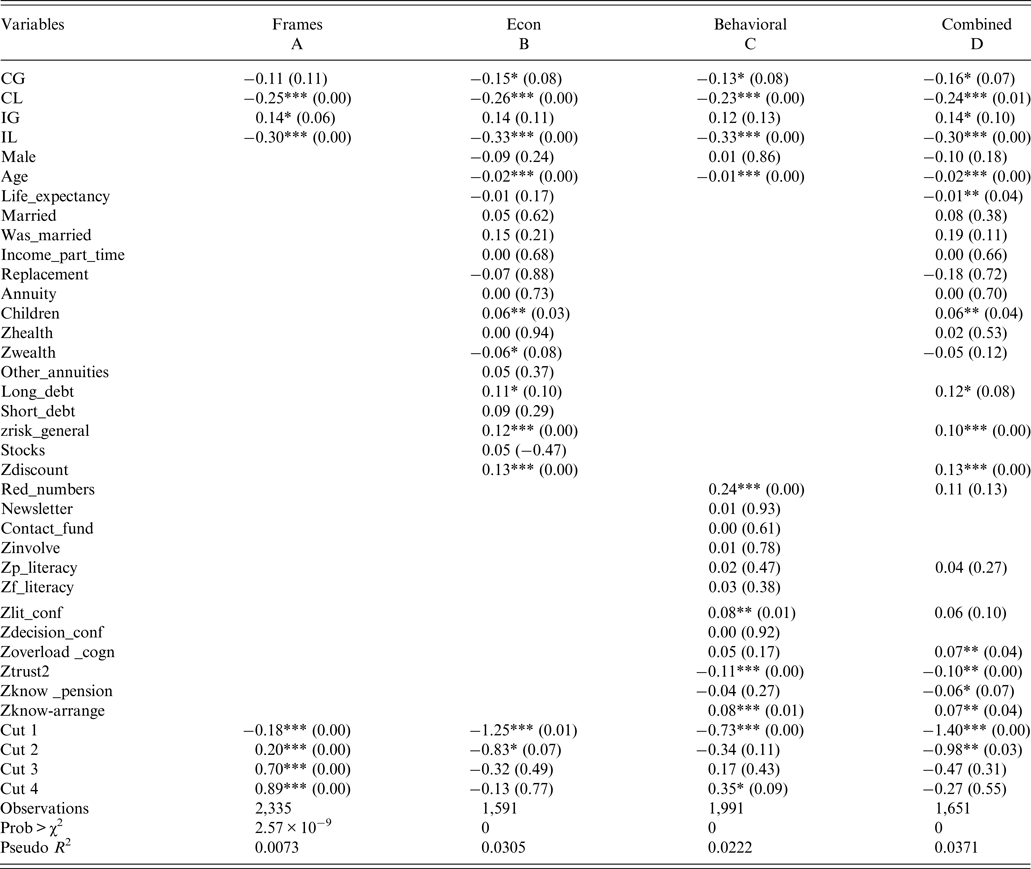
Table 3 shows four ordered probit regressions of the choice made in the first step (partial lump sum) on different sets of explanatory and control variables. The variable to be explained is the choice for one of the five lump sum options in the first step of the experiment. These options range from one to five (five means more lump sum than four).
Ordered probit regressions explaining the lump sum

Robust p-values in parentheses.
***p < 0.01, **p < 0.05, *p < 0.10.
Dependent variable: step 1 lump choice option (1–5); ordered probit.
Generally, the earlier reported evidence (see Figure 4) is confirmed by the regression analysis. Column A reports the regression results with only the frame dummies. Three of the four frames nudge significantly towards more or less annuity preferences in line with predictions, the CG frame does not but the impact has the expected direction.
We first control for the effects of standard economic variables on the variation in annuitization behavior. Specification B (Econ) in Table 3 adds a standard set of variables relevant to a lifetime utility-maximizing agent. Much in line with the literature expanding the life-cycle model, the applied proxy for bequest motives (children) is positively related to partial lump sum payments. Furthermore, people trade off their wealth and debt positions against their annuitization rates. Higher wealth is associated with a lower lump sum take-up. Those holding long-term debt (more than 10 years) annuitize less, presumably to pay off loans and save on interest payments. Higher risk tolerance is associated with greater lump sum take-up.
The specification also includes two variables on the verge of behavioral explanations: first, age, which has a highly significant negative relation with lump sum take-up (in all specifications). Hyperbolic discounting implies that older individuals are more tempted by receiving the lump sum sooner than younger ones, who feel less pressure from postponing income to a more distant future. Apparently, this is not the case. Instead, older people appreciate annuities more than younger people do. One explanation could be an increasing reluctance to exchange one's accrued benefits (note that this is in terms of annuities in the Netherlands) for a lump sum. Similarly, the elderly could be more prone to inertia and not as keen to make an active choice in retirement planning as younger generations, who feel more connected to recent trends toward greater individual freedom of choice. Thus, it will be interesting to see how this age coefficient evolves over time for the Dutch case as older cohorts, which are more DB focused, exit the sample.
The second variable on the verge of behavioral economics is intertemporal discounting, approximated by patience for lottery payouts. The findings indicate intertemporal discounting is highly significant and positively related to lump sum pick-up.
The next specification in Table 3 (C, Behavior) controls for characteristics capturing why and how people make mistakes in valuing annuities and hence make irrational (non–utility-maximizing) choices. Surprisingly, there is no significant effect on choice behavior stemming from variables related to involvement or financial sophistication (newsletter, contact_fund, involve, p_literacy, f_literacy). What is significant, though, is the positive relation between self-perceived financial literacy (zlit_conf) and lump sum take-up. Similarly, there is a significant positive relation between self-indicated ability to arrange for one's pension (know_arrange) and lump sum take-up. From a social planner's perspective, this is an important insight. It is not actual sophistication that drives active decision making about lump sum take-up but, rather, self-perceived sophistication. Another highly significant variable is trust. Respondents showing greater trust in the fund as well as in the Dutch pension system tend to take up less lump sum. This finding highlights how much impact fund communications and behavior toward plan members can have on pension-related decisions via the perceived trustworthiness of the fund.Footnote 11
The combined specification (column D in Table 3) provides the strongest result and mostly confirms the above findings. Now all four frames have a significant impact on the partial lump sum decision. Interestingly, cognitive overload has become significant as well. It is rather worrying, though, that higher cognitive overload is associated with greater lump sum take-up, given that taking up lump sums and using the money wisely requires greater financial sophistication than simply living off a monthly paid annuity.
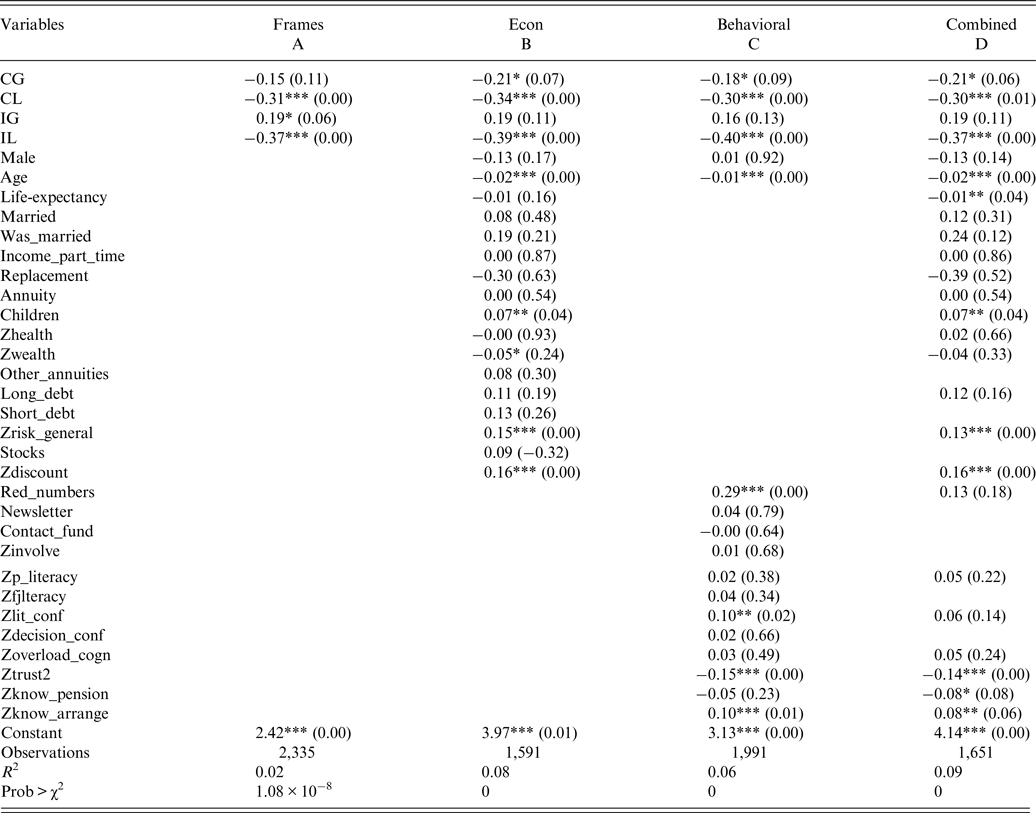
We also estimated a linear model using a standard OLS model by assigning quantitative meanings to the five options (0%, 5%, 10%, 15%, and 20% of accruals), compare Appendix A for the results. The regression results are mostly in line with the evidence derived from the ordered probit models above. The significance as well as direction of effects is the same for most variables. Only the investment gain frame is no longer significant in specification D. The same applies to cognitive overload.
5.2.3 Conclusions
The above analysis provides strong evidence for the general validity of the framing hypothesis.Footnote 12 All observed effects are in line with theoretical predictions. Most importantly, it is evident that annuitization behavior is subject to framing and that active framing can have a significant impact on overall annuitization rates. For the underlying sample, framing outstrips all other variables in terms of robustness and explanatory power. Many of the variables that capture difficulties in properly valuing annuities are associated with a higher demand for lump sum payments. This result highlights the behavioral nature of the underlying decision problem and the scope for welfare protection through professional intervention.Footnote 13
5.3 Heterogeneity
When considering framing as a tool of information architecture that can be applied to actively steer individual decision making, predictions must be made of how framing interacts with heterogeneity. Hence, the last phase in assessing the framing hypothesis is to determine how the frames act in case of splitting the group with other variables. This is done by running the previous regression models on split datasets.
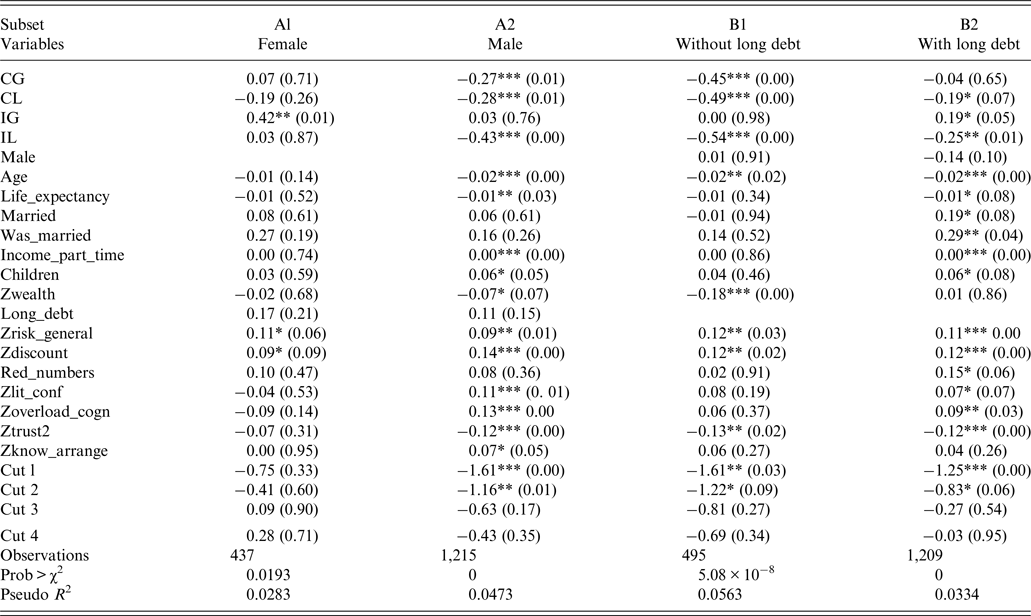
A similar assessment of framing in the Dutch environment has been conducted by van der Heijden et al. (Reference Van der Heijden, Klein, Müller and Potters2012). They find that only impatience interacts significantly with framing. This finding is not supported by the evidence from our experiment. The two variables that significantly interact with the frames are discussed in more detail below: Gender and Debt. Table 4 presents the results for female and male and respectively for individuals with and without long debt positions.
5.3.1 Gender
Agnew et al. (Reference Agnew, Anderson, Gerlach and Szykman2008) find men to be more affected by framing than women. In particular, men are more likely to annuitize after they have seen an annuity-biased slideshow, while this had no effect on women. After an investment-biased slideshow, both genders annuitized less, with women showing a stronger reaction. In a way, this type of experiment is similar to our research.
The results in columns A1 and A2 of Table 4 indeed may be seen as confirming the findings of Agnew et al. (Reference Agnew, Anderson, Gerlach and Szykman2008). The effects of the two consumption frames for men are strong and highly significant, whereas women undergo no significant impact. Both genders react also differently to the two investment frames. Men undergo no impact of the IG frame, but react strongly to the IL frame. For women only the IG frame has a significant impact for higher lump sum choice, which would be in line with the work of Agnew et al. (Reference Agnew, Anderson, Gerlach and Szykman2008). Apparently, women show a stronger aversion to risk and would rather take a lump sum in that case in line with the expected outcome for the IG frame as described in Section 2, in particular Figure 1. So it is not the case that men are generally more responsive than women or vice versa. What can be said instead is that men and women are responsive to different frames.
Ordered probit regressions explaining the lump sum choice for selected split datasets

Robust p-values in parentheses.
***p < 0.01, **p < 0.05, *p < 0.10.
Dependent variable: step 1 lump choice option (1–5); ordered probit.
Hence, the finding of Agnew et al. (Reference Agnew, Anderson, Gerlach and Szykman2008) of men being more sensitive to framing is confirmed for the CG, CL, and IL frames but rejected for the IG frame, which in turn appears to have a strong and significant impact on women. The evidence provided does not support the hypothesis of gender playing a role in framing per se.
5.3.2 Debt
From an economic point of view, it is utility maximizing to pay off loans by cashing out pension assets to save on interest payments (presupposing that the interest on loans is higher than the return on pension assets). Hence, loss of welfare will arise if framing discourages debt holders from doing so. We split the group into individuals without and with long-term debt. The reported evidence in Table 4, columns B1 and B2, indicates that framing appears to be very effective in steering the no debt holders, while the effectiveness is far less for the long debt holders. It seems that, if there is a solid economic rationale behind the decision to cash out pension assets, it is more difficult to distort that decision. Framing is less effective when it interferes with stable preferences derived from individual economic considerations.
5.3.3 Final
The analysis based on the split datasets has added one important insight to the framing hypothesis: its validity depends significantly on the characteristics of the underlying population. This result has important implications for pension professionals. Given that individuals are steered actively into predictable directions, understanding the role of population's heterogeneity is imperative.
6 ‘Reversed’ annuity puzzle
The predictions of the life-cycle model often indicate higher annuity recommendations than the observed annuitization rates in real markets. Many authors have tried to solve this so-called annuity puzzle by either expanding the life-cycle model or researching the human limitations to properly valuing annuities. These studies all acknowledge the annuity puzzle as a general phenomenon. Our experiment among Dutch pension fund participants finds limited preference for utilizing the new optionality of partial lump sum take-up at retirement, even though the minimum annuitization rate was kept at a high level of 80%. This evidence supports earlier findings of the phenomenon being rather circumstantial than generally valid. However, the question then remains why that is. Do the Dutch not make the same mistakes in valuing annuities as, for instance, members of 401(k) plans in the USA? Or do they simply make different mistakes and is the decision to annuitize indeed always subject to human biases? Brown et al. (Reference Brown, Kling, Mullainathan and Wrobel2008), Benartzi et al. (Reference Benartzi, Previtero and Thaler2011) argue that pension accrual in lump sums fosters investment framing, while accrual in annuities promotes consumption framing. With the latter being the case in the Netherlands, it is very likely that the high annuitization rates observed in our experiment result from Dutch plan members filtering the decision through a consumption frame, leading to what we call the ‘reversed’ annuitization puzzle, i.e., a higher annuity demand than would be justified from an economic point of view.
7 Conclusion
This paper presents results of testing the framing hypothesis in a pension system outside the USA. The institutional environment of the Netherlands is particularly relevant, as pension plan participants are used to full annuitization. The experiment is organized around the possible introduction of the choice option at retirement to allocate their accrued pension between a life annuity and a partial lump sum. The experimental setting is realistic as the choice menu is based on the respondents’ actual projected pension accrual and on their own pension plans.
Dutch plan members generally appear to welcome the partial lump sum option over full annuitization. However the average lump sum take-up is quite modest when one recognizes the Netherlands is an over-annuitized country. It is plausible that the specific institutional environment of a country plays a key role in how individuals appreciate annuities.
We find strong evidence of joint effects of combining investment and consumption frames with gain and loss frames. These sensitivities may be used for professional intervention steering individual decision-making in pension choices into an expert-based direction. The experiment also clarifies that framing does not always have an effect. For some plan, members framing effect is less evident or not present at all, in particular long-debt holders. We also found that framing may differ for men and women. Before implementing active framing, further research is needed to improve the tuning of interventions to individuals’ variety in proneness to framing.
Our overall conclusion is therefore that annuity demand generally depends significantly on framing effects. The effect framing has, however, depends on the institutional environment, which predefines the perspective through which individuals filter annuities. Future research, based on studies across countries with varied pension plan diversity, is needed to capture the country-specific component in annuity demand.
Appendix A
Standard OLS regressions explaining the partial lump sum choice

Appendix B – Definitions of variables in survey

Appendix C – Questionnaire
The questionnaire is available on request (eduard.ponds@apg.nl).