Implications
Pre-weaning piglet mortality is mainly due to an energy deficit. As colostrum is the piglets’ main source of energy, improving colostrum yield (CY) has economical and ethical benefits. Throughout gestation, changes in body’s reserves have to be closely monitored, because of their association with nutrient partitioning in the sow and CY. As CY is vital to sustain piglet performance, evaluating the management measures in order to modulate back fat changes in late gestating sows is therefore recommended.
Introduction
The two principal functions of colostrum are delivering energy and passive maternal immunity to the piglet (Rooke and Bland, Reference Rooke and Bland2002; Le Dividich et al., Reference Le Dividich, Rooke and Herpin2005). The piglets’ energy reserves at birth can provide about 420 kJ/kg birth weight (BWB): this hardly exceeds half of the amount of energy a newborn piglet needs under thermoneutral conditions (Noblet et al., Reference Noblet, Dourmad, Etienne and Le Dividich1997; Le Dividich et al., Reference Le Dividich, Rooke and Herpin2005). The additional energy needed to maintain a constant body temperature and for weight gain must be supplied through colostrum intake (CI). Furthermore, the piglets depend entirely on colostrum in order to obtain passive maternal immunity because the epitheliochorial type of placenta disables its prenatal delivery (Rooke and Bland, Reference Rooke and Bland2002; Salmon et al., Reference Salmon, Berri, Gerdts and Meurens2009). Le Dividich et al. (Reference Le Dividich, Rooke and Herpin2005) stated that the piglet needs to consume at least 160 g colostrum/kg BWB.
Pre-weaning mortality ranges between 10% and 13% in the main pig-breeding countries (Edwards, Reference Edwards2002) and piglets usually die during the first 3 days after birth (Le Dividich et al., Reference Le Dividich, Rooke and Herpin2005). Inadequate CI by the piglet is a major direct and subjacent cause of mortality during the first days after birth mainly due to hypothermia and hypoglycaemia (Le Dividich et al., Reference Le Dividich, Rooke and Herpin2005). In addition, insufficient intake of maternally derived immunoglobulins will have a negative effect on the piglets’ health status, thus weight gain and survival, at later stages in life (Rooke and Bland, Reference Rooke and Bland2002; Le Dividich et al., Reference Le Dividich, Rooke and Herpin2005).
Previous studies have shown that the total colostrum yield (CY) per sow is 3.4 kg on average, but varies largely among sows (Devillers et al., Reference Devillers, Farmer, Le Dividich and Prunier2007; Foisnet et al., Reference Foisnet, Farmer, David and Quesnel2010). This variation can be attributed to environmental-related factors, the piglet’s and the sow’s characteristics (Devillers et al., Reference Devillers, Farmer, Le Dividich and Prunier2007; Farmer and Quesnel, Reference Farmer and Quesnel2009; Quesnel, Reference Quesnel2011). The litter size was not correlated with total CY (Devillers et al., Reference Devillers, Farmer, Le Dividich and Prunier2007) and the CI with bottle-fed piglets rendered twice as much CI compared with sow-reared piglets (Le Dividich et al., Reference Le Dividich, Herpin, Paul and Strullu1997), which indicates that the total CY is the major limiting factor for the CI. In general, there is insufficient information available to thoroughly understand how CY can be increased in sows. It is well established that the optimal availability of energy and protein is central in maximising the intrinsic capacity of the sow’s milk production (Boyd et al., Reference Boyd, Kensinger, Harrell and Bauman1995). Foisnet et al. (Reference Foisnet, Farmer, David and Quesnel2010) suggested that sow’s peripartal hormonal changes, its insulin sensitivity and the availability of glucose might play an important role in the total CY.
According to our knowledge, studies investigating the partitioning of nutrients in relation to CY are scarce and the association with the sow’s body condition has never been described. Therefore, the aim of this study is to identify associations between the changes in energy stores and the nutrient metabolism in late gestating sows and CY.
Material and methods
Description of study population
The experiment was performed during the months of April and May 2011 at a commercial farm in Flanders with 1700 PIC (Pig Improvement Company) sows in a 2-week batch system. Thirty-seven sows of different parities (1 to 7), equally divided over 2-week groups, were observed from D85 of gestation until D3 of lactation. The day of first insemination was defined as D0 of gestation, and the day of parturition as the last day of gestation and D0 of lactation.
From D29 until D107 of gestation, the sows were housed in a group housing system with 15 animals per pen. On D108 of gestation, the sows were moved to the farrowing unit where they were housed individually in conventional farrowing crates until weaning. Floor heating and an IR lamp were used to create a microclimate for the piglets.
Between D85 and D107 of gestation, the gestation diet (pellets) was provided by two feeders per pen that dropped a small amount of feed at regular intervals throughout the day at an average level of 2.2 kg/sow per day. In the farrowing unit, the sows were manually fed a transition diet (meal) once a day, until D1 or 2 after farrowing. When a sow had not finished the meal of the previous day, the trough was emptied and a smaller amount of fresh feed was given. Starting from D2 or 3 of lactation, the sows received a lactation diet (meal) four times a day. Average±s.e.m. feed intake (kg) 6, 5, 4, 3, 2, 1 days before parturition, at day of parturition and 1, 2, 3 days after parturition was 2.0±0.0, 1.9±0.1, 1.8±0.01, 1.8±0.01, 1.9±0.01, 1.9±0.01, 1.7±0.1, 1.8±0.1, 3.7±0.3, 4.9±0.2, respectively. During the entire experiment, the sows had free access to fresh drinking water (drinking nipple – flow 1.5 to 2 l/min).
The induction of parturition was not applied, and farrowing intervention was kept to a minimum. When the birth interval between two piglets exceeded one hour, manual extraction was performed. Oxytocin was not administered during parturition, as this interferes with mammary secretion (Ellendorf et al., Reference Ellendorf, Forsling and Poulain1982). No additional help or care was given to the piglets unless there was a risk of them getting crushed.
On D2 of lactation, the litters were standardised to 11±1 piglet by cross-fostering within the observed group of sows or to non-observed sows when too many piglets were present.
Measurements
All the measurements of back fat thickness (BF) were performed by the same person on standing sows at the P2-position (Maes et al., Reference Maes, Janssens, Delputte, Lammertyn and de Kruif2004) after hair removal using a digital BF indicator (Renco Lean Meter, S.E.C. Repro Inc., Ange-Gardien-de-Rouville, Québec, Canada) at D85, D109 and D111 of gestation, and at D1 of lactation. The BF was always measured at the same, marked spot on both sides of the sow. Values from the two measurements were averaged to obtain a single BF measurement. Devillers et al. (Reference Devillers, Le Dividich and Prunier2006) described that the secretory activity of the mammary gland starts at D85 of gestation. In this study, D109 of gestation was the first whole day that sows were housed in the farrowing unit. Therefore, we calculated the change in BF between D85 and D109 of gestation (ΔBF D85-D109, mm) as BF D109 minus BF D85, and the change in back fat between D109 of gestation and D1 of lactation (ΔBF D109-D1, mm) as BF D1 minus BF D109. The change in back fat should be interpreted as follows: a negative value represents back fat loss or back fat mobilisation; a positive value represents back fat gain or back fat deposition.
The rectal body temperature (digital thermometer, accuracy 0.1°C) was recorded between 04.30 and 05.00am the day before, of and the day after farrowing to monitor health status. Parity, gestation length, number of liveborn and stillborn piglets, and parturition length were recorded for every sow. Feed intake was recorded daily from D111 of gestation until D3 of lactation for every sow. The sow’s CY was calculated as the sum of the CI by each piglet within a litter.
The piglets’ CI (g) was estimated by a regression equation as described by Devillers et al. (Reference Devillers, van Milgen, Prunier and Le Dividich2004), based on BWB, weight at 17 to 24 h of age (further referred to as weight at 24 h of age, BW24), duration of CI (t with 17 h≤t≤25 h), and time between birth and first suckling (t FS). The equation is the following:
 $$\eqalignno{ {\rm CI}= \,& {\minus}{\rm 217}.{\rm 4}{\plus}0.{\rm 217}{\times}t{\plus}{\rm 1861}0{\rm 19}{\times}{\rm BW}_{{{\rm 24}}} /t{\plus}{\rm BW}_{\rm B} \cr & {\times}\left( {{\rm 54}.{\rm 8}0-{\rm 1861}0{\rm 19}/t} \right){\times}\left( {0.{\rm 9985}-{\rm 3}.{\rm 7 }{\times}{\rm 1}0^{{{\minus}{\rm 4}}} }\right \cr {\times}t_{{\rm FS}} {\plus}{\rm 6}.{\rm 1}{\times}{\rm 1}0^{{{\minus}{\rm 7}}} {\times}t^{2} _{{\rm FS}} } \right) $$
The detailed handling of piglets at birth was as follows: when a piglet was born, the back of the piglet was dried with a paper towel, a number was written on the back with a marker and the piglet was ear-tagged allowing identification. The umbilical cord was shortened when it was longer than ∼15 cm. After weighing, they were placed against the sow’s vulva again with their nose. The accuracy of the scale was 0.02 kg and the birth interval was recorded for every piglet.
Samples
Feed samples were taken from the silos at the end of the study.
Serum (8 ml, serum cloth activator tubes) of the sows was collected by punction of the vena jugularis while they were restrained by a snare. The sampling was done before the morning meal after an overnight fasting period of 20 h. As colostrum is mainly produced the week prior to farrowing (Devillers et al., Reference Devillers, Le Dividich and Prunier2006), we collected serum each other day during that week. In this way, we obtained serum from every sow 3 to 4 days before farrowing and only these were further analysed. We also collected and analysed serum samples of the sows at D1 of lactation. The blood samples were stored in iced water, subsequently centrifuged at 671×g for 10 min and serum was stored frozen at −20°C until further analysis. The serum was analysed for urea, creatinine, non-esterified fatty acids (NEFA), (iso)butyrylcarnitine (C4), immunoglobulin G (IgG) and immunoglobulin A (IgA).
The colostrum (35 ml) was collected at 3, 6 and 24 h after birth of the first piglet, equally divided from all teats on one side of the udder. Except for the sample at 3 h, 2 ml of oxytocin (10 IU/ml) was administered intramuscularly 5 min before sampling. At the time of the sample collection at 6 h, six sows did not complete the farrowing and they were also given an injection of 2 ml of oxytocin. The samples were subdivided and frozen immediately at −20°C and stored until further analysis. Each colostrum sample was analysed for its chemical composition, IgG and IgA.
Analyses of samples
Feed
The nutritional composition of the diets were analysed according to the Association of Official Analytical Chemists methods (Thiex, Reference Thiex2002) (ISO 5983-1, 2005; ISO 1443, 1973; ISO 5498, 1981). The gestation diet contained 90.6% dry matter (DM), 3.9% of crude fat (CF), 13.5% of CP, 4.7% of crude ash (CA) and 9.6% of crude fibre (CFib). The transition diet contained 88.7% DM, 3.5% CF, 13.6% CP, 6.2% CA and 8.5% CFib. The lactation diet contained 89.7% DM, 5.2% CF, 18.2% CP, 5.3% CA and 4.3% CFib.
Serum
Creatinine, urea and NEFA were measured spectrophotometrically (Ultrospec IIE, LKB, Biochrom, Cambridge, England) using a commercial colorimetric diagnostic kit (Randox Laboratories, Crumlin, UK). A quantitative electrospray tandem mass spectrometry was used to determine C4 as described by Vreken et al. (Reference Vreken, van Lint, Bootsma, Overmars, Wanders and van Gennip1999). (Iso)butyrylcarnitine is a catabolite of amino acids that can be metabolised to oxaloacetate, which is needed to react with acetyl CoA when entering the citric acid cycle (Michal, Reference Michal1999a and Reference Michal1999b). As serum samples were obtained after an overnight fasting of 20 h, we can assume that C4 mainly reflects a catabolism of body protein. Immunoglobulins G and A were analysed by a porcine quantitative sandwich enzyme immunoassay technique (Bethyl Laboratories Inc., Montgomery, USA). All samples were analysed in duplicate.
Colostrum
The DM, fat, protein and lactose content were analysed by Lactoscope FTIR Advanced type FTA-3.0 (Delta Instruments, Drachten, the Netherlands). The samples were diluted 1:2 with distilled water and calibrated curves were verified with Gerber and Kjeldahl analysis. These analyses were not done in duplicate because of the high amount of sample needed for one analysis.
Immunoglobulins G and A were analysed by a porcine quantitative sandwich enzyme immunoassay technique (Bethyl Laboratories Inc., Montgomery, Texas, USA) in duplicate and in the same array, in order to avoid inter-array variation.
Statistics
The data is reported as LSMean±standard deviation or median±interquartile range when variables were normally or not normally distributed, unless mentioned otherwise. The Kolmogorov–Smirnov test was used to analyse whether variables were normally distributed. The correlation analysis was performed using Pearson or Spearman Rank correlation analysis when variables were distributed normal or not normal. Sows were divided into two groups based on parity: parities 1 to 3 (n=18) and parities 4 to 7 (n=19). In order to analyse whether the variables differed between groups, we used an independent samples t-test or a Kruskall–Wallis analysis when variables were hence normally or not normally distributed.
In order to analyse which variables were associated with CY, multivariable regression analysis was performed using forward modelling. The statistical model is
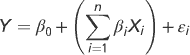 $$Y=\beta _{0} {\plus}\left( {\mathop \sum\limits_{i=1}^n \beta _{i} X_{i} } \right){\plus} {\varepsilon}_{i} $$
with Y as the dependent variable, β 0 as a constant value, β i as slope coefficients, X i as the independent variable and ε i as the random error term. The dependent variable was CY for each model. The independent variables and their slope coefficients are shown in the regression equations. For each regression model, the normality and homogeneity of variance, outliers and their influence and multicollinearity were tested through residual analysis, leverage, studentised deleted residuals, Cook’s distance, DFFITS, DFBETAS, variance inflation factor and tolerance. When needed, variables were transformed and reported as such.
The overtime change of the colostrum composition was analysed by repeated measures ANOVA for normally distributed data and by Friedmann’s two-way ANOVA for not normally distributed data.
All statistical analyses were performed using SPSS 19.0 (IBM Company Headquarters, Chicago, Illinois, USA), considering statistical significance when P<0.05.
Results
Production parameters
The range is marked between brackets. The parity was 3.8±2.1 (1 to 7), the gestation length was 114.6±1.7 days (112 to 117), the farrowing duration was 234±117 min (53 to 591) and the litter size was 14.6±2.4 (10 to 20). The number of liveborn piglets was 13.5±2.2 (10 to 18), the number of stillborn piglets was 1.0±2.0 (0 to 5), with a total litter BWB of 19.0±2.8 kg (13.3 to 24.3). The day before farrowing the sow’s rectal body temperature was 38.1±0.4°C (37.3 to 39.0), on the day of farrowing it was 38.2±0.5°C (37.1 to 39.0) and the day after farrowing it was 38.9±0.4°C (38.0 to 39.7). For the individual piglets, the birth interval was 8.0±14.0 min (0 to 108) and t FS was 20.0±31.0 min (4 to 207), the BWB was 1305±338 g (400 to 2380), their BW24 was 1393±348 g (480 to 2420), their weight gain during the first 24 h was 60±100 g (−230 to 300). The BWB of the liveborn piglets (P=0.204) and t FS (P=0.441) did not differ between piglets born before D114 of gestation or the ones born after.
Feed intake and back fat of the sows
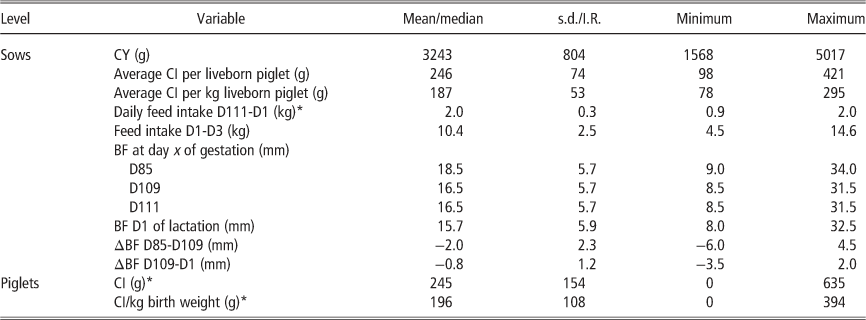
Data considering feed intake, BF and ΔBF are shown in Table 1. Colostrum yield was not correlated to the feed intake between D111 of gestation and farrowing (r=−0.07, P=0.666), and during the first 3 days of lactation (r=−0.03, P=0.874). We observed a back fat loss in 30 sows between D85-D109 and in 27 sows between D109-D1. Changes in BF during both periods did not correlate with the BF level at the beginning of the respective period (−0.02<r<0.3, P>0.05).
CY, feed intake, BF of sows (n=37) and colostrum intake by piglets (n=551)

CY=colostrum yield; CI=colostrum intake; BF=back fat thickness; I.R.=interquartile range; ΔBF D85-D109=change in BF between day 85 and day 109 of gestation; ΔBF D109-D1=change in BF between day 109 of gestation and day 1 of lactation.
Mean±s.d. or median±I.R. are given for variables with a normal or non-normal distribution (indicated by *).
Colostrum intake/yield was determined as described by Devillers et al. (Reference Devillers, van Milgen, Prunier and Le Dividich2004).
Colostrum yield
The total CY was 3243±132 g (1568 to 5017) per sow. The CI per piglet was 245±154 g with a maximum of 635 g and the average CI per kg BWB of the piglets was 196±108 g with a maximum of 394 g (Table 1). Thirty-seven percent of the sows were not producing and 31% of the piglets did not consume 160 g colostrum per kg liveborn piglet, the threshold value as proposed by Le Dividich et al. (Reference Le Dividich, Rooke and Herpin2005).
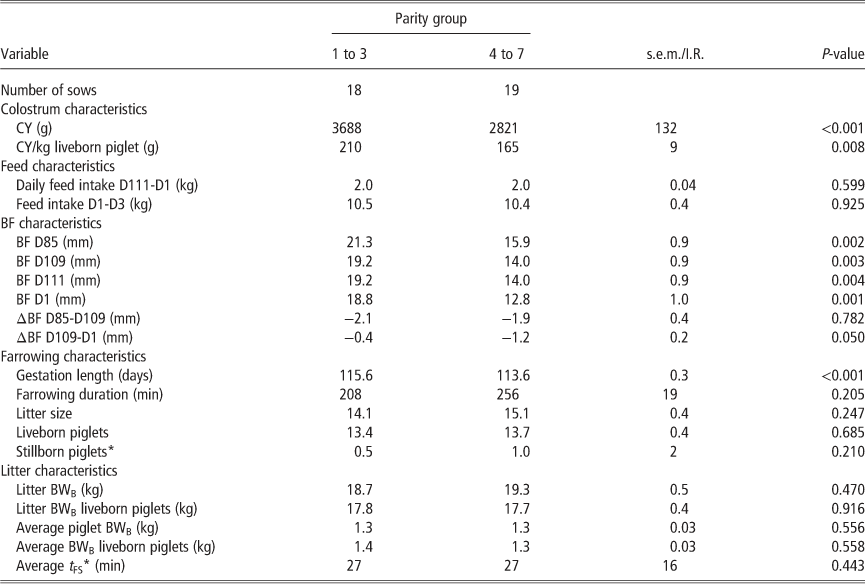
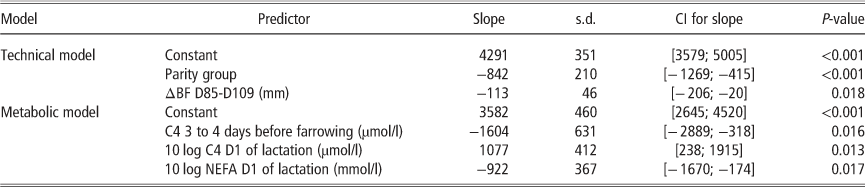
Multivariable regression analysis, performed with all variables presented in Table 2, revealed two factors that were associated with CY: parity group and ΔBF D85-D109. The obtained regression equation (R 2=0.41, P<0.001) was: CY=4290–842 (parity group)–113 (ΔBF D85-D109, mm). The details are shown in Table 3. Both variables were negatively associated with CY. The sows with a parity of 4 to 7 produced 840 g less colostrum compared with sows with a parity of 1 to 3 and within a parity group, an extra loss of 1 mm BF between D85 and D109 of gestation was associated with an increase in CY of 113 g. Raw data of these variables are presented in Table 2 and Figure 1.
The association between colostrum yield and the back fat change between D85 and D109 of gestation is shown.
Comparison of colostrum, feed intake, back fat, farrowing and litter characteristics, between sows of different parity groups
I.R.=interquartile range; CY=colostrum yield; BF=back fat thickness; BWB=birth weight; t FS=time between birth and first suckle.
Normally distributed variables were analysed with an independent samples t-test and mean±s.e.m. is given.
Not normally distributed variables (indicated with *) were analysed with a Kruskal–Wallis analysis and median±I.R. is given.
CY (determined as described by Devillers et al., Reference Devillers, van Milgen, Prunier and Le Dividich2004); D111-D1= day 111 of gestation until day 1 of lactation; D1-D3=day 1 of lactation until day 3 of lactation; ΔBF D85-D109=change in BF between day 85 and day 109 of gestation; ΔBF D109-D1=change in BF between day 109 of gestation until day 1 of lactation.
Multivariable regression analysis when we used technical parameters (technical model) or metabolic parameters (metabolic model) as predictors
CI=confidence interval; ΔBF D85–D109=change in BF between D85 and D109 of gestation; NEFA=non-esterified fatty acid; C4=(iso)butyrylcarnitine.
The dependent variable is the colostrum yield (g) per sow. For the technical model, the sows were divided in two parity groups: parities 1 to 3 and parities 4 to 7. In the regression equation, the x-value of parities 1 to 3 sows is 0 and the x-value of parities 4 to 7 sows is 1.
As parity per se did not provide further insights into how CY might be affected, we tried to identify factors underlying parity. Therefore, we first compared characteristics regarding feed intake, BF, the farrowing process and the litter performance between the two parity groups (Table 2). We could only identify a difference for the BF characteristics and gestation length. Older sows had a lower BF at all times (P<0.004), tended to lose more BF between D109 of gestation and D1 of lactation (P=0.050) and had a shorter gestation length (P<0.001). Then, we investigated possible associations between these characteristics and CY. Only ΔBF D109-D1 (r=0.39, P=0.017), BF D85 (r=0.39, P=0.017) and the gestation length (r=0.39, P=0.017) were correlated to CY, the latter two being mutually highly correlated (r=0.680, P<0.001).
Using forward linear modelling techniques, we were able to see the R 2 with each new variable added to the model. The first factor entered in the model was the ΔBF D85-D109 and this explained 13% (R 2) of the observed variability in CY. When the factor ‘parity group’ was added to the model, an extra 28% of the variability in CY was explained, making a total of 41%. We rebuilt the model without the factor ‘parity group’ but with the three factors that were identified as possibly underlying the parity group effect. Again, in a first step, the ΔBF D85-D109 explained 13% (R 2) of the observed variability in CY. When we added the three factors, an extra 21% of the variability in CY was explained with BF D85 removed from the model due to confounding issues. This indicates that in this study, the ΔBF D109-D1 and gestation length are factors underlying to the factor parity group, without explaining all variation in CY explained by parity group. Raw data of ΔBF D109-D1 and gestation length are plotted against CY in Figure 2 and Supplementary Figure S1.
The association between colostrum yield and the back fat change between D109 of gestation and D1 is shown.
Colostrum composition
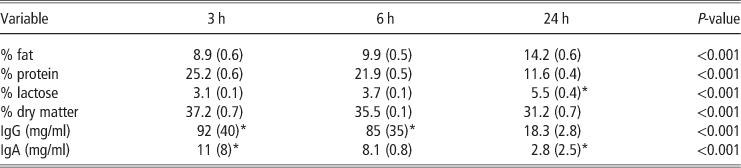
The nutritional composition (%) and concentration of IgG and IgA (mg/ml) in the colostrum are shown in Table 4. The concentration of fat and lactose had increased, whereas all other parameters had decreased over time (P<0.001). The colostrum composition was not correlated to CY (r between −0.3 and 0.3, P>0.05). The total output of nutrients (fat, protein, lactose) through colostrum did correlate with CY (0.64<r<0.94, P<0.001).
Mean composition based on fresh samples (%) and mean concentrations of immunoglobulin G and A in colostrum 3, 6 and 24 h after birth of the first piglet
IgG=immunoglobulin G; IgA=imunoglobulin A.
Statistical analysis of the time effect was performed.
Mean±s.d. or median±I.R. are given for variables with a normal or non-normal distribution (indicated by *).
Serum analysis
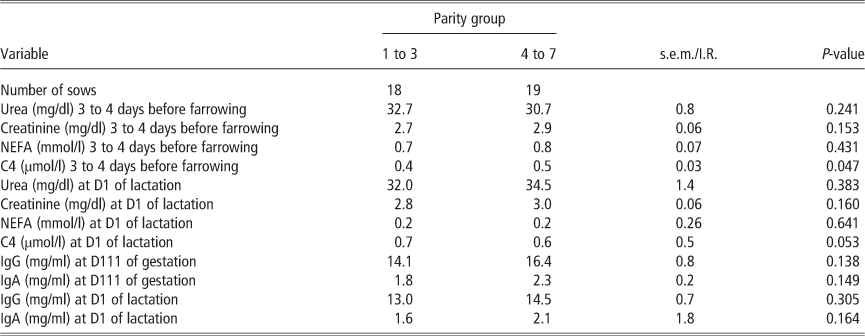
The concentration of the parameters measured in the serum are shown in Table 5. The concentration of C4 3 to 4 days before farrowing was higher in parities 4 to 7 sows compared with parities 1 to 3 sows, whereas at D1 of lactation, the concentration of C4 tended to be lower in the parities 4 to 7 sows.
Comparison of serum metabolites between sows of different parity groups
I.R.=interquartile range; NEFA=non-esterified fatty acid; C4=(iso)butyrylcarnitine; IgG=immunoglobulin G; IgA=immunoglobulin A.
Normally distributed variables were analysed with an independent samples t-test and mean±s.e.m. is given.
Not normally distributed variables (indicated with *) were analysed with a Kruskal–Wallis analysis and median±I.R. is given.
The serum concentration of C4 3 to 4 days before farrowing was negatively associated with CY and at D1 of lactation, the logarithmic transformation of NEFA was negatively associated with CY and the logarithmic transformation of C4 was positively associated with CY (R 2=0.39, P=0.001). The obtained regression equation was: CY=3582–1603 C4 (µmol/l)+1077 10 log C4(µmol/l)–922 10 log NEFA (mmol/l). Details of the regression equation are shown in Table 3 and raw data of these variables are plotted against CY in supplementary Figures S2, S3 and S4.
Discussion
The negative association between CY and ΔBF D85-D109 we observed, has never been described before. As we did not collect more data between D85 and D109 of gestation, we can only propose some hypotheses that might explain this association. The period between D85 and D109 of gestation is considered to be important for mammogenesis (Kensinger et al., Reference Kensinger, Collier, Bazer, Ducsay and Becker1982; Ji et al., Reference Ji, Hurley and Kim2006), which was suppressed by keeping sows in an anabolic state during this period (Weldon et al., Reference Weldon, Thulin, MacDougald, Johnston, Miller and Tucker1991). Our study population was mainly catabolic between D85 and D109 of gestation and there is no information available to date whether this benefits gestational mammogenesis. The negative association between CY and ΔBF D85-D109 could also be the result of a higher energy demand of sows with a higher mammary development. Aside from the possible association with mammogenesis, BF and changes in BF could also alter the sow’s level of insulin sensitivity and thus its lactogenesis. A decreased insulin sensitivity is needed to a certain extent in order to direct glucose to the mammary gland (Père and Etienne, Reference Père and Etienne2007) where it is used for lactose synthesis (Shennan and Peaker, Reference Shennan and Peaker2000). Père et al. (Reference Père, Etienne and Dourmad2000) state that all sows develop an insulin resistance starting from D85 of gestation and this is more apparent in fat sows. A positive energy balance increases the concentration of leptin (Barb et al., Reference Barb, Hausman and Houseknecht2001), which leads to a lower insulin sensitivity (Franks et al., Reference Franks, Loos, Brage, O’Rahilly, Wareham and Ekelund2007; Papadopoulos et al., Reference Papadopoulos, Maes, Van Weyenberg, van Kempen, Buyse and Janssens2009). It might be worthwhile looking further into the relations between the change of body condition during late gestation, gestational mammogenesis, colostrogenesis and colostrum yield.
The higher CY in sows with parities 1 to 3 corresponds to the findings of Devillers et al. (Reference Devillers, Farmer, Le Dividich and Prunier2007) who reported that second and third parity sows tended to produce more colostrum than primiparous and older sows. The observed association between parity group and CY cannot be explained by parity as such, but because other factors differ between parity groups. As thoroughly described in the results section, we identified ΔBF D109-D1 and gestation length as the two factors differing between parity groups and being correlated to CY, thus proving to be candidates to partially explain the association between parity group and CY in this study. The variability in CY explained by parity group was higher than the variability explained by ΔBF D109-D1 and gestation length. This indicates that there are other factors associated to parity that contribute to the variability in CY; however, these have not been identified in this study. Furthermore, not all variability in CY explained by these two factors will be covered by the parity group. Nonetheless, this indicates that the gestation length and ΔBF D109-D1 might partially explain the difference in CY between parity groups observed in this study and therefore, they will be further discussed. Back fat at D85 of gestation also differed between parity groups and was correlated to CY but was not kept in the model. We cannot explain the different back fat between parity groups, although the relatively low feeding practices during gestation at this farm might be the cause of a gradual decrease in BF over successive parities.
The negative association between gestation length and CY was also found by Devillers et al. (Reference Devillers, Farmer, Le Dividich and Prunier2007). Milon et al. (Reference Milon, Aumaitre, Le Dividich, Franz and Metzger1983) suggested that CY and gestation length were negatively associated due to a decreased BWB and vitality of the piglets. These litter characteristics have shown to be important in determining CY (Devillers et al., Reference Devillers, Farmer, Le Dividich and Prunier2007), although we did not observe any differences in BWB and t FS between piglets born before D114 of gestation and piglets born after.
We propose a relatively easy nutrient balance model of sows at the end of gestation where on the one hand, the input of nutrients available for metabolic processes are derived from either feed or body reserves, whereas on the other hand, the loss of nutrients at the end of gestation are determined by the total litter BWB and the loss of nutrients through colostrum. The feed intake and the litter BWB were not associated with CY and sows with a higher CY also had a higher nutrient output through colostrum. Thus, as colostrum is mainly produced the week before farrowing (Devillers et al., Reference Devillers, Le Dividich and Prunier2006), we would expect the use of body fat and protein reserves to increase with an increasing CY in order to obtain the proposed nutrient balance. Our results showed the opposite. The elevated use of body fat (ΔBF D109-D1) and body protein (C4 3 to 4 days before farrowing) was associated with a decreased CY. The parities 4 to 7 sows used more body fat and protein reserves during the last days before farrowing and this might be to cover their higher maintenance requirements compared to young sows (Noblet et al., Reference Noblet, Etienne and Dourmad1998) made even more prominent due to the low feed supply. The higher catabolic state of older sows did likely prohibit sows from producing colostrum at their full potential. It is an interesting observation that sows that are catabolic during the last days of gestation, eventually produce a lower CY as this indicates that the use of body reserves cannot fully compensate a nutrient intake below nutrient requirements.
Colostrum yield was negatively associated to the use of body protein before farrowing, whereas it was positively associated to the use of body protein at D1 of lactation. During the 24 h following parturition, the secretion of the mammary cells becomes abundant (Devillers et al., Reference Devillers, Le Dividich and Prunier2006) and hence the body’s protein can be used to deliver amino acids or glucogenic substrates to the mammary gland (Boyd et al., Reference Boyd, Kensinger, Harrell and Bauman1995). Colostrum yield was negatively associated with NEFA at D1 of lactation, which again indicates the use of body fat reserves around farrowing should be prohibited.
The chemical composition of colostrum revealed high concentrations compared with other studies (Le Dividich et al., Reference Le Dividich, Martineau, Thomas, Demay, Renoult, Homo, Boutin, Gaillard, Surel, Bouétard and Massard2004; Devillers et al., Reference Devillers, Farmer, Le Dividich and Prunier2007; Foisnet et al., Reference Foisnet, Farmer, David and Quesnel2010) without showing a lower CY. Our study was performed in PIC sows of which colostrum composition was not described before. Farmer et al. (Reference Farmer, Charagu and Palin2007) showed that chemical colostrum composition differs between genotypes yet never as much as we observed. Sows in our study were mostly catabolic during the month before farrowing and we should consider this as a factor affecting colostrum composition.
We should be careful when extrapolating the associations between CY and changes in body condition observed in this study as most sows in our study were catabolic during observation probably due to the relatively low feed supply.
In conclusion, back fat changes between D85 and D109 of gestation were negatively associated to CY and parities 4 to 7 sows had a lower CY than parities 1 to 3 sows. We identified gestation length and the extent in which the body’s energy and protein reserves were used the last days before farrowing as possible underlying factors possibly explaining part of the parity effect. Sows that were catabolic the week before farrowing seemed unable to produce colostrum to their full potential. Colostrum composition did not alter when colostrum yield increased. These findings indicate that a proper management of the sow’s body condition during late gestation could be a tool to optimise the intrinsic capacity of the sow’s colostrum yield.
Acknowledgements
This research was funded by the Agency for Innovation by Science and Technology in Flanders (IWT) (101183). The authors thank all colleagues who helped during this experiment, to Ir. H. De Rycke for the feed analysis and to Dr Ir. J. De Boever to analyse nutritional composition of the feed.