Implications
Quantitative trait loci (QTL) affecting wool traits in sheep were detected. This molecular information may be used for the early choice of breeding stock for marker assisted selection. This is a first step toward the identification of causal mutations underlying these QTL of economical importance. In the long term, the mechanistic understanding of the pleiotropic effect should simplify the breeding of efficient high-quality wool producing animals.
Introduction
Linkage-based quantitative trait loci (QTL) mapping is based on the linkage disequilibrium observed within a family (Lynch and Walsh, Reference Lynch and Walsh1998), exploiting recombination in pedigreed and genotyped generations. QTL detection in half-sib family designs is one of the simplest situations. In linkage analysis, most genetic analyses used to identify QTLs are based on regression or maximum likelihood (ML) approaches. Regression analysis is more robust but it does not make use of all the information available. However, both methods seem to be similar in terms of power and parameter estimation in half-sib designs (Le Roy and Elsen, Reference Le Roy and Elsen1995; Baret et al., Reference Baret, Knott and Visscher1998).
Several QTL mapping programs have been designed for sheep. A few were based on experimental crosses between breeds: Romney × Merino cross (Rogers et al., Reference Rogers, Hickford and Bickerstaffe1994), Merino × Romney backcross (Henry et al., Reference Henry, Doods, Wuliji, Jenkis, Beattie and Montgomery1998) and Sarda × Lacaune backcross (Allain et al., Reference Allain, Schibler, Mura, Barillet, Sechi, Rupp, Casu, Cribiu and Carta2006). Others used a single breed such as the INRA401 breed (Ponz et al., Reference Ponz, Moreno, Allain, Elsen, Lantier, Lantier, Brunel and Perez-Enciso2001) or the Merino breed (Bidinost et al., Reference Bidinost, Roldan, Dodero, Cano, Taddeo, Mueller and Poli2008). All these experiments were analysed assuming the segregation of a single QTL controlling a single trait in each linkage group. On the whole, the precision of QTL mapping was low and the number, effect and location of QTL controlling the traits remain unclear. In an attempt to confirm and improve the identification of QTLs that affect wool in sheep, in this study, we extended the analysis performed by Bidinost et al. (Reference Bidinost, Roldan, Dodero, Cano, Taddeo, Mueller and Poli2008) in a QTL experiment on Merino sheep, by two additional families and genotype markers. Further, we tested three hypotheses: a single QTL controlling a single trait (using regression models); two linked QTLs controlling a single trait and a single QTL controlling more than one trait (using regression ML approach).
Material and methods
Animals and data recording
Data resource comprised of 10 paternal half-sib families of Merino breed, which were part of a sire-reference genetic evaluation. Neither sires nor dams were related to each other. Lambs were born on three farms.
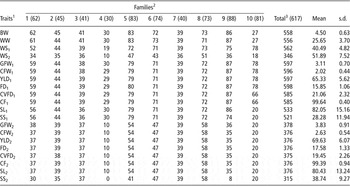
Family size averaged 61.7 offspring ranging from 30 to 88 per sire (Table 1). Body weights were recorded: birth weight (BW; kg), weaning weight (WW; kg), and weight at first and second shearing (WS1; kg and WS2; kg). Wool traits were measured at first and second shearing (14 and 23 months of age, respectively): clean fleece weight (CFW; kg), greasy fleece weight (GFW; kg), clean wool yield (YLD; %), mean fibre diameter (FD; μm), coefficient of variation of FD (CVFD; %), average curvature of fibre (CF; 0/mm), staple length (SL; mm) and staple strength (SS; N/ktex). Total number of records, overall means and s.d. for the 20 studied traits are shown in Table 1.
Distribution of progeny size and phenotypic means and s.d. for body weight and wool traits among the 10 families analysed

1Body weight: BW = birth weight (kg); WW = weaning weight (kg); WS1 = weight at first shearing (kg); WS2 = weight at second shearing (kg).
Wool traits: CFW = clean fleece weight (kg); GFW = greasy fleece weight (kg); YLD = clean wool yield (%); FD = mean fibre diameter (μm); CVFD = coefficient of variation of FD (%); SL = staple length (mm); SS = staple strength (N/ktex); CF = average curvature of fibre (0/mm).
Indexes: 1 = first shearing; 2 = second shearing.
2In parentheses: number of offspring with records per genotyped sire by trait.
3In parentheses: total number of offspring with records among genotyped sires.
The mixed linear model used to describe the data used in the regression models was:

where y is the vector containing the phenotypic data on half-sibs for each trait, β is the vector of fixed effects (flock, sex and litter size), u and e are the vectors containing the sire random effects and residual effect, respectively. The random effects were assumed to be normally distributed as follows:  ,
 , with I being the identity matrix,
 and
 the sire and residual variances, respectively. Residuals
 from this analysis were the data vectors used for QTL mapping. The computations were performed using the general linear model (GLM) procedure of SAS (SAS Institute Inc., 2000).
Markers and genotyping
Eight paternal half-sib families had been used in an initial analysis with 6, 4, 4 and 3 microsatellites (MS) on sheep chromosomes (OAR) OAR3, OAR4, OAR11 and OAR25, respectively (Bidinost et al., Reference Bidinost, Roldan, Dodero, Cano, Taddeo, Mueller and Poli2008). Additional genotypes were generated in two steps: first, two new paternal families were genotyped for these 17 MS. Second, the whole population was genotyped for nine markers on OAR1 and 14 additional markers on four regions of interest based on the previous results. The selection of these new chromosome regions was in accordance with the results reported by Parsons et al. (Reference Parsons, Cooper and Piper1994, on OAR1), Rogers et al. (Reference Rogers, Hickford and Bickerstaffe1994, on OAR11), Allain et al. (Reference Allain, Lantier, Elsen, Frans, Brunel, Weis-becker, Schibler, Vaiman, Cribiu, Gautier, Berthon and Lantier1998, on OAR3 and OAR4), Ponz et al. (Reference Ponz, Moreno, Allain, Elsen, Lantier, Lantier, Brunel and Perez-Enciso2001, on OAR3) and Allain et al. (Reference Allain, Schibler, Mura, Barillet, Sechi, Rupp, Casu, Cribiu and Carta2006, on OAR3).
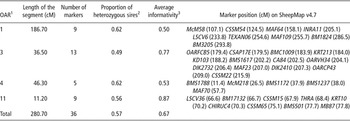
As the additional marker on OAR25 did not improve the information, this chromosomal region was not included. In total, 36 MS markers were thus chosen from the NCBI Map viewer database SheepMap v4.7 Linkage to cover specific regions on OAR1 (from 107.1 cM to 293.8 cM), OAR3 (13 MSs from 179.4 cM to 215.9 cM region), OAR4 (5 markers covering 11.4 cM to 57.7 cM region) and before OAR11 (9 markers covering from 66.6 cM to 77.8 cM). The regions covered on OAR3 and OAR11 had the densest marker spacing, with an average distance of 2.8 cM and 1.2 cM, respectively. All information about this discovery of the markers, including the references, are given after the website URL http://www.ncbi.nlm.nih.gov/genome/guide/sheep/
Table 2 lists the names and positions of the markers used and characteristics of genome coverage.
Markers used and characteristics of genome coverage

1OAR = Ovis aries autosome.
2Proportion of heterozygous sires averaged over all markers of the chromosome.
3Average value over the chromosome.
Further detailed information relating to these phenotypic measures and the DNA extraction and genotyping procedures can be found in Bidinost et al. (Reference Bidinost, Roldan, Dodero, Cano, Taddeo, Mueller and Poli2008).
Statistical methods
QTL mapping
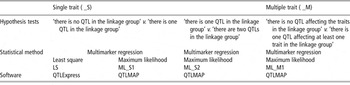
The hypotheses of one or two linked QTL affecting a single trait, as well as the hypothesis of a single QTL controlling more than one trait (pleiotropic effect) were tested. The notations used are: ‘_S’ and ‘_M’ for the single and multitrait analysis, respectively; and ‘1’ and ‘2’ for the one and two linked QTL tests, respectively (see Table 3 for notation and for an illustration of the methodology).
Steps followed in the analysis and notations used for the hypothesis tests and methods

QTL = quantitative trait loci.
Precorrection of the data before regression analysis were performed under the assumption of a polygenic infinitesimal model. As the model could be inappropriate when a QTL is segregating, various data adjustment procedures (no correction and correction for fixed effect, and correction for fixed and random effects before or within a QTL mapping analysis) were compared in a preliminary analysis. Very similar results in terms of estimation of standard error of fixed effects were obtained with the GLM procedure in the SAS, QTLMap and QTLExpress packages. This observation is consistent with the idea that point estimates of fixed effects in mixed linear models are not sensitive to dispersion of random effects (Harville, Reference Harville1974).
Single Trait
QTL analyses were performed following two QTL detection methods: multimarker regression, either with the fully linear least-squares approach for half-sib designs proposed by Knott et al. (Reference Knott, Elsen and Haley1996), hereafter referred to as LS, or with the quasi ML techniques followed by Elsen et al. (Reference Elsen, Briggite, Goffinet, Boichard and Le Roy1999), hereafter referred to as ML_S.
LS analysis was performed using QTLExpress software (Seaton et al., Reference Seaton, Haley, Knott, Kearsey and Visscher2002) and ML analyses using QTLMap (Elsen et al., Reference Elsen, Briggite, Goffinet, Boichard and Le Roy1999). Both assume that the sires are randomly mated to unrelated dams and provide a test for segregation of a QTL within each sire. QTLExpress assumes homogeneity of variance within a sire (Knott et al., Reference Knott, Elsen and Haley1996) while the QTLMap model assumes heteroskedasticity (Elsen et al., Reference Elsen, Briggite, Goffinet, Boichard and Le Roy1999).
From this initial test, we performed likelihood calculations for _S2 (two linked QTLs controlling a single trait) described by Gilbert and Le Roy (Reference Gilbert and Le Roy2007) and implemented in QTLMap.
Multiple trait method
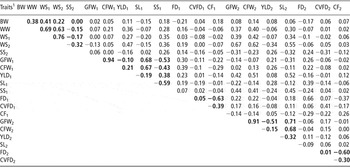
To test the existence of a pleiotropic QTL, traits were grouped according to two criteria. The first assembled traits showing significant evidence of a QTL in a single QTL analysis and by chromosome (hereafter referred to as based on the significant QTL analysis (BSQ)). The second criterion, hereafter referred to as based on phenotypic criteria (BPC), assembled traits that were phenotypically correlated (Table 4) and known to be biologically associated (e. g. the functional relationship that exists between follicle density and FD; Purvis and Franklin, Reference Purvis and Franklin2005). For weight traits, BW, weaning weight, first shearing weight and adult weight, the phenotypic correlations varied from moderate to high (from 0.38 to 0.76). The phenotypic correlations between greasy and CFW were very high (around 0.92), and the correlations between YLD and the other wool traits were generally low to moderate (from 0.01 to 0.38). However, the correlation between YLD1 and clean and greasy fleece measured at the second shearing, and between YLD1 and SL2 were higher (0.42 and 0.52, and 0.52, respectively). Although the test of a single QTL was performed for a limited number of traits assemblages, other assemblages of lower biological significance and only based on phenotypic correlations, could have been examined.
Phenotypic correlations among weight and wool traits

1See Table 1 for the definitions of the traits.
The bold values indicate the assembled traits for the analysis based on the phenotypic correlation criteria.
The ML_M analysis was performed following the multitrait analysis for QTL detection described by Gilbert and Le Roy (Reference Gilbert and Le Roy2003) and implemented in QTLMap.
All genome scans were realized using a 1 cM step.
Significance thresholds
Two significance levels including chromosome-wide and genome-wide thresholds were derived empirically as proposed in the software. First, when using QTLExpress, chromosome-wide and genome-wide thresholds were estimated from 1000 permutations, as suggested by Churchill and Doerge (Reference Churchill and Doerge1994). When using QTLMap, 1000 simulations under the null hypothesis were performed for each trait and linkage group. The empirical chromosome-wide distribution of the test statistics under the null hypothesis was built from the empirical distribution of its highest value across the linkage group.
The conservative genome-wide thresholds were derived from chromosome-wide significance levels, following:  in which c is the total number of chromosomes and l the number of traits.
Confidence interval for QTL location
A bootstrap procedure (Visscher et al., Reference Visscher, Thompson and Haley1996) was implemented in QTLExpress to estimate the confidence intervals of QTL locations. For the ML, the 95% confidence intervals of the QTL locations were estimated by likelihood odd ratio (LOD) drop-off, the bounds of the interval being the two locations whose likelihood was equal to the ML minus 3.841  (Lander and Botstein, Reference Lander and Botstein1989).
Results
Single Trait methods
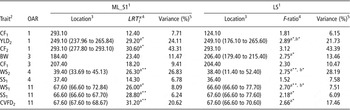
The estimates corresponding to significant QTLs following the tests of ‘no QTL’ v. ‘one QTL’ hypotheses are summarized in Table 5.
Results of quantitative trait loci analyses for body weight and wool traits (single trait model)

1Statistical method: ML_S1: multimarker maximum likelihood regression in a one-QTL hypothesis test; LS : multimarker least square regression.
2See Table 1 for the definitions of the traits.
3Location and confidence interval in cM.
4  : maximum likelihood ratio for each trait l for x locus; F-ratio. Significance level: achromosome-wide; bgenome-wide. *P < 0.05; **P < 0.01.
5Variance explained by the QTL (%) estimated as  being
 where
 is the average effect of substitution effect of the QTL for the l th quantitative trait
 .
For ML_S1 analysis (QTLMap software), QTLs for six traits were detected on three chromosomes: YLD2 and CF2 on OAR1; WS2 on OAR4 and WS1, SS1 and CVFD2 on OAR11. However, no QTL was identified on OAR3. The phenotypic variance explained by the QTL ranged from 6.24% for the QTL affecting SS1 on OAR11 to 43.31% for the QTL associated with the curvature of the fibre on OAR1 (Table 5).
LS analysis revealed QTLs for six traits. The findings were consistent with ML_S1 for five out of the six significant QTLs. However, no QTL was associated with CF2 on OAR1, while an additional QTL for BW was significant on OAR3. The putative positions for the QTL detected by both methods (ML_S1 and LS) as well as the estimated proportions of the phenotypic variance they explained were similar.
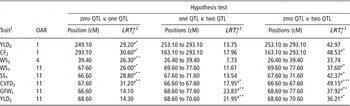
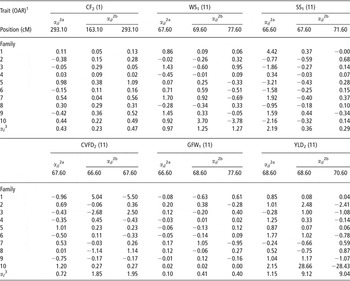
Results of the tests of the ‘one QTL’ v. ‘two QTLs’ hypothesis for the single trait analysis are summarized in Table 6. Table 7 shows, the within family average QTL substitution effects for the significant results, estimated under a two-linked QTL test. Four situations were observed (Table 6) with varying levels of significance in three tests (no QTL v. one QTL, one QTL v. two-linked QTL and no QTL v. two-linked QTL).
Results of QTL analyses under the two-linked-QTL hypothesis for body weight and wool traits in the single trait model (ML_S2)

1See Table 1 for the definitions of the traits.
2  : maximum likelihood ratio for each trait l for x locus. Significance level: a chromosome-wide. *P < 0.05;**P < 0.01; ***P < 0.001.
Results of QTL analyses under a two-linked QTL hypothesis (single trait model ML_S). Average substitution effect estimated for each trait and each family

1See Table 1 for the definitions of the traits.
2Average effect of substitution  of the QTL for the l th quantitative trait for the i th family, estimated under hypothesis test: a = 0 QTL v. 1 QTL at x position; b = 0 QTL v. 2 QTL at x = x1; x2 positions.
3Average effect of substitution  of the QTL for the l th quantitative trait, and estimated as
 .
(i) In the first situation a first QTL test (0 QTL v. 1 QTL) was detected but there was no significant evidence for an additional QTL (YLD2 on OAR1 and WS2 on OAR4)
(ii) In the second situation, there was a significant effect of QTL in both the one and two-linked QTL v. 0 QTL tests but results of the one-QTL v. two-QTL test were not significant (CF2 on OAR1 and WS1 and SS1 on OAR11). For CF2, the QTL associated with the higher estimated QTL effect in the two-QTL test, was located at the position of the QTL detected in the one-QTL analysis (at 293.10 cM and 67.60 cM on chromosomes 1). For this case, the two-QTL hypotheses should not be retained
(iii) In the third situation, occurring for CVFD2 on OAR11, the results of the 0 v. one-QTL, one v. two-QTL and 0 v. two-QTL hypotheses were all significant. However (a) the location of one of the two QTLs was identical to the location of the QTL in the single-QTL analysis; (b) the most significant families (e.g. families 1, 3 and 8) displayed QTL effects of opposite signs. These two observations suggest that the second QTL could be a statistical artefact
(iv) The last situation revealed two putative QTLs (for GFW1 and for YLD2 on OAR11, test 0 QTL v. 2 QTL) while no QTL was detected in the single-QTL analysis. QTL substitution effects with opposite signs were observed for seven of 10 families (Table 7), suggesting that the QTL effects were masked in the single-QTL analysis. However, estimation of the QTL effects (Table 7) for YLD2 on OAR11 showed extreme values for family 10. A close analysis of the haplotypes transmitted by the sire to its progeny revealed that no recombination occurred between the QTLs. Thus, for this particular offspring, the within-sire QTL effects could not be estimated separately and the average substitution effect (9.12 for the first QTL and 9.04 for the second QTL) are probably highly biased. Nevertheless, the same two-QTL analysis in YLD2 excluding family 10 rejected the null hypothesis (there are no QTLs) at the 5% chromosome-wise level.
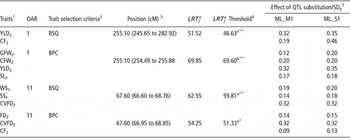
Multiple trait method
Table 8 shows the results of the single pleiotropic QTL test. Analyses assembling traits for which QTLs were detected close to one another following one-QTL single trait analyses gave a positive signal for a single pleiotropic QTL. The same was true for the traits grouped following the consideration of the correlations. The confidence interval estimated when the traits was chosen by the significant result in the one-QTL analysis was greater than when they were selected by the phenotypic correlation values (the length of the confidence interval value was 37.27 cM for BSQ assembling criteria and 1.39 cM for BPC on OAR1).
Results of quantitative trait loci analyses in the multiple trait model by multimarker maximum likelihood regression (ML_M1) for the significant traits detected in ML_S1 analysis and for the correlated traits.

1See Table 1 for the definitions of the traits.
2Criteria to select the traits for the multitrait analysis. BSQ : based on the significant QTL analysis and BPC : based on the phenotypic correlation.
3Position and interval confidence in cM.
4Significance level: achromosome-wide, bgenome-wide; *P < 0.05; **P < 0.01
5QTL effect in phenotypic deviation units (SDp), and estimated as  being
 .
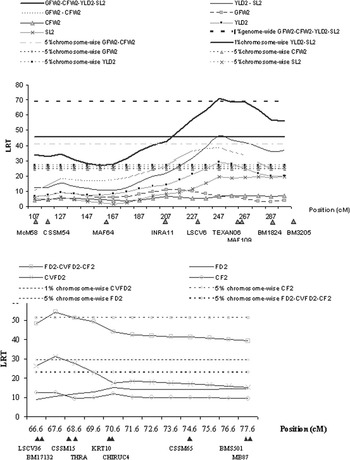
For the traits grouped following consideration of the correlations, we found significant evidence for a QTL on OAR1 associated with traits recorded in the second shearing (GFW2-CFW2-YLD2-SL2) at 255.10 cM. Figure 1 shows the likelihood profiles for these four traits analyzed independently (by ML_S1 and LS analyses) and jointly. The shapes were similar in the joint analysis and for YLD2 and SL2 single trait analysis. It should be emphasized that using the single trait method, one QTL was detected for YLD2 but not for SL2. The estimated QTL positions for YLD2 were 249.10 cM and 248.10 cM and 255.10 cM for ML_S1 and LS, respectively.
Likelihood profiles in single and multitrait one-quantitative trait loci analyses (based on the phenotypic correlation) for the significant traits in the multitrait model on OAR1 (top) and OAR11 (bottom). GFW = greasy fleece weight (kg); YLD = clean wool yield (%); FD = mean fibre diameter (μm); CVFD = coefficient of variation of FD (%); SL = staple length (mm); CF = average curvature of fibre; LRT = likelihood ratio test; 1 = first shearing; 2 = second shearing.

No QTL for several traits was detected on OAR3 or on OAR4
With regard to OAR11, one QTL was detected that simultaneously affected WS1, SS1 and CVFD2 (under significant one-QTL results), and FD2, CVFD2 and CF2 (under BPC assembling) at 67.60 cM. The likelihood profile for the joint analysis was similar to the CVFD2 profile for which a QTL was detected at position 67.60 cM with both models ML_S1 and LS.
An agreement was found between estimations of QTL substitution effects in multitrait v. single trait analyses (Table 8). The exception was for CF2 on OAR1 (0.46 in ML_M1 against 0.19 ML_S1 analyses).
Discussion
Data analysed in this study came from the National Merino Sheep Genetic Evaluation Service resources (i.e. several weight and wool traits) and from genotyping of families on specific chromosomal regions on four chromosomes. Analyses aimed to (i) identify a segregating QTL (using two methods: ML_S1 and LS), (ii) determine if two linked QTLs can affect a single trait and (iii) determine if a QTL can be associated with more than one trait in this Merino sheep population. All tests showed evidence for QTLs for several wool traits on OAR1 and on OAR11.
Methodology and design
Single trait methods and one-QTL hypothesis test
For all traits, results were identical when QTLMap was performed using either uncorrected data or jointly modelling nuisance and QTL effects. The same was observed with QTLExpress, with slight differences in F-ratios.
Results obtained with the different models (and software), were partially in agreement in most cases for the estimated position of the QTLs. Despite their differences, the similarity of least-squares and ML ‘regression’ approaches in terms of hypotheses and modelling has already been reported (Knott et al., Reference Knott, Elsen and Haley1996; Baret et al., Reference Baret, Knott and Visscher1998).
Single trait method and two-QTL hypothesis test
The single QTL interval mapping procedure performed here may face two problems if more than one QTL controls the trait:
(i) The test statistic being affected by all QTLs close to the tested position, the estimated position and effects of the QTL identified will be biased if there is more than one QTL in the linkage group (Haley and Knott, Reference Haley and Knott1992; Zeng, Reference Zeng1994). Even more, Gilbert and Le Roy (Reference Gilbert and Le Roy2007)confirmed by simulation that the estimates of QTL position and the effects obtained under the one-QTL hypothesis when two QTLs are segregating on the linkage group depend on their coupling or repulsion phases. In both cases, in the one-QTL analysis, the estimated position was around the mean of the two simulated QTL positions. Although the estimated one-QTL effect was higher than the individual effect of each QTL when they were in the coupling phase, it was close to 0 when they were in the repulsion phase. In this situation, the ‘one QTL’ v. ‘two QTL’ tests could help to identify QTLs not detected by the 0 QTL v. one-QTL test. On chromosome 11, for GFW1 and for YLD2 traits, the fact (a) that the results of the one-QTL v. two-QTL test were significant, and (b) that the QTL substitution effects within families showed the opposite signs, suggest that two QTLs are located on chromosome 11 in repulsion phases. This demonstrates the benefit of conducting additional tests to the one-QTL analysis
(ii) The residual variance is inflated by segregating QTLs even if these are not located on the chromosome scanned. In this situation, it may be useful to include genotype probabilities at selected positions as cofactors, or to test other genetic models fitting interactions between QTLs (Knott, Reference Knott2005). This was not done in this study as interval mapping coded in the software used did not consider information from other markers. To gain more insight, a study of haplotypic effects of chromosome segments will be performed in the future.
Multiple trait methods
Multitrait analyses test if a QTL affects more than one trait. Several methods have been proposed, all based on a linear combination of the traits using ML techniques or discriminant transformations (Ronin et al., Reference Ronin, Kirzhner and Korol1995; Weller et al., Reference Weller, Wiggans, VanRaden and Ron1996; Knott and Haley, Reference Knott and Haley2000; Gilbert and Le Roy, Reference Gilbert and Le Roy2007). In this study, some of the multitrait analyses were conducted assembling traits which were found to be controlled by QTLs closely located in the single trait analyses, even if the phenotypic correlations between the two (on OAR1) or three (OAR11) traits were small (absolute values ranged from 0.02 to 0.35). A second type of multitrait analysis was performed on traits displaying high phenotypic correlations. Whatever the rationale for assembling the traits, the estimated positions of the pleiotropic QTL were similar to one of the positions found in the single trait QTL analyses. The confidence interval was smaller than the confidence interval estimated by ML_S1 (both with the LOD-drop technique).
It has been shown that when a pleiotropic QTL is present, using information from different correlated traits simultaneously increases the precision of the estimated location of the QTL whose effects are too small to be detected in single trait analysis (Gilbert and Le Roy, Reference Gilbert and Le Roy2003). In this study, the hypothesis of a single QTL controlling several traits was retained for chromosomes 1 and 11.
Two multitrait analyses were performed on chromosome 1. The first BSQ assembled traits (YLD2 and CF2) for which a QTL was detected on OAR1, at 249.10 and 293.10 cM, respectively. The hypothesis of a pleiotropic QTL was retained but the confidence interval was very large, suggesting that the statistical rejection of the null hypothesis (no QTL at all) had no real biological significance. The second analysis assembled highly correlated traits (YLD2-SL2-GFW2-CFW2). The evidence of a pleiotropic QTL was strong compared with the one-QTL single trait model (Figure 1). This was also true, although to a lesser extent, when only YLD2 and SL2 were considered in the pleiotropic approach. For the pleiotropic one-QTL test, the ML ratio test exceeded the 1% genome-wide level (for GFW2-CFW2-YLD2-SL2) and 1% chromosome-wise (YLD2-SL2) level, but in the one-QTL single trait model; YLD2 only exceeded the significant threshold at the 5% chromosome-wide level, whereas none of the analyses of other traits was significant. This confirms the contribution of correlated traits in the detection of multitrait QTLs.
When both YLD2 and SL2 were not considered in the pleiotropic hypothesis, the evidence of a significant QTL disappeared (Figure 1). When only YLD2 was discarded, a QTL located at 9 cM (data not shown) was detected. Globally, our results suggest that a pleiotropic QTL exists, mostly, but not fully explained by its control on YLD2 and SL2.
On OAR11, the two multiple trait analysis (BSQ and BPC) included CVFD2, a trait for which a QTL was detected at the 1% chromosome-wise level. The significance levels of the multitrait analysis were not higher. Moreover, when CVFD2 was removed, the hypothesis of single pleiotropic QTL was not accepted (data not shown). On the whole, this suggests that there is no pleiotropic QTL effect of these traits on OAR11 but confirms the existence of a QTL affecting CVFD2.
QTL detected
As mentioned previously, 8 of the 10 paternal half-sib families analysed here had been used in an initial QTL detection project focusing on OAR3, OAR4, OAR11 and OAR25 (Bidinost et al., Reference Bidinost, Roldan, Dodero, Cano, Taddeo, Mueller and Poli2008). In that study, QTLs for wool traits were found on OAR3 (for FD1), on OAR4 (for GFW2 and CFW2), and on OAR25 (for YLD1, YLD2 and CVFD2). In this study, none of these QTLs were detected by the regression model (neither QTLExpress nor QTLMap software). However, the position of the maximum of the OAR3 profile was very close to the preliminary position detected (near the OARVH34 marker), reported by Bidinost et al. (Reference Bidinost, Roldan, Dodero, Cano, Taddeo, Mueller and Poli2008). This was not the case for the OAR4 profile, which did not peak at the same position. This may be a consequence of the low marker density in (Bidinost et al., Reference Bidinost, Roldan, Dodero, Cano, Taddeo, Mueller and Poli2008) which may have biased estimation of the QTL position. The shape profiles of the F-ratio for both GFW2 and CFW2 along the chromosome were same as those the previously reported by Bidinost et al. (Reference Bidinost, Roldan, Dodero, Cano, Taddeo, Mueller and Poli2008), (the evidence increasing at the distal end of the linkage group).
Using different sheep resources (mainly in cross-breeding designs), and different analytical methods (all within the context of linkage analysis and single trait and one-QTL testing) and diverse mapping methods (genome scan or candidate gene approaches), several QTLs have been found using MS markers for wool traits (Purvis and Franklin, Reference Purvis and Franklin2005; http://sphinx.vet.unimelb.edu.au/QTLdb/)
A QTL for FD (Parsons et al., Reference Parsons, Cooper and Piper1994) and for ‘objectionable fibre content’ (this trait being defined as a large medullated fibres with a latticed medulla deficient in sulphur by Allain et al., Reference Allain, Schibler, Mura, Barillet, Sechi, Rupp, Casu, Cribiu and Carta2006) on OAR1 were reported. These authors found a QTL close to the position of the KAP6-KAP8 genes (around 145 cM). We did not find any association in this region. A QTL was identified for several traits (YLD2, CF2, GFW2, CFW2 and SL2) around position 255 cM (between the markers TEXAN06-MAF109), and which appears to affect primarily YLD2 and secondly SL2. However, there were no mapped candidate genes that could explain the detected QTL effects.
In the chromosome segment analysed on OAR11, we identified a significant QTL for weight recorded at first shearing and for wool traits recorded at first and second shearing (WS1 and SS1, and CVFD2, respectively). The largest confidence intervals for those QTLs were flanked by the LSCV36 (at 66.6 cM) and BMS501 (at 77.7 cM) markers. Keratine and keratine-associated proteins genes (KRT1, KAP1 and KAP3) have been mapped from 71.9 to 73.4 cM on OAR11 (McLaren et al., Reference McLaren, Rogers, Davies, Maddox and Montgomery1997). Those genes could be responsible for these detected QTL signals. Consistently, in the Romney breed, Rogers et al. (Reference Rogers, Hickford and Bickerstaffe1994) identified a QTL for KAP1.1, KAP1.3 (formerly known as B2A and B2C, respectively) and KRT1.2 using a candidate gene approach.
QTLs for traits recorded at an early age (first shearing at 14 months of age) may not be found in adults (23 months old). Even if this is suggesting a temporal expression of QTLs, a statistical artefact cannot be excluded considering the relatively small samples of this experiment (based on 617 progeny) and the even smaller informative families for these QTLs.
Finally, in relation to a hypothesis of a single QTL controlling more than one trait, we found that the same QTL that primarily affects certain traits also likely exerts secondary effects on other related traits. This could be confirmed by the fact that genes affecting one or more of the developmental pathways involved in follicle initiation and fibre growth are also likely to exhibit effects on the genes responsible for the fleece phenotypes (Adelson et al., Reference Adelson, Cam, DeSilva and Franklin2004).
Conclusions
QTLs were detected using regression approaches. It is difficult to conclude from our two QTL analyses what this situation really means, as artefacts cannot be excluded. Pleiotropic QTLs were found and the corresponding QTL positions were more accurate than the position estimated in single trait analyses.
QTL mapping in several breeds and commercial sheep crosses based on the single wool trait, one-QTL hypothesis is a common strategy. This study demonstrates the utility of other strategies. Although selection for wool traits (decrease in FD and increase in fibre length and strength) has been applied in the experimental lines used in this study, the QTL detected for weight at first shearing and several wool traits, tends to show that part of the genetic variance can be explained by the segregation of QTL of medium to large effects.
Although a number of fleece characteristics is essential in determining how much buyers will pay for wool, both wool weight and average FD are the principal determinants of price, and for this reason these two traits are the usual focus of breeding programs. Thus, if our results are confirmed, they pave the way for a better mechanistic understanding of the genes involved, as the pleiotropic effect usually constitutes a substantial barrier to the breeding of efficient high quality wool-producing animals (Adelson et al., Reference Adelson, Cam, DeSilva and Franklin2004).
Further studies remain to be conducted on these experimental data to confirm the QTLs identified and to map them more accurately. To this end, it would be useful to evaluate other multitrait models (such as discriminant analysis that seem to be more powerful and precise than the method used here for the estimation of QTL position; Gilbert and Le Roy, Reference Gilbert and Le Roy2003), include additional generations to increase the number of recombinants available, include additional maternal relationships considering several generations in the pedigree, and utilise a denser map using SNP markers on these candidate regions that allow the joint use of association and linkage analysis.
Acknowledgements
The authors are grateful to Andrés Legarra from INRA-SAGA (Auzeville, France) for reading the manuscript and useful comments, and also to the staff at the Experimental Farm of INTA Pilcaniyeu (Río Negro, Argentina). The first author thanks Susana Costoya from the Instituto de Genética CICVyA (INTA Castelar, Argentina) for her technical assistance. This research was supported by a fellowship by ‘Plan de Formación, Actualización y Perfeccionamiento’ Res. 779-06 (2007-2010) grant Instituto Nacional de Tecnología Agropecuaria (INTA-Argentina).