I. INTRODUCTION
Titanium dioxide (TiO2) is a wide-band-gap semiconductor with versatile applications such as photocatalysis,Reference Bayati, Moshfegh and Golestani-Fard1–Reference Bayati, Golestani-Fard, Moshfegh and Molaei4 photovoltaics,Reference Park, Kim, Jeong, Lee, Kim and Choi5–Reference Yang, Li, Fan and Gao7 antibacterial applications,Reference Karunakaran, Abiramasundari, Gomathi sankar, Manikandan and Anandi8,Reference Necula, Apachitei, Tichelaar, Fratila-Apachitei and Duszczyk9 hydrophilic surfaces and antifogging mirrors,Reference Bayati and Molaei10–Reference Bayati, Molaei, Kajbafvala, Zanganeh, Zargar and Janghorban12 gas sensors,Reference Moon, Park, Lee, Zyung and Kim13–Reference Han, Hong, Han, Gwak and Singh15 bio-devices,Reference Ashkarran, Aghigh, Kavianipour and Farahani16,Reference Khan and Dhayal17 microelectronic devices,Reference Fröhlich, Hudec, Aarik, Tarre, Machajdík, Kasikov, Hušeková and Gaži18–Reference Popovici, Kim, Tomida, Swerts, Tielens, Moussa, Richard, Bender, Franquet, Conard, Altimime, Elshocht and Kittl20 and pigments.Reference Topuz, Gündüz, Mavis and Çolak21,Reference Mahmoudian, Basirun, Alias and Ebadi22 As often described, TiO2 crystallizes in three different polymorphs: rutile (tetragonal, space group P4 2/mnm, a = b = 0.45933 nm and c = 0.29592 nm), anatase (tetragonal, space group I4 1/amd, a = b = 0.37852 nm and c = 0.95139 nm), and brookite (orthorhombic, space group Pbca, a = 0.54558 nm; b = 0.91819 nm, and c = 0.51429 nm). However, only anatase and rutile play a significant role in determining or providing the applications of titania. Anatase and brookite are metastable states of TiO2, which transform into rutile upon heating at high temperatures indicating that rutile is the most stable state.Reference Bayati, Moshfegh and Golestani-Fard23–Reference Sbai, Perriere, Seiler and Millon25 Pure titania is n-type semiconductor with indirect band gaps of 3.2 eV for anatase, and 3.0 eV for rutile between the full oxygen 2p valence band and titanium 3d states at the bottom of the conduction band.Reference Banfield, Veblen and Smith26–Reference Sanjines, Tang, Berger, Gozzo, Margaritondo and Levy29 In addition, rutile possesses a superior light scattering propertyReference Auger, Stout, Barrera and Curiel30,Reference Cernea, Secu, Secu, Baibarac and Vasile31 being beneficial for effective light harvesting. Meanwhile, in the electronics industry, rutile is the most frequently used polymorph, because it exhibits a higher dielectric constant, as compared with the anatase, which is a desirable property in applications such as capacitors and temperature-compensating condensers.Reference Andersson, Kiselev, Osterlund and Palmqvist32 Fabrication of dynamic random access memory (DRAM) capacitors with an equivalent oxide thickness (EOT) lower than 0.5 nm requires oxide materials with a dielectric constant (k) of at least 50.Reference Kim, Lee, Han, Lee, Han and Hwang33 One of the oxides that fulfills this condition is TiO2, but only in the rutile phase which has a high dielectric constant (k) reported to be ∼90 and as high as ∼170, depending on crystallographic orientation.Reference Diebold34
Another interesting application of titania is related to the photolysis of water on TiO2 electrodes with no external bias where the idea is that the surface defect states play a role in the decomposition of water into hydrogen and oxygen.Reference Fujishima, Zhang and Tryk24,Reference Fujishima and Honda35 As characteristics of defects on the titania surface change from one crystallographic plane to another, it is necessary to grow epitaxial TiO2 films with known defect characteristics to investigate the role of defects for different properties. Furthermore, epitaxial growth enables us to fabricate devices with controllable properties, as lattice orientation of TiO2 thin films determines the efficiency and performance of advanced devices. Phase structure, orientation, defect content, and morphology of titania determine its performance; hence, it is critical to control the structure of TiO2 films. Fabrication of high-quality epitaxial TiO2 films has attracted much interest from the viewpoints of basic materials science, properties, and applications.
In this article, we report control of microstructure from poly- to textured to single-crystal films as a function of substrate and laser deposition variables. Special emphasis is placed on epitaxial growth and control of growth orientation of TiO2 on sapphire(0001) by the paradigm of domain-matching epitaxy (DME) where integral multiples of planes match across the film-substrate interface. We are able to control the defect content in epitaxial films by changing laser deposition and substrate variables and study the details of defect-property correlations. We optimized the growth conditions (energy density, temperature, and oxygen pressure) such that we can obtain a pure rutile epitaxial film at low temperatures (e.g., 450 °C). Decreasing the processing temperature is critical for device fabrication, particularly for nanosized devices where the heat budget plays a much more important role in determining the phase structure, morphology, defect texture, and, consequently, performance of the device.
II. EXPERIMENTAL
TiO2 thin films were deposited on single crystal sapphire(0001) substrates (single side polished) using pulsed laser deposition (PLD) technique. The substrates were initially cleaned through a multistep procedure including degreasing in hot acetone for 15 min, ultrasonic cleaning in acetone for 5 min followed by ultrasonic cleaning in methanol for 5 min. The cleaned substrates were fully dried by nitrogen gun before loading into the deposition chamber. A Lambda Physik (LPX200, Lambda Physik AG, Goettingen, Germany) KrF excimer laser (λ = 248 nm, τ = 25 ns) was used to ablate the TiO2 target, which was being rotated during the deposition to provide a uniform ablation and avoid pitting on the target surface. Frequency and the target-substrate distance were maintained as 10 Hz and 4.5 cm, respectively during the film deposition. Different laser energies of 1.5–2.0, 2.5–3.0, 3.5–4.0, and 4.5–5.0 J/cm2 were used. The chamber was evacuated to a base pressure of ∼1 × 10⁻⁶ Torr and, then, oxygen partial pressure was controlled by leaking oxygen (99.95% purity) into the chamber. A series of thin films were deposited for 20 min at various substrate temperatures (room temperature, 150, 250, 450, and 550 °C) under different oxygen partial pressures ranging from 5 × 10⁻⁶ to 5 × 100 Torr with 10+2 intervals. The layers were subjected to thermal annealing for 1 h, immediately after deposition inside the PLD chamber, at temperature and pressure similar to those of deposition.
The crystalline structure and out-of-plane orientation of the TiO2 films were investigated by θ−2θ x-ray diffraction -scanning using a diffractometer (XRD; Rigaku x-ray diffractometer, Rigaku, The Woodlands, TX) with Cu Kα radiation (λ = 0.154 nm). A Philips X’Pert Pro x-ray diffractometer (PANalytical, Almelo, Netherlands) was used for φ-scanning to determine in-plane orientation of TiO2 films. Scanning transmission electron microscopy (STEM; model No. Nion UltraSTEM 200, Nion Co, Kirkland, WA, operated at 200 KV) and transmission electron microscopy (TEM; model No. JEOL-2010 TEM/STEM, JEOL Ltd., Tokyo, Japan) were used to study the atomic and crystallographic arrangements at the interfaces and to confirm the epitaxial growth of the layers. To determine surface chemical composition and stoichiometry of the layers, x-ray photoelectron spectroscopy (XPS) was performed using a Riber instrument with an Mg Kα x-ray source. The samples were sputtered by Ar+ bombardment for 5 min prior to acquiring data to remove any probable surface contamination. Interpretation of the XPS results was performed using the SDP ver. 4.1 software. Morphology of the layers was studied by atomic force microscopy (AFM; Veeco make, model No.) as well and the results were interpreted by nanoscope ver. 5.12r3 software. Optical properties of the films were studied by a U-3010 Hitachi UV-Vis spectrophotometer (Hitachi High-Tech, Japan). The room-temperature (RT) photoluminescence (PL) spectra of the samples were recorded with a fluorescence spectrophotometer (Hitachi, F-2500, Hitachi High-Tech, Japan) using an excitation wave length of 300 nm. Meanwhile, to measure the thickness of the films, the samples were masked during deposition and their thickness was determined by a Tencor Alpha Step stylus profilometer (KLA Tencor, Milpitas, CA) and confirmed by cross-section TEM.
III. RESULTS AND DISCUSSION
A. Phase structure
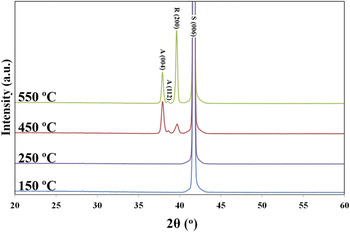
The results from XRD measurement on phase structure of the TiO2 films grown at different substrate temperatures are depicted in Fig. 1. Oxygen partial pressure and laser energy were kept constant at 5 × 10⁻² Torr and 1.5–2.0 J/cm2, respectively for all these samples. As is seen, the layers grown at 150 and 250 °C have an amorphous structure. The formation of anatase phase dominantly occurs at 450 °C and the rutile phase forms at 550 °C. That is, the intensity of the rutile (200) peak increases with the substrate temperature, while decreasing the intensity of the anatase (004) and (112) peaks. Reason of this behavior is that anatase is a metastable phase and it transforms into rutile, which is the thermodynamically favored phase of titania and is stable at higher temperatures. Although phase transformation between the anatase and rutile phases takes place at about 800–900 °C in vacuum,Reference Yoo, Kim, Kim, Hahn, Lee and Cho36,Reference Hou, Zhuang, Zhang, Zhao and Wu37 it is interesting to note that the rutile phase has formed at lower temperatures in our experiments. Previously, epitaxial rutile films were obtained at about 700–800 °C by chemical vapor deposition (CVD) technique.Reference Chen, Mason, Gysling, Paz-Pujalt, Blanton, Castro, Chen, Fictorie, Gladfelter, Franciosi, Cohen and Evans38,Reference Gao, Thevuthasan, McCready and Engelhard39 The reduction in transformation temperature is attributed to the nonequilibrium nature of PLD where the ablated species arriving at the substrate have an energy of nKT (n ∼ 102–103)Reference Singh and Narayan40 and can transfer their extra kinetic energy to the growing layer once they strike the substrate and provide favorable energetic conditions for the aforementioned phase transformation even at lower temperatures than the equilibrium temperature. The thickness of the layers was the same about 250 nm for all of the growth temperatures.
XRD patterns of the TiO2 layers grown at different temperatures.

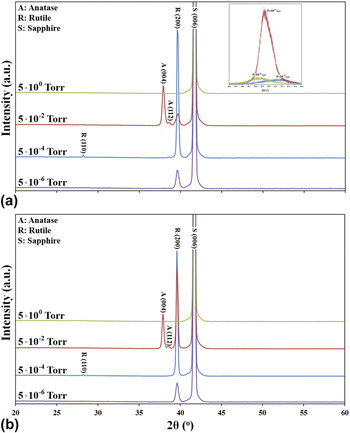
Effect of the oxygen partial pressure on phase structure of the layers fabricated at temperatures of 450 and 550 °C is shown in Figs. 2(a) and 2(b), respectively. It is suggested that the crystallinity of titania layers gets worse at very high pressures, i.e., 5 × 100 Torr.Reference Syarif, Miyashita, Yamaki, Sumita, Choi and Itoh41 The laser-ablated species from the TiO2 target encounter and collide with the O2 molecules under very high oxygen pressures giving rise to reduction of their kinetic energy and thermalization of plasma. Indeed, under high pressures, the plasma from the target is prevented from reaching the surface of the substrate and lack of mobility of the species results in poor crystallinity.Reference Long, Yang, Chen, Li and Lu42 Taking into account the relationship between mobility of the species on the substrate and their kinetic energy,Reference Syarif, Miyashita, Yamaki, Sumita, Choi and Itoh41 it is concluded that the ablated species under high ambient pressures do not have enough mobility when they arrive the substrate and, hence, cannot diffuse to find equilibrium positions during crystallization. One can see that rutile is the predominant phase at lower ambient pressures; in contrast, increasing the pressure results in the formation of anatase phase. Such controllability over volume fraction of the rutile and the anatase phases seems remarkable. In fact, the Ti–O bond length in rutile is longer than that in anataseReference Mo and Ching43 meaning that the Ti–O bond energy in rutile is smaller than in anatase and, thus, the formation of Ti–O bond in the rutile structure is more energetically favored. The packing factors for rutile and anatase unit cells are 0.486 and 0.445, respectively. High-energy species, produced under lower pressures, can diffuse onto the substrate surface easily to find the energetically favored equilibrium sites to occupy them when impinging on the substrate; as a result, a single-phase rutile film is obtained. In contrast, the less dense and metastable state, anatase, can form when the adatoms do not have enough energy to diffuse on the surface. Typically rutile phase does not form under high oxygen pressures. As is seen in the inset of Fig. 2(a), increasing the pressure results in a peak shift toward higher diffraction angles that are closer to the diffraction angle of bulk TiO2. This indicates that the intrinsic residual strain, which has originated due to structural defects, is less in the films grown under higher pressures. There are six different kinds of point defects envisaged in the TiO2 structure, namely titanium interstitial (Tii), titanium vacancy (VTi), oxygen interstitial (Oi), oxygen vacancy (VO), and two antisite defects, TiO and OTi. Each of these defects has specific formation energy (ΔH) under titanium- and oxygen-rich growth conditions. Theoretical estimation of formation energies of antisite and titanium vacancy defects are too high; as a result, they form merely under extreme conditions. However, formation energies of Tii and VO defects are about 2 and 3 eV under Ti-rich (low oxygen partial pressure) growth condition, respectively,Reference Na-Phattalung, Smith, Kim, Du and Wei44 so these defects form easily in TiO2 and may convert to each other via reaction stated in Eq. (1):
 $${\rm{mTiO}}_{\rm{2}} + 2{\rm{nV}}_{\rm{O}} \to (\rm{m - n})TiO_2 + {\rm{nTi}}_{\rm{i}} \quad,$$
XRD patterns of the TiO2 layers grown under different pressures at: (a) 450 °C and (b) 550 °C.

Six Ti–O bonds have to be broken to release a titanium cation; however, only three need to be broken to free an oxygen anion. Besides, the number of possible sites for VO is twice of that for Tii. Therefore, the formation of oxygen vacancies is energetically more favorable than the introduction of a titanium atom into an interstitial site.Reference Na-Phattalung, Smith, Kim, Du and Wei44 According to the inset of Fig. 2(a), the low intensity and large full width at half-maximum (FWHM) of the rutile peak in the film grown under 5 × 10⁻⁶ Torr reveals a poor crystallinity, as using such a low oxygen pressure results in formation of point defects and, hence, decreasing the structure factor that, in turn, decreases the peak intensity.
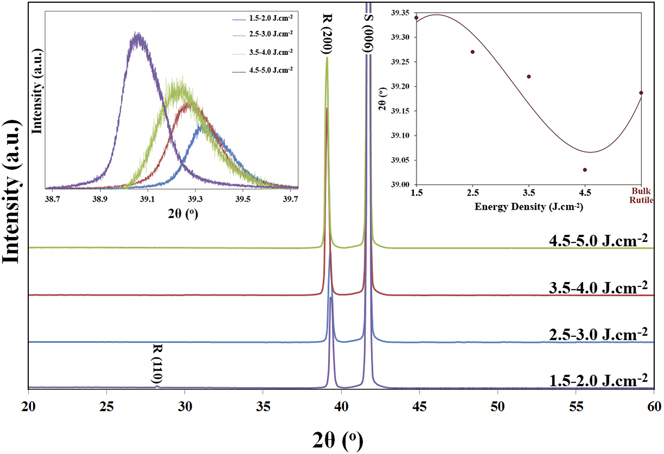
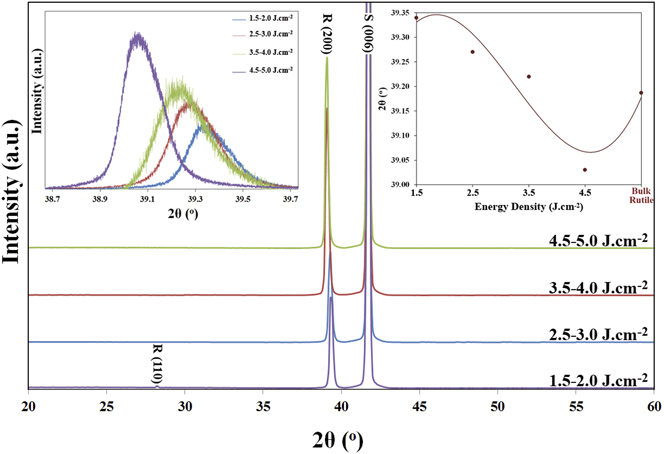
Regarding the intensity and FWHM of the rutile (002) peak, the oxygen pressure of 5 × 10⁻⁴ Torr was selected for next sets of our experiments. In addition, temperature of 450 °C was also selected as the optimum substrate temperature. Figure 3 shows the XRD patterns of the layers fabricated at different laser energies. These results indicate that the growing film assumes a [100] orientation (perpendicular to the substrate surface) and other crystallographic directions disappear when higher energies are used. As shown in inset of Fig. 3, the rutile (200) peak shifts toward smaller 2θ values when the laser energy increases. The reason behind this behavior is yet to be discussed.
Effect of the laser energy on phase structure of the TiO2 layers grown at 450 °C under oxygen pressure of 5 × 10⁻⁴ Torr.
B. Epitaxial relationship and the DME details
For confirming the epitaxial growth and determining the in-plane alignment of the [200] oriented rutile-TiO2 films on the sapphire(0001) substrate, we performed φ-scan XRD where the number of planes of a particular family with the same angle with the film surface is represented by number of the peaks. Figure 4 shows φ-scans of the (01 $\bar 1$2) reflection (2θ = 25.58°, ψ = 57.70°) for the sapphire substrate and the (110) reflection (2θ = 27.44°, ψ = 45.00°) for the rutile film. Due to the 3-fold symmetry of the sapphire (0001) substrate, three (01
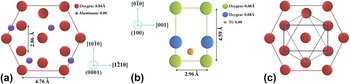
 $\bar 1$2) reflection peaks with 120° intervals are observed. It is also seen from Fig. 4 that 6 strong symmetrical peaks appear with an azimuthal interval of 60° for (110) family of the rutile film. As schematically illustrated in Fig. 5, the rutile film consists of three twin domains rotated by 120°. This is due to the 3-fold symmetry in the hexagonal structure of the sapphire[0001] substrate, which is not present in the tetragonal rutile<100] structure.Reference Chan45 Formation of the twin domain structure becomes understandable if one puts a plane of 2-fold symmetry on a 3-fold-symmetry surface. In this case, three variants rotated by 120° (or 60° if considering an 180° rotation of the 2-fold crystal) on the surface is seen. Thus, formation of the 3-fold twin domain structure in the epitaxial rutile TiO2 film is due to the nucleation and growth of the three variants on the sapphire (0001) substrate.Reference Chan45 According to Fig. 5, the epitaxial relationship between the rutile TiO2 films and the sapphire(0001) substrate is established as rutile(100)||sapphire(0001), rutile[001]||sapphire[10
 $\bar 1$0] and rutile[010]||sapphire[1
 $\bar 2$10]. Here, it should be noted that [010] direction of TiO2 can be parallel to any of the three equivalent [10
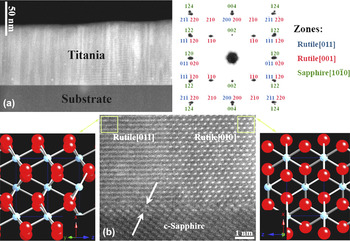
 $\bar 1$0] directions of c-sapphire. Consequently, there are three twin variants in TiO2 film, with a twin boundary angle of 60°. Nucleation of TiO2 in any of these in-plane orientations is equally likely, as these three different orientations of TiO2 are energetically equivalent. Figure 6(a) shows STEM cross section high-angle annular dark-field (HAADF)-image with Z-contrast (STEM-Z) of the rutile/sapphire sample prepared at 450 °C under 5 × 10⁻⁴ Torr where formation of a columnar structure, as a result of the in-plane 60° rotation, is evident. The columnar grain structure indicates that the 3-fold mosaic structure was initiated on the substrate surface via the nucleation of the three variants. Meanwhile, the spotty feature of the selected area electron diffraction (SAED) pattern, taken from the interface between two adjacent rutile grains and the sapphire substrate (rutile [011] and [001] and sapphire[10
 $\bar 1$0] zones), confirms the formation of an epitaxial film. The indexed SAED pattern is consistent with the schematic illustration shown in Fig. 5 and further ascertains the proposed epitaxial relationship. The in-plane rotation of the grains is observed in Fig. 6(b) where formation of atomically sharp interfaces between the grains and the substrate is notable. This image shows 2 adjacent grains with [001] and [011] in-plane orientations aligned with sapphire [10
 $\bar 1$0] direction that is consistent with the schematic illustration in Fig. 5.
φ-scan XRD of the TiO2 film grown at 450 °C under 5 × 10⁻⁴ Torr oxygen pressure with energy density of 3.5–4.0 J/cm2: (a) sapphire (01 $\bar 1$2) and (b) rutile (110) reflections.

Schematic drawing of (a) sapphire (0001) plane, (b) rutile (001) plane, and (c) epitaxial relationship of rutile (200) on c-sapphire.

STEM cross section images: (a) ADF image of the rutile TiO2 film on sapphire substrate and the indexed TEM-SAED pattern, and (b) high resolution image of two adjacent rutile grains with two different in-plane orientations. Formation of Ti2O3 inter layer is shown by arrows.

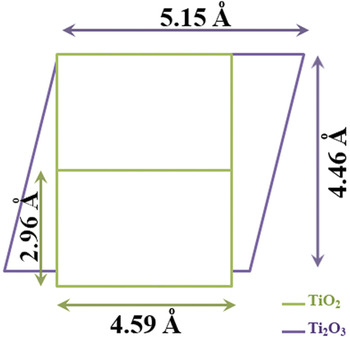
It was already found by our group that an oxygen-deficient intermediate layer grows on the sapphire substrate before formation of the top.Reference Zhou, Chisholm, Yang, Pennycook and Narayan46,Reference Bayati, Molaei, Narayan, Narayan, Zhou and Pennycook47 Here, in the TiO2 system, the rutile film initially grows pseudomorphically on the sapphire substrate as Ti2O3 that has a rhombohedral structure (in bulk: a = b= 5.15 Å, c = 13.61 Å, γ = 120°) and is isostructural with sapphire (a = b = 4.76 Å, c = 12.99 Å, γ = 120°)Reference Afifi, Abdel-Aziz, Yahia, Fadel and Wahab48; however, after a few monolayers, rutile starts growing tetragonally on the Ti2O3/sapphire(0001) platform, as shown in Fig. 6(b). The possible atomic arrangement at the TiO2/Ti2O3 interface is schematically illustrated in Fig. 7. The matching of lattice parameters produces strain in the film that is relaxed by formation of misfit dislocations at the film/substrate interface.
Schematic illustration of crystallographic orientation at the TiO2/Ti2O3 interface.

According to Fig. 7, lattice misfits at the rutile/Ti2O3 interface are calculated as εb = +3.57% εc = +28.15% where εb and εc are the lattice misfits along b and c directions of the TiO2 film. According to the domain-matching epitaxy (DME) paradigm,Reference Narayan and Larson49 the misfit along b-direction is accommodated by matching of 28 planes of the film with 27 planes of the substrate with a frequency factor of zero. Meanwhile, the misfit strain along the c-direction of rutile is relaxed when 4/3 and 3/2 domains alternate with a relative frequency of 0.55.
In summary, pure rutile single crystalline films were grown at temperatures lower than the temperatures used by others.Reference Chen, Mason, Gysling, Paz-Pujalt, Blanton, Castro, Chen, Fictorie, Gladfelter, Franciosi, Cohen and Evans38,Reference Gao, Thevuthasan, McCready and Engelhard39
C. Morphology
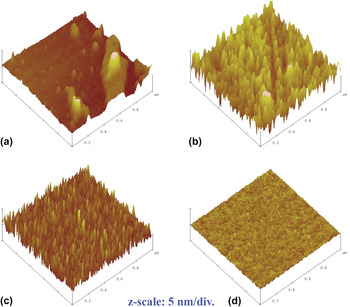
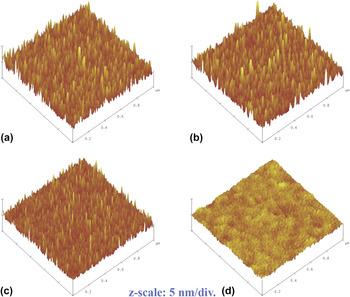
AFM images of the films deposited at 450 °C under different oxygen pressures, in a 1 × 1 μm scale, are shown in Fig. 8 where formation of nanostructured films is evident. A nonuniform surface is obtained at high oxygen partial pressure, i.e., 5 × 100 Torr. The surface roughness of the samples was determined as 13.1, 11.8, 8.1, and 1.5 nm for the ambient pressures of 5 × 100, 5 × 10⁻², 5 × 10⁻⁴, and 5 × 10⁻⁶ Torr. As it was explained earlier, the adatoms have relatively low energy and mobility on the substrate when deposition is performed under high pressures. Consequently, they are quenched and sit wherever they arrive in the substrate. As a result, surface diffusion to form a smooth surface is not appreciable. In contrast, as the oxygen pressure decreases, the kinetic energy of the species increases. Under such circumstances, their mobility is high enough to diffuse on the substrate surface and form a smooth surface. The effect of laser energy on the surface morphology of the samples, fabricated at 450 °C and 5 × 10⁻⁴ Torr, is depicted in Fig. 9. The surface roughness of the samples was measured as 8.1, 7.9, 6.3, and 2.1 nm for the laser energies of 1.5–2.0, 2.5–3.0, 3.5–4.0, and 4.5–5.0 J/cm2. Thickness of the layers was respectively measured as 170, 275, 335, and 450 nm for the laser energies of 1.5–2.0, 2.5–3.0, 3.5–4.0, and 4.5–5.0 J/cm2.
AFM surface morphology of the TiO2 films grown at 450 °C under various oxygen pressures: (a) 5 × 100, (b) 5 × 10⁻², (c) 5 × 10⁻⁴, and (d) 5 × 10⁻⁶ Torr.

AFM surface morphology of the TiO2 films grown at 450 °C and 5 × 10⁻⁴ Torr with applying different laser energies: (a) 1.5–2.0, (b) 2.5–3.0, (c) 3.5–4.0, and (d) 4.5–5.0 J/cm2.

D. Stoichiometry
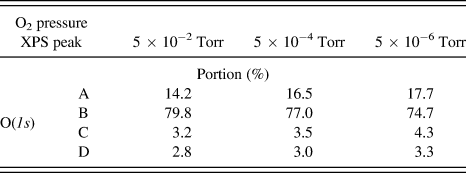
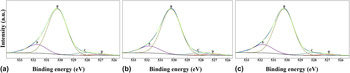
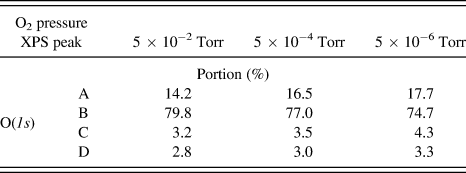
For studying the stoichiometry as well as defects content of the layers, XPS technique was used. Figure 10 shows O(1s) core level binding energies for the TiO2 layers grown under various pressures which have been deconvoluted into 4 distinct peaks using the Gaussian function. The peak A, located at a binding energy of ∼531.7 eV, corresponds to the O2- ions in oxygen deficient regions (in Ti2O3 compound). To preserve the charge neutrality of the crystal, two Ti4+ cations must convert to two Ti3+ cations when an oxygen vacancy forms. The electron charge density in the region of a VO is reduced which results in less screening of the O2−(1s) electrons from the nuclei.Reference Mal, Nori, Jin, Narayan, Nellutla, Smirnov and Prater50 Hence, the peak A can represent the VO defects and its intensity is associated with the concentration of oxygen vacancies (VO). The peak B, with a binding energy of 530.2 eV, is assigned to the oxygen ions in the crystalline lattice of TiO2. The peaks C and D, which respectively have binding energies of 528.2 and 527.1 eV, may represent oxygen atoms in contact with  $\mathop {{\rm{Ti}}}\nolimits_{\rm{i}}^{3 + }$ and
 $\mathop {{\rm{Ti}}}\nolimits_{\rm{i}}^{4 + }$ defects. The Tii neutral atom donates three or four electrons to the host crystal and transforms to Ti3+ or Ti4+ ions.Reference Finazzi, Valentin and Pacchioni51 The released electrons are captured by Ti4+ lattice cations. Therefore, lattice Ti2+and Ti3+ cations, represented by the peaks C and D, form. Portion of all these peaks for different oxygen pressures are listed in Table I. Results reveal that amount of the lattice disorder, which is represented by the peaks A, C, and D in O(1s) core level, increases when oxygen pressure decreases. A small peak shift is also observed for these peaks due to variation of defect concentrations. The formation of point defects in TiO2 may be described by the following equilibriaReference Kroger52–Reference Nowotny, Sheppard, Bak and Nowotny54:
 $${\rm{O}}_{\rm{O}}\,⇋\,{\rm{V}}_{\rm{O}} + 2{\rm{e + }}{\raise0.5ex\hbox{$\scriptstyle {\rm{1}}$}\kern-0.1em/\kern-0.15em\lower0.25ex\hbox{$\scriptstyle {{2}}$}}\rm{O}_2 \quad,$$
 $$2{\rm{O}}_{{\rm O}} + \rm{Ti_{Ti}}\,⇋\,{\rm{Ti}}_{\rm{i}} ^{3 + } + 3e + O_2 \quad,$$
 $$2{\rm{O}}_{\rm{O}} + \rm{Ti_{Ti}}\,⇋\,{\rm{Ti}}_{\rm{i}} ^{4 + } + 4e + O_2 \quad,$$
XPS O(1s) core level binding energies in the TiO2 films grown under oxygen pressures of: (a) 5 × 10⁻², (b) 5 × 10⁻⁴, and (c) 5 × 10⁻⁶ Torr.

Portion of the XPS peaks for different oxygen pressures.
Considering reactions contained in Eqs. (2)–(4), it can be concluded that oxygen pressure plays a significant role in the formation or removal of all point defects in TiO2 crystalline structure. Regarding these reactions, concentration of the lattice defects may be expressed as a function of p(O2) through the following reactionsReference Bak, Nowotny, Rekas and Sorrell55:
 $$[{\rm{V}}_{\rm{O}} ]\, \propto \,{\rm{p(O}}_{\rm{2}} )^{ - 1/2} \quad,$$
 $${\rm{[Ti}}_{\rm{i}} ^{3 + } ]\, \propto\, {\rm{p(O}}_{\rm{2}} )^{ - 1} \quad,$$
 $${\rm{[Ti}}_{\rm{i}} ^{4 + } ]\, \propto\, {\rm{p(O}}_{\rm{2}} )^{ - 1} \quad.$$
Taking Eqs. (5)–(7) into closer consideration, it can be suggested that lowering the growth oxygen partial pressure results in an increase of concentration of point defects. Meanwhile, concentration of Tii defects increases more rapidly with decreasing the oxygen pressure.
O(1s) core level binding energies of the layers at different laser energies at substrate temperature of 450 °C under ambient pressure of 5 × 10⁻⁴ Torr are depicted in Fig. 11. It is worth reminding that the peaks A, C, D were assigned to the disordered titania and the peak B was attributed to the perfect titania lattice. Portion of the peak B was respectively calculated as 78.1, 81.0, and 78.5% for the laser energies of 2.5–3.0, 3.5–4.0, 4.5–5.0 J/cm2. These results and those presented in Table I (laser energy of 1.5–2.0 J/cm2) reveal that using medium energies, namely 3.5–4.0 J/cm2, gives rise to formation of crystalline structures with fewer defects. At very low laser energies, i.e., 3.5–4.0 J/cm2, the adatoms are not mobile enough to diffuse to proper lattice positions. On the other hand, more defective films grow when much higher energies, i.e., 4.5–5.0 J/cm2, are applied, as a massive flux of the ablated particles from the target form and, hence, the deposition rate is raised. At higher deposition rates, films with higher defect contents are grown.
XPS O(1s) core level binding energies in the TiO2 films grown under oxygen pressure of 5 × 10⁻⁴ at 450 °C with laser energies of: (a) 2.5–3.0, (b) 3.5–4.0, and (c) 4.5–5.0 J/cm2.

E. Optical properties
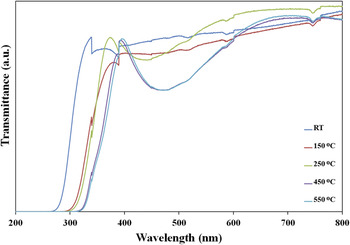
Figure 12 shows the transmittance spectra of the titania layers grown at various substrate temperatures. The sharp fall in transmittance below 400 nm is due to the onset of fundamental absorption of TiO2. To eliminate effects from the sapphire substrates, a single-side polished c-sapphire was used as reference in all optical measurements. As is seen, this edge shifts toward longer wave lengths when the deposition temperature increases. Reason of this behavior can be found in the band gap difference between the rutile and the anatase phases. The anatase phase has a band gap energy of around 3.2 eV, while that of the rutile phase is about 3.0 eV,Reference Fujishima, Zhang and Tryk24 so increasing the rutile fraction results in decreasing band gap energy of the deposited film.
Transmittance spectra of the layers grown at different substrate temperatures.

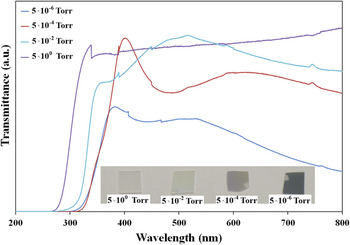
Transmittance spectra of the films fabricated at 450 °C under various oxygen pressures are displayed in Fig. 13. As is seen in inset of this figure, lowering the pressure give rise to growth of films with a darker (dark blue) color. Films grown under higher pressures show a very high transmittance (∼75–90%) in the visible region, while transmittance of the film fabricated at 5 × 10⁻⁶ Torr is less than 45% asserting growth of a film with a high defect concentration. Sharper transmittance edge indicates a reduction of point defects in the films as well.Reference Mal, Nori, Jin, Narayan, Nellutla, Smirnov and Prater50 It can be also observed that the absorption edge shifts toward longer wave lengths at lower oxygen pressures. Reason of this behavior is formation of more anatase phase under higher pressures, which has a wider band gap than the rutile phase, as elucidated earlier. Hence, the optical results are in a good agreement with the XRD results (Figs. 1 and 2).
Transmittance spectra of the layers grown under various oxygen pressures.

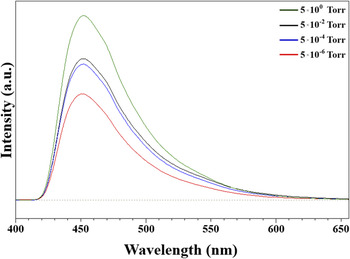
To further shed light on the defect structure of the samples, photoluminescence (PL) spectroscopy technique was used as well. Figure 14 shows the emission PL spectra of the rutile films grown under different pressures at 450 °C. The excitation wave length of 300 nm was used for all samples. Meanwhile, all emissions having wave lengths shorter than 420 nm were eliminated by a filter to highlight the peaks from the energy levels of defects. The wide emission peak located at wave length of about 450 nm is attributed to the defect levels, e.g., oxygen vacancy. Any change in the PL intensities can be related to the recombination rate between the photogenerated electrons and holes.Reference Baiju, Zachariah, Shukla, Biju, Reddy and Warrier56,Reference Cong, Zhang, Chen and Anpo57 As the trap levels play a positive role in reducing the recombination, low PL intensity is ascribed to a lower recombination rate, and, hence, a higher defect concentration. Therefore, it is again confirmed that decreasing the oxygen pressure results in the formation of more point defects.
Room temperature PL spectra of the TiO2 films grown at 450 °C under various pressures.

IV. CONCLUSIONS
Rutile thin films with a <100] orientation on sapphire(0001) substrate were grown epitaxially via PLD method. It was found that the rutile phase forms at elevated temperatures and low ambient pressures; meanwhile, increasing the laser energy gave rise to film growth along [200] orientation and elimination of any other crystallographic orientations. The epitaxial relationship between the substrate and the rutile film was established as rutile(100)||sapphire(0001), rutile[001]||sapphire[10 $\bar 1$0] and rutile[010]||sapphire[1
 $\bar 2$10]. UV-Vis spectrophotometry, PL, and XPS investigations showed that concentration of lattice point defects, namely oxygen vacancies and titanium interstitials, increases at lower oxygen pressures. Films with smoother surfaces were obtained at higher laser energies and lower oxygen pressures.
ACKNOWLEDGMENTS
The financial support of the U.S. National Science Foundation (Grant No. 0803663) is highly appreciated.