Public opinion polarization (POP) affects a society's ability to reach consensus on a set of issues in the political arena. As POP grows, the likelihood rises that social groups with irreconcilable policy preferences will be formed (DiMaggio, Evans and Bryson Reference DiMaggio, Evans and Bryson1996, 693). As a consequence, public arenas are divided into adverse groups that are increasingly unable to cooperate because of their contradictory positions. This, in turn, may lead to an increase in conflicts within a society. Moreover, POP translates into the political sphere as citizens engage in politics and politicians respond to the preferences of their respective constituencies (their electoral bases) (Abramowitz Reference Abramowitz2006, 73). This influence can impair a political system's capacity for reform and effective policy making (Galston and Nivola Reference Galston and Nivola2006; Brady, Ferejohn and Harbridge Reference Brady, Ferejohn and Harbridge2008).
Following discussions on elite polarization,Footnote 1 several prominent review articles by Fiorina and Abrams (Reference Fiorina and Abrams2008), Hetherington (Reference Hetherington2009), and Fischer and Mattson (Reference Fischer and Mattson2009) highlight the increasing scientific interest in POP. However, research on POP to date has largely been confined to the US context and centers around the question of whether American public opinion is more polarized today than in the past.Footnote 2 In a key study, DiMaggio, Evans and Bryson (Reference DiMaggio, Evans and Bryson1996) investigate opinion polarization in the United States, relying on different measures and using data both from the General Social Survey and the National Election Survey, spanning a period of 20 years. They find a trend towards consensus on racial, gender and crime issues; stability on numerous others; and evidence of polarization only on attitudes toward abortion, the poor and (more recently) sexual morality. The conclusions drawn by DiMaggio, Evans and Bryson (Reference DiMaggio, Evans and Bryson1996) were confirmed by Evans (Reference Evans2003), who used additional data. These and other studies identify increasing trends of polarization only for sub-groups of partisans—measured either by party affiliation or self-identification between liberals and conservatives—and secular versus religious voters (Abramowitz and Saunders Reference Abramowitz and Saunders2005; Bafumi and Shapiro Reference Bafumi and Shapiro2009; DiMaggio, Evans and Bryson Reference DiMaggio, Evans and Bryson1996; Fiorina, Abrams and Pope Reference Fiorina, Abrams and Pope2005; Layman and Carsey Reference Layman and Carsey2002). In another widely noticed study, Baldassarri and Gelman (Reference Baldassarri and Gelman2008) analyze polarization across a variety of attitudes and conclude that opinion changes in the United States reflect more a resorting of party labels among voters than greater polarization across issues. Only recently have a few studies started to investigate POP in Europe. Adams, Green and Milazzo (Reference Adams, Green and Milazzo2012a,Reference Adams, Green and Milazzob) find a depolarizing trend within the British public between 1987 and 2001 that mimics an analogous trend in the political system, that is, between Labour and the Tories. Adams, De Vries and Leiter (Reference Adams, De Vries and Leiter2011) diagnose similar developments for the Netherlands between 1986 and 1998. Finally, Down and Wilson (Reference Down and Wilson2010) focus on a single opinion item (respondents’ support for their country's EU membership) and investigate the causal link between opinion polarization and interparty competition in Europe.
Given the rising scholarly interest in the United States, and the relevance of the phenomenon for contemporary democratic states, it is astonishing that, with the exceptions just mentioned, polarization has been largely neglected within the realms of European political science. In our study we pursue the following research question: How has public opinion polarization in Germany developed over the last decades? To our knowledge, this is the first study that investigates POP in Germany. Following Baldassarri and Gelman (Reference Baldassarri and Gelman2008, 409), we conceive POP as alignment along multiple attitude scales.Footnote 3 As we will argue in detail, this conception and corresponding measurement has several advantages over other measures of POP. In general, we pursue a descriptive research agenda,Footnote 4 and our study serves as a point of comparison for both existingFootnote 5 and future research. We find that public opinion polarization has decreased over the last three decades in Germany. In particular, highly educated and more politically interested people have become less polarized over time. However polarization seems to have increased regarding attitudes towards gender issues.
We first outline our conception of POP and demonstrate its theoretical advantages and the practical benefits of our measurement approach. Next, we present the data and offer an initial overview of the attitude scales taken into consideration. We then describe our modeling strategy and delineate the empirical results, first with regards to attitude alignment within the whole population, then focusing on several sub-groups. Several robustness checks complete the analysis. The article concludes with a discussion of the results and their implications for future research.
Conception and measurement of pop
A population may be polarized with regard to a single issue—for example, the question of legalizing abortion—or it may comprise people who are polarized on many issues. In the latter case, a population may be divided along multiple lines, for example pro-abortionists versus anti-abortionists, weapon haters versus weapon fanatics and proponents of state intervention versus advocates of a free market. However, we argue that POP only generates the previously mentioned negative effects if these groups overlap—for example, if anti-abortionists, weapon haters and state interventionists are in one camp that stands against the camp of anti-abortionists, pro-weapon fanatics and free market proponents. In other words: “[I]f people align along multiple, potentially divisive issues, even if they do not take extreme positions on single issues, the end result is a polarized society” (Baldassarri and Gelman Reference Baldassarri and Gelman2008, 409). Following this logic, POP is conceived here as alignment along multiple scales that measure attitudes towards different issues. A conventional measure of alignment is the correlation coefficient, which is higher when individuals have similar attitudes, that is, choose similar positions on two different attitude scales. Subsequently, one may take averages across pairwise correlations for groups of attitude scales that belong to certain issue dimensions or for all attitude scales.
The correlation measure features two useful characteristics. First, as the correlation between attitude scales increases, the variance of the average opinion score distribution grows as well (Baldassarri and Gelman Reference Baldassarri and Gelman2008, 419). An individual's average opinion score is simply the average of his or her positions on the combined scales. The average score distribution is then the distribution of all individual average opinion scores. In other words, the higher the correlation between these scales, the higher the share of individuals with extreme opinions on average across all scales. Hence, the correlation measure also accounts for extremities in attitudes. Secondly, populations can be divided into opposing clusters, which captures the idea of camps opposing each other across a number of issues. Baldassarri and Gelman (Reference Baldassarri and Gelman2008, 419) show analytically for a four-dimensional case that the distance between individuals who belong to the same cluster decreases, while the distance between alternative clusters increases as the correlation between attitude scales increases. In other words, for high levels of polarization, the average distance between individuals within a certain cluster is lower. As the correlation decreases, it is also harder to predict values on different attitude scales based on an individual's position on one specific attitude scale.Footnote 6
In the following description, which draws on DiMaggio, Evans and Bryson (Reference DiMaggio, Evans and Bryson1996, 696–97), it becomes apparent that the multi-issue conception of POP is better able to capture general trends of polarization than measures that focus on single issues. Imagine a society in which individuals are highly polarized—that is, they have extreme positions on different issues. At the same time, these individuals show no alignment with regards to their different attitude scale positions: two individuals may be close to each other on one scale, but take up completely opposed positions on the next scale. Instead of large stable camps that occupy the same position on several attitude scales, such a society will be characterized by groups that huddle around positions on single attitude scales, only to subsequently dissolve due to the heterogeneity of their positions on different scales. As a consequence, the probability for political conflict is lower than in the case of strongly correlated (aligned) attitude scale positions (Fiorina and Abrams Reference Fiorina and Abrams2008, 577).
Methodology
Data, Item Selection and Rating
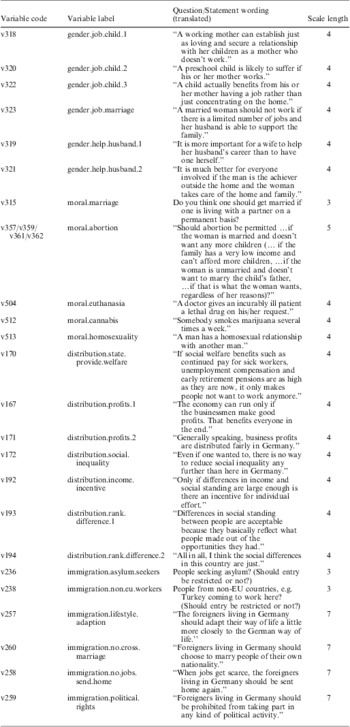
We rely on time-series data generated from the Allgemeine Bevölkerungsumfrage der Sozialwissenschaften (ALLBUS), the German equivalent of the General Social Survey. The ALLBUS was conducted 17 times (usually every two years) between 1980 and 2010.Footnote 7 In the first step, we identified 24 questions that query attitudes of political and societal relevance and have been asked at least three times in the period under consideration. Table 1 gives an overview of the respective items used in the analysis, the variable labels we chose and the length of the scale on which they are measured. Deciding whether an item is about political attitudes or not is naturally somewhat arbitrary. Some items directly target potential policy outcomes (for example, immigration.asylum.seekers), while others encompass more general values that can, however, be perceived as fundamental for more concrete policies (for example, gender.job.child). The selection of items likely does not comprise all attitudes of relevance concerning political debates in Germany, due to the data source. One potentially interesting item was the question on the use of nuclear power, which could not be used as it was asked only once. Other subjects, like foreign policy evaluation, were never included in the ALLBUS survey. To check whether the results are heavily shaped by the specific item selection, we provide further analyses with sub-sets of the used variable set in our section on robustness below.
Question Wording for Items Used in the Analysis from the ALLBUS 1980–2010

Note: statements are generally introduced by an explanatory text and ask for the respondent's degree of agreement. For the full documentation, see the ALLBUS Data Handbook (http://info1.gesis.org/dbksearch/file.asp?file=ZA4572_cdb.pdf, accessed 17 April 2013).
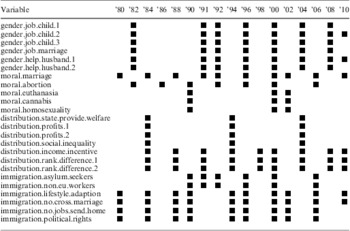
Judging absolute levels of polarization is a rather difficult endeavor, since we do not have any absolute scales for polarization. In contrast, judging trends is easier and relevant when taking the current discussion into account (Fiorina and Abrams Reference Fiorina and Abrams2008, 567). Our measurement is therefore the correlation between attitudes towards different issues.Footnote 8 By using this measurement, we avoid the problem of missing data on many variables for certain waves, as the units of observation are issue pairs rather than individuals.Footnote 9 The computed correlations are based on pairwise-complete observations. Table 3 in the appendix shows that some items were asked only two or three times, but by no means in every wave. This is not as problematic as it might seem for a trend analysis. Even though pairs of attitudinal items are not asked in every wave, their correlations—if present in at least two waves—serve as informative data points for the multilevel model, which is described in more detail below. We can make use of a total of 54,243 individual observations and 806 issue-year specific correlation pairs.
In the second step, students and researchers (seven in total) classified the items according to more general topics. This procedure could be plainly described as a “manual exploratory factor analysis”. The resulting grouping enables us to trace different levels and trends of POP not only for the complete sample of attitude scales, but also for sub-samples of attitude scales that belong to one of the finally identified issue dimensions. Four of the seven raters chose a four-dimensional solution, and most of the items were classified into similarly labeled dimensions. The only noteworthy disagreements concerned some of the (later labeled) immigration items, more specifically the ones stating that “foreigners living in Germany should choose to marry people of their own nationality” and “when jobs get scarce, the foreigners living in Germany should be sent home again” (see Table 1). The former was also classified into the moral dimension, the latter into the economic. We ran the analysis again without these items, and the results remained largely unchanged. We therefore decided to use the four-dimensional solution with all items, and labeled the dimensions (according to suggestions from the raters) as “gender”, “moral”, “distribution” and “immigration”.Footnote 10 Finally, in cases where questions were formulated negatively with regard to the respective issue dimension they belonged to, we turned them around so that the answer categories follow the direction of the respective dimension (for example, liberal → conservative moral attitudes; cf. Baldassarri and Gelman Reference Baldassarri and Gelman2008).Footnote 11 Hence, we expect most of the pairwise correlations to be positive, which simplifies the interpretation of the estimated trends.
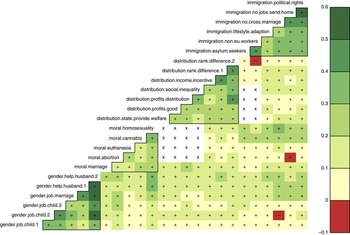
Figure 1 provides an initial overview of the 252 attitude scale pairs under consideration. These correlations are also an initial, aggregated view of our outcome variable. As items were switched according to their respective dimension, most attitude scale pairs are positively correlated, and the correlations among scales belonging to the same issue dimension (framed by black triangles) tend to be higher than correlations between scales belonging to different dimensions. Also note that for some attitude scale pairs, we did not observe any correlations (for example, the pair moral.sexuality – distribution.profits.good), as the corresponding items were never administered in the same waves. This is not a serious problem for the estimation method we apply. Although it provides only a static view of the set of attitude scale pairs, the plot gives a first impression of POP in Germany (if it is perceived as a state rather than a process).Footnote 12 Higher correlations within the four issue dimensions (around 0.2 to 0.6) show that within policy domains, public opinion is rather structured; that is, there is a tendency towards polarization on, for example, family or immigration politics. The correlation in the upper-right corner indicates that if a respondent thinks that “when jobs get scarce, foreigners living in Germany should be sent home” (item immigration.no.jobs.send.home), he also has a higher probability of approving the statement that “foreigners living in Germany should be prohibited from taking part in any kind of political activity” (immigration.political.rights). More important, however, is the observation that the correlation between dimensions is low to very low (almost always less than 0.2, and often there is no statistical relationship at all). This means that there is little alignment across different policy domains. If we know only that a respondent agrees with the statement “a child actually benefits from his or her mother having a job rather than just concentrating on the home” (gender.job.child.3), we cannot infer much about how the respondent thinks about homosexuality (moral.homosexuality), social welfare benefits (distribution.state.provide.welfare) or asylum seekers (immigration.asylum.seekers)—the mean correlations with all of these items are virtually zero. This is the empirical manifestation of what we expressed theoretically above when we argued that POP is only a serious issue if people align along multiple issues and build overlapping groups. This does not seem to be the case when interpreting the aggregated correlations. There are stronger relationships for some pairs of variables, for example, opinions on homosexuality and agreement with the statement that “foreigners living in Germany should choose to marry people of their own nationality” (immigration.no.cross.marriage). However the average correlations in Figure 1 do not tell us anything about the evolution of alignment, that is, polarization. The corresponding trends are assessed in a slightly more complex modeling framework, which is presented in the following section.
(Colour Online) Mean correlations of the 252 attitude scale pairs (across all years for the specific pair) Note: positive correlations are colored light to dark green, negative correlations red. Correlation direction is further indicated by plus and minus signs. An ‘X’ indicates that no observations were available. Black triangles frame correlations of items within the four issue dimensions “gender”, “moral”, “distribution” and “immigration”.

Estimating Public Opinion Polarization Trends
To estimate the time trends of polarization, we employ a multilevel approach, using the year-specific correlation of pairs of attitude scales as a dependent variable and the pairs themselves as units on the second level. The explanatory variable is time t ranging from 1980 to 2010. For a better interpretation (and because we are interested in long-term effects), the time variable has been rescaled to decades and centered at 1994. The basic model (Model A) is specified as follows:
 $${{\rho }_{pt}}\, = \,{{\alpha }_p}\, + \,{{\beta }_p}t\, + \,{{{\epsilon}}_{pt}},$$
with  $$$ {{\rho }_{pt}} $$$
representing the correlation of attitude scale pair p in the year t.Footnote 13 Both the intercept α and the trend coefficient β are allowed to vary over attitude scale pairs. In other words, we estimate attitude scale pair-specific levels of average correlation (intercept) and time trend (slope).
 $$$ {{{\epsilon}}_{pt}} $$$
is the attitude scale pair year-specific error term, which is assumed to follow a normal distribution. Implementing a multilevel approach serves at least two purposes. First, the estimation of some trends may be unstable, especially when a specific pair of issues is only observed for a few years. The varying-intercept, varying-slope approach allows us to explicitly capture this uncertainty in the estimates. Secondly, simply estimating an overall trend is only the first step of our analysis. In order to obtain a finer-grained picture of POP trends, we are also interested in looking at issue-dimension-specific correlation trends. The estimated variation in the multilevel models gives us exactly this kind of information.
While Model A provides an estimate for the overall trend of POP (the average of  $$$ {{\beta }_p} $$$
across all pairs,
 $$$ {{\beta }_p}\, \rightarrow \,\beta $$$
) and issue-pair-specific trends, we respecify the basic model in several ways. In Model B, we estimate trends of attitude scale pairs that are located within or between issue dimensions. More precisely, it allows us to evaluate separate trends for within-dimension attitude scale pairs and between-dimension attitude scale pairs. Here, the time trend variable is interacted with a dummy variable that indicates whether the two attitude scales belong to the same or different issue dimensions. Thus we can determine whether attitude alignment between attitude scales belonging to a certain dimension has risen more than alignment between attitude scales that belong to two different dimensions. Model C introduces four groups that correspond to the three issue dimensions and a group for cross-dimension pairs (that is, the group of attitude scale pairs that do not belong to the same dimension). As ever,
 $$$ {{\rho }_{pt}} $$$
is the correlation of a pair of attitude scales at point t in time and the group level is a specific pair. The trend term is now interacted with a variable that indicates the attitude scale pairs belonging to a certain issue dimension.
When moving to the sub-group analyses, we simply divide the sample of respondents according to certain characteristics (gender, education level, income, political interest, religious denomination and East versus West). Statistically, the models follow the known specification.
Findings
Attitude Alignment within the German Population
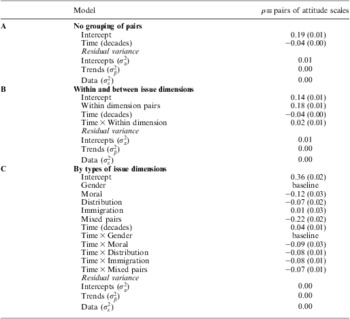
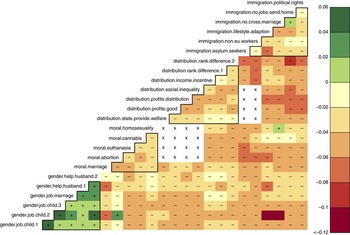
Table 2 displays the results of our investigations of attitude alignment. As described in the previous section, Model A reports the trend across all attitude scale pairs. The average correlation between scales is 0.19 with a standard error of 0.01. The average correlation has decreased by 0.04 per decade; hence, there is a negative trend. This result is highly significant. However when looking at the pair-specific trends, the picture becomes much more heterogeneous. Figure 2 displays the coefficients for all attitude scale pairs over time. They range from −0.15 to 0.04. One can observe that the correlation has decreased in most of the cases. Interestingly, the cluster of attitude scales belonging to the gender dimension (at the bottom left of the triangle plot) shows a systematically rising trend of correlations. These items have been asked seven to eight times since 1982, so opinions on these issues are well captured. We will elaborate on this finding later. Among the other item pairs, the size of the decrease varies to a certain extent. On average, it is strongest for pairs of items of the distribution and the immigration dimension. Three item pairs show a positive correlation trend, but there is no systematic alignment over different dimensions. In general, with the exception of the gender domain, Figure 2 reveals a decrease in attitude alignment for all other issue pairs—both within and across domains. The overwhelming majority of negative trends (only 18 of the 252 estimated trends are positive), especially between dimensions, is a strong indicator of public opinion depolarization rather than polarization.
Fitted Multilevel Models (Varying Intercept and Varying Slope) for Attitude Alignment

Note: number of observations: 806, number of item pairs: 252. Numbers in parentheses are standard errors. The intercepts correspond to the estimate of 1994 as the time variable is zeroed at this point of time (and rescaled to decades).
(Colour Online) Correlation trends of the 252 item pairs over time Note: the plotted coefficients are based on Model A (‘no grouping of pairs’). Decreasing trends are colored beige to red, increasing trends light to dark green. Trend direction is further indicated with positive and negative signs. An ‘X’ indicates that no observations were available. Black triangles frame correlations of items within the four issue dimensions “gender”, “moral”, “distribution” and “immigration”.

Back to Table 2, Model B is slightly more sophisticated in that the attitude scale pairs are grouped into pairs that belong to the same issue dimension and pairs that belong to two different dimensions. Naturally, pairs that belong to the same dimension should display higher levels of correlation. Here, the estimate of intercept of 0.14 represents the average correlation for between-dimension pairs. The intercept for the group of within-dimension pairs is, as expected, much larger (0.14 + 0.18 = 0.32). Moreover, we can observe a decreasing trend of the average correlation of between-dimension pairs (−0.04), however, the trend among within-dimension pairs is less developed (−0.04 + 0.02 = −0.02). This finding strengthens our initial impressions of the data in Figure 1. Levels of alignment across different policy domains (which are not very high anyway) seem to decrease even more sharply than alignment within policy domains. There is no increasing trend of correlation over multiple issues, which is another strong indicator of public opinion depolarization.
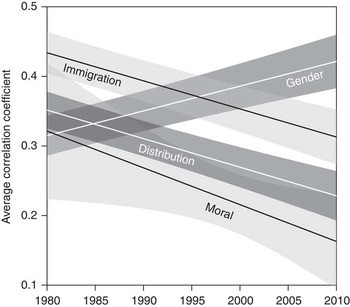
Since the results only differentiate within-dimension and between-dimension pairs on average, we set up another model that accounts for dimension-specific time trends (Model C) by interacting the trend variable with dimension indicators and an indicator for mixed pairs, that is, pairs from different dimensions. On average, the correlation within these dimensions is 0.36 for issue pairs from within the gender dimension, 0.21 for the moral dimension, 0.29 for the distribution dimension and 0.37 for the immigration dimension. What is already visible when looking at Figure 2 is now reflected in the numbers. While gender issues show a positive (increasing) correlation trend, the time effect of all other dimensions is negative. The dimension-specific trends are again visualized for the whole time period under consideration in Figure 3. Model C reveals the evidence for a trend of polarization on the gender dimension. The diagnosed trends are disentangled in a more disaggregated analysis in the following section.
Correlation trends by issue dimension, over time Note: the lines are based on the effects presented in Model C (‘By types of issue dimensions’). Shaded areas represent 90 per cent confidence intervals.

Attitude Alignment within Sub-populations
So far, we have described several noticeable overall trends of POP. Nonetheless, it may be the case that these effects are driven by trends that only concern parts of the German population. One of the drawbacks of our conceptional and empirical approach to public opinion polarization is that we cannot directly integrate individual-level indicators of status, educational background and so forth, as our level of analysis is that of aggregated survey measures. In order to check whether the effects remain robust or vary over sub-groups, we split the sample into several groups a priori according to socio-economic and other strata, and then estimate group-specific levels and trends.
For instance, it is generally argued that changes in public opinion (polarization) originate within intellectual elites and resonate first among the highly educated and politically interested (Zaller Reference Zaller1992; Adams, Green and Milazzo Reference Adams, Green and Milazzo2012a; Baldassarri and Gelman Reference Baldassarri and Gelman2008; Abramowitz and Saunders Reference Abramowitz and Saunders2005). Hence these groups may be pioneers in public opinion trends. Moreover, we deem it relevant to search for diverging trends among sub-populations of gender (Shapiro and Mahajan Reference Shapiro and Mahajan1986) and income (McCall and Manza Reference McCall and Manza2011).Footnote 14 A further sub-populations that merits attention is different religious denominations (Jelen Reference Jelen1990). Finally, public opinion trends may differ between East and West Germany, making this another relevant sub-group division (Wegener and Liebig Reference Wegener and Liebig1995).
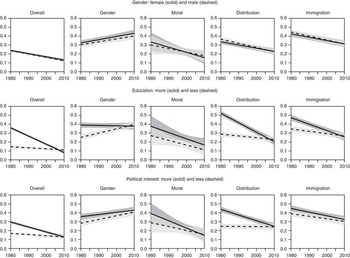
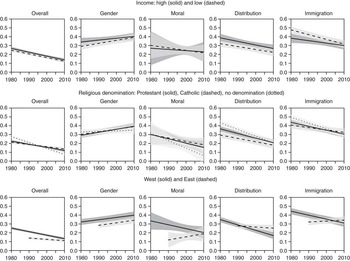
Due to space constraints, we present the results only graphically. Figure 4 provides an overview of the estimated trends. All figures visualize results from multilevel models based on the same logic as the models presented above. Both intercepts and slopes are allowed to vary for each sub-group. Models visualized under the label ‘Overall’ display the average trend across all attitude scales and are specified in Model A. The four other panels under each sub-group distinguish between issue dimensions—that is, they report results from Model C specification. While each of the figures may tell its own complex story—and should be the subject of greater study in the future—our focus is on general patterns. Levels and trends differ considerably between certain sub-groups, but not between all. We want to point out the findings we regard as the most illuminating.
Polarization trends among several sub-groups
Note: shaded areas around the effects (solid and dashed lines) represent 90 per cent confidence intervals based on simulated responses from the model as a visualization of uncertainty.

(continued).

Regarding the overall trend (Column 1), there are no significant differences for sub-populations of gender, income and religious groups. However, the overall decreasing trend is much stronger among highly educated, highly interested people, and somewhat stronger among respondents from West Germany.Footnote 15
The trend of increasing polarization on the gender dimension (Column 2) is similar across most sub-populations. Only the difference between the more and less educated is striking. Whereas the more educated display no increase (or a decrease) in attitude alignment, the increase in polarization seems to take place among the less educated on this dimension. We want to avoid in-depth speculation at this point, but there have been some developments on this topic that could put this finding into context. Germany has seen an improvement in women's rights over the last decades. The 1957 gender equality law (Gleichberechtigungsgesetz) abolished significant inequalities between women and men in marriage, for example women could in principle choose to take a job without their husband's approval, and possession of goods was not solely assigned to the man (Bundesministerium fűr Justiz 1957). Since then, several amendments have strengthened the position of women. Nonetheless, public debates on related topics are continuously boiling up such as the female quota, child care subsidies and child care in general. One could indeed argue that the gender question remains one of the few remaining cleavages (rooted in parts of the population) between the left and right camps in Germany, which have converged on many other highly debated topics such as unemployment assistance or the civil use of nuclear power.
Concerning the moral dimension (Column 3), the plots reveal a general decreasing trend of polarization across several sub-populations. However, the levels of polarization differ among sub-populations of more and less educated. Moreover, there is a considerable difference between trends among respondents from West and East Germany. Public opinion polarization has decreased in the former and increased in the latter. These estimates, however, have to be taken with a grain of salt due to higher uncertainty (see uncertainty intervals in the plot, which are wider on the moral dimension due to the smaller amounts of data). On the distribution dimension (Column 4), we again find significant differences between sub-populations of education, political interest and respondents from West and East Germany. In contrast, trends are similar among the other sub-populations. On the immigration dimension (Column 5), trends are similar across most sub-populations. Nonetheless, the trend of depolarization is again strongest among the more educated, and there is a difference between West and East Germany.
To sum up, the sub-group analysis reveals some heterogeneity in the development of public opinion polarization among sub-populations. We will further comment on this discovery in the dicussion and conclusion.
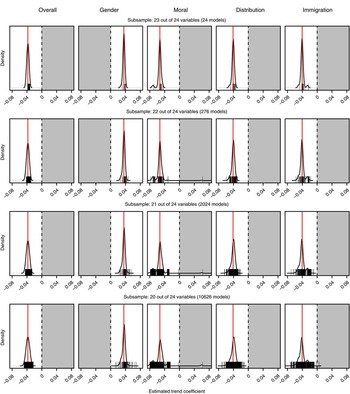
Further Tests of Robustness
We estimated various respecifications of our models to check the robustness of the presented results. To see whether some of the selected attitude scales (variables) have a significant impact on the estimated direction and size of the overall and dimension-specific effects, we re-estimated Models A and C by dropping every possible combination of one (resulting in 24 different models), two (276 models), three (2,024) and four variables (10,626).Footnote 16 The results are reported in Figure 5 in the appendix. It can be seen that the point estimates of the trending effects go in the same direction for almost all of the 12,950 estimated models, and show medium to low variance (this is, of course, hardly surprising when recalling Figure 2, which revealed a remarkable homogeneity of trends within dimensions). There is an exception in the moral dimension, where some of the specified models show a positive effect.Footnote 17 However, the reassuring insight we draw from these models is that the reported trend estimates are remarkably stable for various sub-sets of the original variable sample.
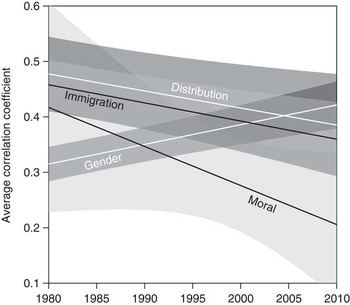
Another set of respecifications targets possible question order and measurement issues. In general, the selected variables are scattered far and wide within the questionnaires. However, questions belonging to one dimension are sometimes asked within a question battery. For example, all questions related to the gender dimension are part of a set of questions focusing on the role of women in the family, and were asked in one row as statements. The respondent was then encouraged to agree or disagree. This is not the case for the other dimensions, in which only some items belonged to the same set of questions, and others were asked earlier or later in the questionnaire. Asking for attitudes in question batteries may potentially lead to higher correlations between the measured scores, as batteries are likely to provoke response set bias; that is, respondents answer similarly on each of the questions rather than take the trouble to evaluate every statement and think about the right answer.Footnote 18 While it seems plausible that this phenomenon may lead to biased estimates of polarization levels, we do not expect the trend estimates to be affected, as items of the same battery are almost always asked in the same waves, and because systematic volatility in acquiescence seems unlikely (see also Billiet and Davidov Reference Billiet and Davidov2008). Our expectation is confirmed when we re-estimate the models using only items within each dimension that are part of the same battery.Footnote 19 As can be seen in Figure 6 in the appendix, the overall levels of correlation rose in all other dimensions (about 0.02 points for the moral values, 0.06 points for the distribution and 0.04 points for the immigration dimension). The trend estimates, however, remained stable, indicating that our findings concerning the exceptional trend of POP regarding gender issues are not a measurement artifact, but are fairly robust against variable selection in the present sample of variables.
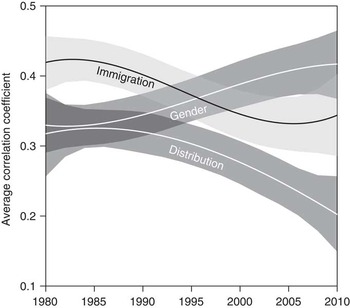
We also specified more flexible models by including trend polynomials of the second and third degree. Because the coefficients become harder to interpret, we only present the graphical output in Figure 7 in the appendix. Trend estimates for the moral dimension are not reported, as they are highly unreliable in this nonlinear specification due to data sparsity in the first and last decade of the observation period. What can be observed is that the original linear specification might hide some nontrivial trend dynamics, especially for the last five years of the sample: the estimated slope of immigration issues rises again between 2005 and 2010. However, the increased widths of the confidence bands indicate that this trend has to be taken with a grain of salt, so we refrain from further post hoc speculations as to why there could be a recently rising trend on this dimension, and patiently wait for new data from the follow-up waves to shed more light on this trend with a richer data base.
Finally, we employed a different concept of public opinion polarization: attitude dispersion.Footnote 20 For this purpose, the standard deviation for each issue in every available year is computed and then modeled similarly to our standard approach. Single attitude items, not variable pairs, constitute the grouping variable, and standard deviations measured at time t are nested within these groups. We find a negative overall trend of dispersion, however it is not significantly different from zero on the usual levels. Analogously to our main results, dispersion is increasing for gender issues and decreasing for other issues. Again, these effects are mostly insignificantly different from zero. These results are not surprising since both measures—correlation (see the Conception and Measurement of POP section) as a measure of attitude alignment and standard deviation as a measure of attitude dispersion—account for the extremity of positions on attitude scales. Thus the fact that the trend coefficients point in the same direction for both measures is reassuring, even if the coefficients for the dispersion measures are not significant. While this alternative specification is not a very strong test of the validity of our results,Footnote 21 we think it offers valuable information on the compatibility of different measures of polarization. In the presented scenario, insights from the attitude alignment perspective do not lead to contradictory findings compared with results based on the attitude dispersion measure. We have already argued extensively why we prefer the former.
Discussion and conclusion
Studies on public opinion polarization have been largely confined to the US context. We offer the first descriptive overview of POP trends in Germany between 1980 and 2010, and find that the overall level of POP, conceptualized and measured as attitude alignment, has declined. This result seems to mirror evidence from studies on party polarization, in which convergence on several policy dimensions can be observed (Spier Reference Spier2011). Attitude alignment between domains is low and still decreasing (that is, we do not find a society in which POP extends over different issue dimensions), and our analyses of trends among sub-populations reveal that this overall negative trend mainly takes place among the highly educated and the politically interested. Stronger change among these sub-groups seems to be in line with arguments that (de)polarization is an elite phenomenon.Footnote 22 Strikingly, the overall trend does not hold for gender issues. POP in Germany has grown for attitudes towards the role of women in the family. The trend for this issue dimension is similar and increasing among most sub-groups. However when we divide the sample into more and less educated respondents, we clearly see that the development of polarization mainly took place among the less educated. This domain-specific finding, and the fact that the increasing trend only takes place among the less educated, is a puzzle that requires further research. Further, the differentiation between West and East German sub-populations reveals interesting sub-trends. West Germans follow the general trend, while East Germans deviate somewhat with regard to moral, distribution and immigration issues. Although we observe no negative or positive trends regarding distribution and immigration issues, it remains positive for moral issues. While we refrain from speculations about why these differences may occur, we think they would provide interesting starting points for future studies.
Just like measurements of absolute values of polarization, trends are relative and more revealing when compared with other countries. Baldassarri and Gelman (Reference Baldassarri and Gelman2008, 431) present an overall increasing trend of attitude alignment (coefficient = 0.02 per decade) in the United States. The authors find this trend modest in comparison with trends of issue partisanship, that is, alignment between attitude scales and the left-right scale. However, in light of the overall negative trend we find for the German case (coefficient = −0.04 per decade), Baldassarri and Gelman's results have to be re-evaluated. In contrast to Germany, which is seeing an overall decreasing trend of polarization for attitudes towards most issues, POP seems to have slightly increased in the United States.Footnote 23 In addition, whereas the politically interested experience a stronger positive trend of attitude alignment than those who are less interested in the United States (see Baldassarri and Gelman Reference Baldassarri and Gelman2008, 435: Figure 8, Plot A), the opposite is true for Germany (see Figure 4). Other European studies also find generally decreasing levels of public polarization, for example the British (Adams, Green and Milazzo Reference Adams, Green and Milazzo2012a,Reference Adams, Green and Milazzob) and Dutch cases (Adams, Vries and Leiter Reference Adams, De Vries and Leiter2011). We can only speculate that the diverging trends in the United States and the examined European countries could be a consequence of elite polarization in the United States on the one side, where conservative Democrats and liberal Republicans seem to have left Congress,Footnote 24 and depolarization in European party systems on the other (as described for the British case by Adams, Green and Milazzo Reference Adams, Green and Milazzo2012a). There is some agreement among German scholars that the party system has seen a trend of depolarization in recent decades.Footnote 25 Thus, parties seem to follow the same broad decreasing trend we found for German public opinion. Nonetheless, we are not able to make any assertions concerning the causal connection between the two phenomena. We deliberately did not follow a partisan- or ideology-based perspective on polarization, as partisan camps are more difficult to identify in a multiparty setting than in a two-party case like the United States, where such a perspective is more common.Footnote 26 However, in order to get a deeper understanding of the mechanisms behind mass polarization, we suggest the connection between party polarization and POP from a comparative perspective as an urgent topic for further research.
Beyond that, our approach and findings may prove useful for scholars of public opinion in general, as they open multiple avenues of further research. One avenue concerns the variety of substantive issues we have illuminated. Researchers of public opinion have compared attitudes towards the issues investigated here both between units and over time, for instance attitudes towards redistribution and the welfare state;Footnote 27 gender roles;Footnote 28 attitudes towards moral topics such as abortion, homosexuality and euthanasia;Footnote 29 and attitudes towards immigrants and immigration.Footnote 30 However, the perspective we pursued in this study changes the main focus from simple averages to relations between attitudes and distributions of attitudes among groups of people. We are convinced that this changing focus may lead to a better understanding of public opinion in general and reveal interesting insights, especially because the polarization aspect of attitudes—and its development—have largely been neglected outside the United States.
A second avenue concerns a drawback regarding our measurement of polarization. While it is possible to evaluate within-group polarization, between-group polarization has received no scrutiny. Recently proposed measuresFootnote 31 illustrate that such approaches may further enrich analyses. A possible way to preserve the advantages of the attitude alignment measure used here, but to account for between-group differences nonetheless, would be to calculate standardized Euclidean distances for a set of various attitude items, and subsequently evaluate them along the lines of different groups. Evaluation of such techniques should be the subject of future work. A third avenue concerns examining explanations of trends and levels of POP in general. Studies that focus on single countries are insufficient in this regard. In our view, more comparative studies are needed that investigate the causes of POP. Cross-country survey projects, like the Eurobarometer or the European Social Survey, might offer data that are better suited to look for macro-level factors that influence polarization trends. In this regard, studies such as Down and Wilson (Reference Down and Wilson2010) can be regarded as fruitful starting points.
Used Variables from ALLBUS 1980–2010

(Colour Online) Density curves of estimated overall and dimension-specific correlation trends for different sets of models Note: shaded areas indicate effects opposed to the models reported in the article based on the full set of variables (indicated by a vertical red line). The small vertical black lines indicate point trend estimates of a singular model.

Correlation trends by issue dimension, over time Note: reduced variable sample based on within-dimension sets of batteries. The lines are based on the effects as estimated in Model C (‘By types of issue dimensions’). Shaded areas represent 90 per cent confidence intervals.

Correlation trends by issue dimension, over time Note: based on cubic polynomial of trend specification. The lines are based on the effects as estimated in Model C (‘By types of issue dimensions’). Shaded areas represent 90 per cent confidence intervals.