

Introduction
Groove is a quality of music that evokes engagement and pleasurable participation through physical movement and dance.Footnote 1 This quality is particularly central to popular dance styles like son and salsa,Footnote 2 which have developed from their Cuban/Puerto Rican roots to enjoy widespread appeal among large groups of disparate people. Salsa has proved to be a particularly popular music/dance phenomenon, being produced and enjoyed in concerts, dance classes and clubs around the world.Footnote 3
Over the past few decades, a number of researchers have attempted to understand what aspects of music contribute to groove. In Charles Keil’s concept of groove, which he calls the theory of ‘Participatory Discrepancies’ or PDs,Footnote 4 he argues that a key component of the pleasure and power of groove comes from the rhythmic, interactive timing relationships between participants, more than from structure and syntax. For Keil and his colleague Steven Feld, it is the slight ‘out of syncness’ between musicians (timing discrepancies caused by pushing and pulling) that generates creative tension and drive in the music, and creates a sense of participation for both listeners and performers.Footnote 5
Ethnographic studies of jazz lend support to PD theory. Many musicians say that successful jazz grooves have an easy feeling of momentum, flow and a sense of rhythmic energy that comes from the tight synchrony between players. Yet they also articulate how making small adjustments to relative timing positions – playing slightly on top of, on or behind the beat – are important aspects of groove production.Footnote 6 These accounts resonate with John Chernoff’s ethnographic study of African rhythm, in which he notes that if a drummer ‘moves into too close synchrony with another drum, he negates the potential effect of both rhythms’.Footnote 7 Although extremely valuable and contextually rich, ethnography is by its nature rather imprecise and subjective.
By contrast, empirical microtiming studies have attempted to provide objective measures of the small asynchronies between musicians. A number of studies in ethnomusicology and jazz have shown that microtimed asynchronies are commonplace in the performance of jazz,Footnote 8 Brazilian sambaFootnote 9 and Malian Jembe drumming.Footnote 10 Further research has investigated the effect of microtiming on groove. Some researchers, mainly in the field of music psychology, have found no correlation between microtimed asynchronies and groove.Footnote 11 Bjorn Merker has been particularly forthright, arguing that, ‘The claim that deviations from isochrony constitute the phenomenon of groove or swing is so counter-intuitive as to be tantamount to a contradiction in terms.’Footnote 12 Others have found that microtiming deviations are detrimental to groove in certain styles of groove-orientated music,Footnote 13 and yet others have found no evidence that microtiming deviations are detrimental to groove, or that microtiming is necessary for groove.Footnote 14
Several studies have shifted away from microtiming, instead suggesting that other aspects of the music, such as rhythmic structure and metre,Footnote 15 beat salience, syncopation, event density, tempo and rhythmic variability, are more strongly associated with the groove experience.Footnote 16 In short, there is no consensus among scholars as to whether microtiming or any other musical feature is predominantly responsible for groove, and numerous approaches to the study of groove exist.
The approach used to study groove in this article is to focus on two principal features in Cuban dance music: the foundational patterns that make up the rhythmic-harmonic structure and its relationship to microtimed asynchronies between expert musicians in real-world performances. This focus comes from my own experiences as a salsa bass player. For me, the essence of a good groove is when rhythm-section musicians know the key rhythmic-harmonic patterns intimately and can interact freely to execute these patterns with the ‘correct’ timing nuances in performances.
A small number of articles and theses on timing in Cuban music underscore my intuitions and experiences. Most relevantly, in his article analysing swing and expression in a commercial recording of salsa, Christopher Washburne argues that microtimed pushing and pulling among five rhythm-section instruments (percussionists, bass and piano) creates exciting tension and propulsion in the groove.Footnote 17 Olava Alén measured timing nuances in different toques (basic repeated rhythm patterns) found in Cuban tumba francesa performance.Footnote 18 He found slight but consistent deviations from notated metric structure to be an important expressive characteristic of the music. Adam Bilmes used quantitative measures of percussion performances in Cuban rumba. He claims that timing deviation within repeated percussive phrases is ‘not random noise’ but ‘plays a vital role in expressive timing’ and ‘human musicality’.Footnote 19
Recently, research on Afro-Cuban music has reported related findings. Christopher Stover illustrates how the delicate and intricate timing deviations in rhythmic patterns provide an appealing ‘rhythmic friction’ within the cyclical framework of Afro-Cuban ensemble performances.Footnote 20 Drawing on Stover, Fernando Benadon’s quantitative analysis of onsets taken from Afro-Cuban drum performances reveals that timing discrepancies or ‘near-unisons’ are ‘widespread and often sizeable’, and that the contour of these timings is shaped by style, measurements used, metric location in the beat cycle, instruments involved and the role (leader/follower) of particular instrumentalists.Footnote 21 In a related paper, Benadon, Andrew McGraw and Michael Robinson use music theory and quantitative methods to examine the interlocking layers in an ensemble groove in Cuban rumba performance.Footnote 22 Their work suggests that microtiming tendencies are influenced by the particular rhythmic pattern played, the instruments’ role within the ensemble and the instrumentalists’ choice of rhythmic improvisations in a given performance.
The primary aim of this article, then, is to integrate some of the often contrasting approaches outlined above to examine and quantify key aspects of timing and groove in the son/salsa tradition. Previous musicological research on rhythmic-harmonic structure is considered alongside quantitative timing data taken from real-world performances and qualitative data taken from interviews with the performing musicians. While this approach to the study of groove is not unique,Footnote 23 its use is not widespread. However, it has the potential advantage of providing a detailed and rich account of groove by examining how expert musicians talk about timing and groove production, and by integrating this with fine-grained measures of what they actually do in performances.
Method, ensembles and data analyses
The timing data used for analysis in this article was taken from audio recordings of three different live-group performances that took place in Britain during July 2009. These groups – Riamba (RI), Havana Club Descarga (HCD) and Asere (AS) – were selected because they had considerable professional experience of performing son and salsa, and they had agreed to participate in multitrack live recordings and subsequent interviews. Table 1 provides an overview of the background, instrumentation, venue, dates and songs selected from these performances for analysis.
RECORDED ENSEMBLES, INSTRUMENTATION, SONGS AND PERFORMANCE DETAILS
| Group | Song | Venue | Date/Time | Instruments | Background |
|---|---|---|---|---|---|
| Riamba (RI) | El Cuarto de Tula | Café in the Crypt, Trafalgar Square, London | Wednesday, 01/07/2009, 20:00–22:00 | voice, trumpet, electric piano, electric bass, timbales/bell and congas | London-based musicians of multi-ethnic origin: 4 English (trumpet, piano, bass and percussion (timbales/bell)); 1 Spanish (voice); and 1 Colombian (congas). Performance to a seated audience and salsa dancers. |
| Havana Club Descarga (HCD) |
Muñeca | The King’s Head, Crouch End, London | Monday, 27/07/2009, 21:00–23:30 |
voice, trumpet, sax, electric piano, electric bass, clave, bongo/bell and congas | London-based musicians of multi-ethnic origin: 3 English (trumpet, sax and piano); 1 Cuban (percussion); 4 of Latin American origin (mainly Colombian). Salsa dance class and jam session. |
| Asere (AS) | Habanera | The Open University music research studio, Milton Keynes | Friday, 23/07/2009, 15:30–16:30 |
voice, trumpet, acoustic guitar, Spanish guitar, electric bass, bongo/bell and congas | All musicians Cuban and based in Havana. Recorded while on tour in the UK. Live performance in a studio with a small audience. |
Each instrument was recorded on a separate track, either on an eight-track Korg D888 or into Pro Tools on a laptop. The exact configuration of microphones and direct outputs from the amplifiers varied from performance to performance, depending on the instrumental format of the group and the nature of the venue’s sound equipment. Direct input was favoured in order to achieve the level of track separation needed for later timing analysis. When microphones were used (on percussion instruments, for example), they were placed as close to the sound source as possible with the same objective in mind. Video recordings of the performances were also made for reference purposes.
Interviews with the musicians, conducted shortly after the performance by the author, were recorded on a hand-held digital recorder and were later transcribed verbatim. Depending on the interviewee, interviews were conducted in English or Spanish and where necessary have been translated into English by the author or by Graciela Rodriguez, a salsa singer from Galicia and a member of one of the recorded groups (RI).
All recordings were later transferred onto a larger Pro Tools workstation for mixing. Each relevant track was then exported from Pro Tools and imported into Praat,Footnote 24 where the start points (onsets) of musical events were identified, marked and labelled. Identifying onsets for every track is complex and very time-consuming, especially when the group consists of six or more musicians and onsets are coded manually (the approach used here).Footnote 25 Therefore, three short extracts of around one minute were selected, one from each group performance. These extracts were chosen because the instrumentalists were playing typical rhythmic-harmonic patterns used in son and salsa and, in my judgment, there was a sense that the groove had the characteristic drive, forward motion and excitement. From these extracts, three instruments in the rhythm section were used for timing analysis: one percussion instrument (bell), electric bass and electric piano or acoustic guitar.Footnote 26 There were two considerations behind the decision to focus on these three instruments. The first was practical: analysing the entire rhythm section was not possible owing to time constraints. Secondly, each plays a central role in groove production within the rhythm section (see next section for details).
Once the onsets were marked, they were then checked for accuracy and consistency. The approach taken by instrumentalists in son and salsa is to play very percussively,Footnote 27 regardless of the instrument being played, producing clear onsets that can be accurately identified and marked. Of the instruments used here, electric bass produces ‘fuzzier’ onsets than percussion or piano/guitar. I estimate that even with the bass, the margin of error is at most 2 milliseconds. The data therefore gives a reliable indication of timing and timing relationships. The timing data was saved from Praat, and files were imported into a Microsoft Excel spreadsheet for statistical analyses and graphing.
Two types of statistical analyses were used. The first is the concept of relative phase from circular statistics. Calculations of relative phase (the degree of alignment between concurrent rhythmic events) are a useful way of showing timing relationships between instrumental pairs within the rhythm section: bell and bass, or bell and piano/guitar. Shared onsets between instrumental pairs were used for these calculations.Footnote 28
The software Oriana was used to generate summary circular statistics. These include the Rayleigh test, the angle of the mean vector and the length of the mean vector. The Rayleigh test is used for testing whether angles are uniformly distributed around a circle and the significance of this distribution.Footnote 29 For musical analysis, it provides a useful indication of the likelihood of relatedness between the timing of two rhythm-section instrumentalists. The angle of the mean vector (μ) shows the relative phase angle between two series of onsets and is used here to show to what extent musicians are playing ahead, on or behind the beat. The length of the mean vector (r) indicates the strength of coupling between two series of onsets, ranging from 0 (the instrumentalists are rhythmically independent of each other) to 1 (the instrumentalists are not independent). Values close to 1 suggest that there is little variation in values of the angles and imply a high degree of musical synchrony between players.
Circular statistics have proved to be effective in uncovering the timing relationships that underlie musical entrainment in Indian raga performance,Footnote 30 Afro-Brazilian congado ritualFootnote 31 and groove in jazz.Footnote 32 They are used in the following analysis to compare trends in relative timing between instrumentalists across three different performances and tempos.
The second type of statistical analysis makes use of absolute measures of timing in milliseconds, measures that are more typical in music timing studies. Milliseconds (ms) are used in the following analyses to build up a detailed picture of asynchronies between musicians at certain metric locations within the repeated rhythmic-harmonic structure. They are also used to generate summary statistics (mean, standard deviation (SD)) and significance tests using single-factor ANOVA (analysis of variance).Footnote 33 Analyses were conducted in Microsoft Excel.
Before discussing the results of the analyses, the following sections provide details of the musical materials used for analyses, the performance structure and the rhythmic-harmonic patterns played by rhythm-section instrumentalists.
Song structure
As mentioned above, the songs listed in Table 1 were selected for further analysis because they contain very similar rhythmic-harmonic patterns and structures typically found in son and salsa performance. These musical features are pervasive and are of considerable importance to the study of groove within these traditions. The first of these features is the son–montuno song structure.
Son and salsa, like many Cuban and Cuban-related dance styles (rumba, danzόn, timba), follow a binary structure. The first song-like section, known variously as the canto (song), tema (verse), guia (verse) or simply son, places an emphasis on melody, harmony and lyrics. The longer second part, the montuno, is a repeated vamp featuring call-and-response singing, pregones (vocal improvisations) and instrumental solos over cyclic rhythmic-harmonic patterns played by the rhythm section.Footnote 34
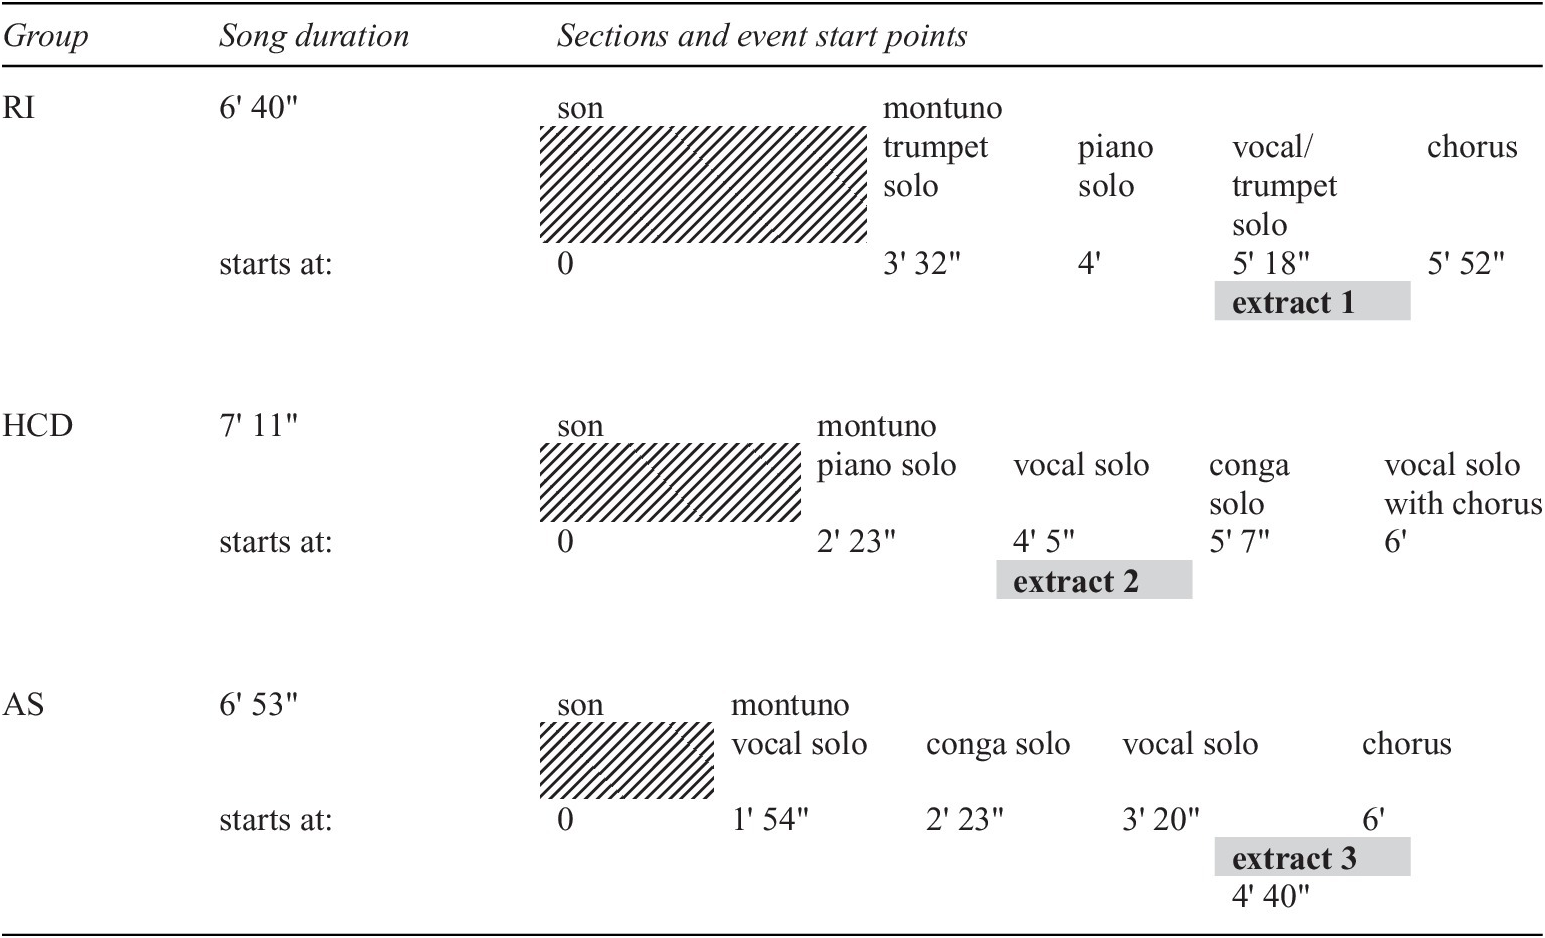
Table 2 shows the son–montuno structure and durations for the three group performances. It also shows the starting points (in minutes and seconds) of the son and montuno sections, the sequence of events within the montuno, and the locations of the extracts used for timing analysis. As shown in Table 2, the focus of my analysis was on short one-minute extracts taken from the montuno section. In contrast to the son section, the feel of the montuno is typically described as more ‘vivacious’,Footnote 35 ‘energetic’ and ‘the part that listeners and dancers enjoy best’.Footnote 36 More so than the son section, the extended montuno groove may hold the key to understanding the heightened energy, drive and dance feel of son and salsa performance.
SUMMARY OF SONG DURATIONS, PERFORMANCE STRUCTURE AND LOCATIONS OF EXTRACTS USED FOR TIMING ANALYSIS

Rhythmic-harmonic patterns and structure
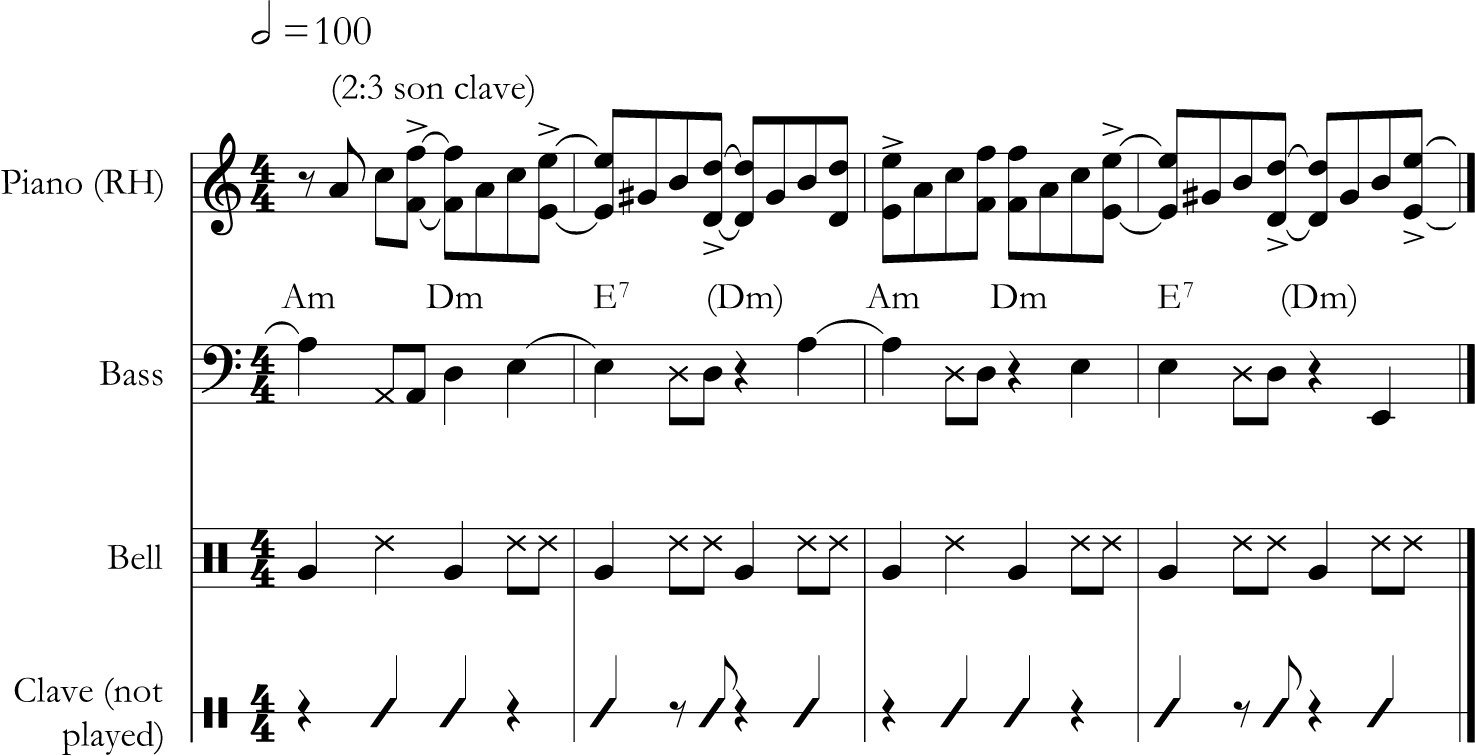
These extracts, chosen because they were particularly vibrant parts of the montuno, also contain within the rhythm section characteristic repeated patterns that together constitute the rhythmic-harmonic structure of the montuno groove. Sample transcriptions of these patterns for the three extracts are shown below in Examples 1–3.
Sample transcription of three rhythmic-harmonic patterns played on bell, bass and piano, RI group.

Bell
In Examples 2 and 3 (HCD and AS groups), the percussionists are playing the widely used son/salsa bell pattern (known variously as the cencerro, campana or bongo bell pattern), which provides the steady and continuous ‘pocket pulse’ for the montuno groove.Footnote 37 In Example 1 (RI group), the percussionist is playing a common variation of this pattern, with one more stroke per bar. Typically, the bongosero (bongo player) switches from bongo to bell at the beginning of the montuno to drive the music along and to anchor the rhythm section during the instrumental and vocal solos. The bell does this by marking the main pulse on 1 and 3 with open tones.Footnote 38 Open tones are played on the mouth of the bell (notated as the lower pitched crotchets and quavers in Examples 1–3), producing a strong, audible tone that cuts through the dense rhythmic texture. The higher-pitched bell strokes (notated as crosses) are played on the edge of the bell with a muted tone, filling in around the stronger open tones.
Sample transcription of three rhythmic-harmonic patterns played on bell, bass and piano, HCD group.

Sample transcription of three rhythmic-harmonic patterns played on bell, bass and guitar, AS group.

Clave
Along with the bell, the clave is an important and central rhythmic feature of son and salsa music.Footnote 39 Whether articulated or (as in the above transcriptions) not, the clave pattern functions as an internal guide for son/salsa musicians, singers and dancers, and serves as a structural and aesthetic foundation that guides composition, arrangement, performance and improvisation.Footnote 40 Washburne refers to the internalization of clave by salsa musicians as the development of a ‘clave sense’ and argues that ‘understanding clave is essential when exploring feel, swing, and groove in salsa’.Footnote 41
The relationship between clave and groove may lie in its asymmetrical structure. It is binary in nature, alternating between three strokes in one bar, called the three-side, and two strokes in the next bar, called the two-side. Clave can also be reversed, with songs starting on the two-side, rather than the three-side, as in Examples 1–3, which are all instances of 2:3 son clave. Some researchers argue that the cyclical, binary structure of clave embodies a powerful tension–release dynamic that helps to generate a sense of energy and dynamic forward momentum within clave-based musics.Footnote 42 Jeff Pressing, for example, argues that the repeated ‘Latin clavé pattern […] achieves intensification of engagement and attention’ and ‘heightens the groove’s potential for emotional impact’.Footnote 43
Bass
Another fundamental pattern found in son and salsa is the bass line seen in Examples 1–3. This syncopated line, often referred to as bajo anticipado (anticipated bass) or tumbao, is, writes Peter Manuel, ‘perhaps the single most distinctive feature of Afro-Cuban popular music, and its origin is unique to that set of genres and their derivatives’.Footnote 44 The bass accents 2-and and 4 in every bar, and by placing a bass note on 4, tying that note across to the next bar and thereby deliberately avoiding location 1, the bass anticipates the change played on the harmonic instruments (the piano or guitar in Examples 1–3).
Manuel argues that the resultant effect of this momentary rhythmic-harmonic anticipation ‘can be said to create a tension and a desire for the corresponding harmony of the next bar’. At the same time, the weak stressing of the downbeat, when it does arrive, undermines its potentially cadential effect, so that the rhythm in effect ‘rides over’ the downbeat, lending the rhythm ‘a unique flow and momentum which make it ideal for the supple and fluid salsa dance style’.Footnote 45 Echoing Manuel, Tecumseh W. Fitch argues that when the syncopated bass notes are synchronized with the dancer’s steps, ‘acoustic energy’ is injected into the upbeats, which ‘is precisely what makes salsa groove’.Footnote 46
The momentary cadential effect found in the anticipated bass also interacts with the clave: bass notes avoid the clave strokes on the two-side, anticipate the first clave stroke on the three-side and then correspond with the next two clave strokes on the three-side. Thus, the bass reinforces the sense of syncopation by playing with some clave off-beats (strokes 4 and 5) but never clave on-beats (strokes 2 and 3).
Piano/guitar
The momentary cadential effects in the bass interact with the piano tumbao or montuno, which also anticipates the harmonic change by placing an emphasis on the 4-and typically or usually in every bar, one quaver after the bass: see, for example, the bass and piano notes in bar 1 of Example 2. Manuel describes this combined bass–piano effect as ‘staggered anticipation’, which, he argues, further undermines a sense of cadence and adds to the unique dance feel of modern son and salsa styles.Footnote 47 A related effect is evident in the middle of each bar. As can be seen in Example 2, both the bass and the piano tend to place accented notes on 2-and, thereby anticipating the strong 3 of every bar. Unlike the anticipation of 1, there is no harmonic staggered effect, as the bass and piano are changing rhythmically and harmonically together in their anticipation of 3. Perhaps, therefore, the rhythmic anticipation of 3 is weaker or manifests itself in a slightly different way.
Following on from this outline of the rhythmic-harmonic structure, the next section provides an analysis of the timing relationships between instrumental pairs within the rhythm section as they articulate this rhythmic-harmonic structure during live performances.
Extract 1: RI group
Table 3 shows a summary of the timing relationships between the bell player and the bass/piano throughout the extract, using circular statistics. For the interested reader, bell tempo and relative phase graphs for instrumental pairs for this and the following two extracts are provided in the Appendix.
SUMMARY CIRCULAR STATISTICS FOR THE INSTRUMENTAL PAIRS BELL/BASS AND BELL/PIANO (RI GROUP)
| Bell/Bass | Bell/Piano | |
|---|---|---|
| number of observations | 105 | 229 |
| mean vector (μ) | 6.48° | 4−2.66° |
| length of mean vector (r) | 0.92 | 0.83 |
| circular standard deviation | 22.10° | 34.94° |
| Rayleigh test (Z) | 90.49 | 157.89 |
| Rayleigh test (p) | < 1E−12 | < 1E−12 |
What do these statistics say about the timing relationships between musicians? First, they suggest that the bass and piano both enjoy a tightly synchronized relationship with the bell. This is indicated by the length of the mean vector (r), which is very close to 1, and the Rayleigh value of p < 0.05. The level of synchrony, however, is slightly higher in the bass (r = 0.92) than it is in the piano (r = 0.83). Secondly, the mean vector shows that on average the bass has a tendency to play slightly behind the bell (μ = 6.48°), while the piano plays very slightly ahead of the bell (μ = −2.66°).
In order to determine what may have shaped these temporal fluctuations, the same timing data is presented from a different perspective. The following graphs and accompanying tables provide a summary of asynchronies (in ms) between the bell and the bass (see Figure 1 and Table 4) and between the bell and the piano (see Figure 2 and Table 5) in relation to metric structure (at each of the eight metric locations over the repeated two-bar clave cycle). As with the mean vector in Table 3, positive data points above the x-axis in Figures 1 and 2 show that the instrumentalist is playing behind the bell, while negative data points below show that they are playing ahead.
Asynchronies (ms) by metric location for the instrumental pair bell and bass (RI group).

STATISTICAL SUMMARY OF ASYNCHRONIES BY METRIC LOCATION FOR BELL VS BASS (RI GROUP)
| Bell vs Bass | two-side | three-side | |||
|---|---|---|---|---|---|
| Metric location | 1 | 4 | 5 | 6.5 | 8 |
| total onsets | 15 | 16 | 16 | 30 | 28 |
| mean (ms) | 14 | 38 | −2 | 12 | 2 |
| SD | 31 | 31 | 27 | 28 | 31 |
| ANOVA (p) | 0.4542 | 0.0001 | 0.3001 | 0.3194 | 0.2944 |
Asynchronies (ms) for the instrumental pair bell and piano (RI group).

STATISTICAL SUMMARY OF ASYNCHRONIES BY METRIC LOCATION FOR BELL VS PIANO (RI GROUP)
| Bell vs Piano | two-side | three-side | ||||||||||
|---|---|---|---|---|---|---|---|---|---|---|---|---|
| Metric location | 1 | 2 | 3 | 3.5 | 4 | 4.5 | 5 | 5.5 | 6 | 6.5 | 8 | 8.5 |
| total onsets | 6 | 29 | 14 | 16 | 14 | 29 | 19 | 11 | 26 | 29 | 5 | 30 |
| mean (ms) | −17 | 5 | 22 | 15 | 19 | −1 | 0 | −8 | −4 | −18 | 0 | −9 |
| SD | 10 | 20 | 25 | 14 | 16 | 14 | 19 | 14 | 16 | 17 | 27 | 23 |
| ANOVA (p) | 0.001 | 0.37 | 0.007 | 0.002 | 0.001 | 0.04 | 0.25 | 0.004 | 0.001 | 1.4097E−10 | 0.5 | 0.001 |
There are several notable features of these timing data. First, the greatest asynchronies between the bell and the bass occur at metric location 4 on the two-side of the clave. At this point in the clave cycle the bass plays behind the bell by an average of 38 ms, and this is the only metric location at which the measures are statistically significant (p < 0.05; see again Table 4). 14 of the 16 (or 87%) data points for metric location 4 lie outside the proposed ±20 ms perceptual threshold,Footnote 48 and therefore asynchronies here may be more audible than at other locations.
The piano timing data is slightly different. Of the statistically significant metric locations (all but 2, 5 and 8), 3 and 4 on the two-side and 6.5 on the three-side have the greatest asynchronies: an average of 22 ms, 19 ms and −18 ms respectively (see again Table 5). However, only about half of the onsets for these metric locations are within ±20 ms.
The above timing data suggest that asynchronies between the bass and piano are shaped by a mixture of the inevitably random noise found in live ensemble performance when musicians aim to play synchronouslyFootnote 49 and more systematic deviations, especially between the bell and the bass at metric location 4 on the two-side of the clave.
The performing musicians provide further perspectives. I asked Andy Martin, Riamba’s percussionist, for his thoughts on relative timing during this performance extract.
I wouldn’t say I’m consciously trying to push it. I am just trying to sit with the bass player. The cowbell (campana) is the instrument to really just lay [it down]; if a band wants to keep on top of the beat the bongo bell can really just lay it down.
Pushing and pulling, it’s one of those things […] some of the greatest bands or greatest recordings are because there is tension between certain instruments. It’s not that one person is rushing or one person is dragging … a drummer might just slightly edge back on the beat and, you know, a guitarist or a pianist or whoever might be slightly on top of the beat. You get this slight separation but it’s not enough for it to fall apart and disrupt the groove […] but it is enough actually to create a unique feel, and it creates this tension of pushing and pulling […] I think the music has this lifting and forward-moving feel. It doesn’t necessarily mean it’s rushing but it’s got a forward movement.Footnote 50
Martin’s words convey a sense of participation and discrepancy: instrumentalists work together to maintain a synchronous yet slightly separated relationship with one another during groove production, as Keil and others have proposed. Quantitatively, he is tightly synchronized with the bass (and piano) throughout the performance extract (see again Table 3) and the ‘slight separation’ he talks about in order to ‘create a unique feel’ is particularly pronounced at metric location 4, where he plays ahead of the bass by an average of 38 ms (see again Table 4).
Hamish Balfour, Riamba’s pianist, also talked about the importance of relative timing and groove, and of the significance of certain metric locations:
I hear some Cuban piano players and I try and sometimes emulate this. It’s really quite lazily played, almost behind the beat. The piano needs to be on the beat but still with that lazy feel. When I’m talking about this lazy thing still absolutely nailing it in time but just almost swinging really. If it’s pushing it doesn’t work. Not in front I don’t think, not at all, I’ll leave that to the bass.
The 4 is so important because it seems to me the 4 is really what gives it that movement. With this it’s a two-bar structure. It sort of leads to that 4. It’s such an important groove.Footnote 51
His comments suggest that he has the intention of playing synchronously but with a ‘lazy’, slightly behind, feel. In addition, he perceives the bass as being the instrument that pushes, not the piano. There is some correlation between his intentions and the way in which he plays on the extract analysed. He does ‘nail it in time’, enjoying a tight synchronous relationship with the bell, and his ‘almost behind, lazy feel’ translates into playing slightly ahead overall (μ = −2.66°; see again Table 3), but behind on certain metric locations on the two-side, namely locations 3 and 4, where the asynchronies are largest (22 ms and 19 ms; see again Table 5).
Interestingly, his perception of the bass pushing does not correlate with the timing data, as the bass actually plays slightly behind the bell and piano overall. I was the bass player on the above extract and I would have said that my own timing orientation, in line with Balfour’s, was to play ahead, not behind. This slight mismatch between the timing data and the musicians’ perceptions may be the result of the anticipated bass pattern discussed in the previous section. Perhaps continuously anticipating the harmonic change on metric location 4 gives a sense of playing more ahead than is actually the case.
A related speculation surrounds Balfour’s comment about the particular relevance of location 4, which he thinks gives ‘movement’ to the groove. 4 on both sides of the clave is referred to as the ponche (or punch). As the name suggests, it provides a point of momentary emphasis to the groove that makes the rhythm section punch through the ensemble texture.Footnote 52 This is achieved by a combination of the anticipated bass note, which stands out and provides a sense of flow and movement, coupled with strong open tones played on the congas and bongos.Footnote 53 As a bass player, I try not just to accent the ponche but also to ‘place’ it more assertively and carefully in relation to the percussion. I think that the more pronounced bass asynchronies on metric location 4 seen in Table 4 are perhaps the result of my intention to place the note more carefully in relation to the percussion, resulting in my playing slightly further behind.
However, this only happens on the ponche on the two-side of the clave, not on the ponche on the three-side, where the level of asynchrony is negligible (an average of 2 ms at metric location 8; see again Table 4). The binary structure of the clave pattern may be influential here. The two-side bass ponche does not fall on a clave stroke, whereas it does fall on a clave stroke on the three-side (see transcription in Example 1). It is feasible that the high level of synchrony between the bell and the bass at location 8 (the three-side ponche) is shaped by the presence of a clave stroke. Like many performers of this style of music, I have learnt to internalize and synchronize with the clave. Given that the clave is not played in this performance extract, perhaps this is an example of how the internalized ‘clave sense’Footnote 54 shapes performance timing and synchrony between musicians – a topic for further investigation. Attention now turns to the second extract to look for further timing trends.
Extract 2: HCD group
As in the previous extract, the bass and the piano are tightly synchronized with the bell: r-values are close to 1 and p < 0.05 (see Table 6). A further similarity is that the degree of synchrony is more pronounced between the bell and the bass (r = 0.98) than between the bell and the piano (r = 0.77). The piano parts are ‘busier’ than the bass ones in the RI and HCD groups, resulting in more data points at more metric locations, which may increase the likelihood of scatter and therefore slightly lower r-values. Alternatively, it is likely that instrumental roles/patterns are also influencing differing levels of synchrony. Within the rhythm section, the bell and bass players generally maintain a steady pattern with little variation, whereas the pianists are freer to introduce (appropriate) variations (see Figures 3 and 4 and Tables 7 and 8). As Manuel points out, this ‘accompanimental improvisation’ could be the introduction of an alternative pattern or more subtle ‘microrhythmic nuances’.Footnote 55
SUMMARY CIRCULAR STATISTICS FOR THE INSTRUMENTAL PAIRS BELL/BASS AND BELL/PIANO (HCD GROUP)
| Bell/Bass | Bell/Piano | |
|---|---|---|
| number of observations | 130 | 201 |
| mean vector (μ) | −6.35° | −7.89° |
| length of mean vector (r) | 0.98 | 0.77 |
| circular standard deviation | 10.66° | 18.17° |
| Rayleigh test (Z) | 127.50 | 199.95 |
| Rayleigh test (p) | < 1E−12 | < 1E−12 |
Asynchronies (ms) by metric location for the instrumental pair bell and bass (HCD group).

Asynchronies (ms) by metric location for the instrumental pair bell and piano (HCD group).

STATISTICAL SUMMARY OF ASYNCHRONIES BY METRIC LOCATION FOR BELL VS BASS (HCD GROUP)
| Bell vs Bass | two-side | three-side | |||
|---|---|---|---|---|---|
| Metric location | 2 | 4 | 6 | 6.5 | 8 |
| total onsets | 28 | 27 | 25 | 26 | 26 |
| mean (ms) | −6 | −19 | −16 | 5 | −9 |
| SD | 14 | 16 | 11 | 10 | 16 |
| ANOVA (p) | 0.002 | 1.47386E−09 | 4.79122E−14 | 0.30 | 8.375E−07 |
STATISTICAL SUMMARY OF ASYNCHRONIES BY METRIC LOCATION FOR BELL VS PIANO (HCD GROUP)
| Bell vs Piano | two-side | three-side | |||||||
|---|---|---|---|---|---|---|---|---|---|
| Metric location | 1 | 2 | 3 | 4 | 4.5 | 6 | 6.5 | 8 | 8.5 |
| total onsets | 7 | 26 | 24 | 21 | 27 | 24 | 24 | 22 | 23 |
| mean (ms) | −35 | −20 | −22 | −10 | 15 | −6 | 23 | −22 | 4 |
| SD | 21 | 24 | 27 | 27 | 26 | 30 | 33 | 30 | 31 |
| ANOVA (p) | 0.0005 | 1.50894E−05 | 3.80838E−05 | 0.02 | 0.03 | 0.05 | 0.018 | 3.31E−05 | 0.05 |
Looking at asynchronies between the bell and the bass at specific metric locations, position 4 (ponche) on the two-side is again noteworthy: this location is statistically significant, has the greatest mean asynchrony (−19 ms; see Table 7) and the greatest number of onsets outside the ±20 ms threshold (12 of 27, 44%). Between the bell and the piano, metric location 1 on the two-side has the greatest mean asynchrony where the piano plays ahead by −35 ms (see again Table 8), with 6 of the 7 onsets (86%) outside the range ±20 ms. All but locations 6 and 6.5 are statistically significant.
Turning attention to the musicians’ perspectives on relative timing, the bassist Elpidio Caicedo, who plays on this extract, gave this account of his own playing:
I try to play on the beat. Yeah, I think one of my skills maybe is that the way you can play on time, it’s like a clock ticking […] I don’t try to push. I play the same. I try to keep the same timing and hope that the people can, you know, go with me. Sometimes they don’t.Footnote 56
The pianist Sara McGuinness, who plays with Caicedo on the extract, commented on her own timing, that of Caicedo and the timing of other musicians with whom she performs regularly:
You’ve got the anticipation and the excitement and it’s not about playing exactly on the beat, that sort of tension and that kind of excitement in the music. It’s about how you all work together as a group, I think, the combination that grooves together. And I think in salsa and son it’s not always the same instrument, it depends on the group of musicians. You have some people who tend to push it ahead and some people who hold it back. And [X] is a fantastic musician, but he pushes like crazy and if you play with him on the percussion it’s a disaster, whoosh, it goes like that [tempo increases]. I mean Elpidio is the most solid, he’s there, he’s solid as a rock in terms of his groove. I’m spoilt.
I tend to push ahead a bit. But the thing that I think is really important is the 4-and, and the 1 [demonstrates piano montuno], those are the accents. The ‘dom-dom’ at the end, which is the beginning of the two-bar [clave sequence].Footnote 57
McGuinness makes several important points about timing relationships and groove that deserve comment. First, she perceives Caicedo as a bass player with ‘solid’ timing. This underscores his own comments, that he tries ‘to keep the same timing’ and not push. Listening to his bass playing in isolation on this extract, one hears that it is very even, solid, feels good, has little accentuation and grooves very well. In quantitative terms, his solidity translates into a very strong coupling with the bell of r = 0.98 and a phase alignment very slightly ahead of the bell by μ = −6.35° (see again Table 6).
Secondly, she perceives her own timing preference as pushing ‘ahead a bit’, with important accents on the consecutive metric locations 4-and on the three-side and 1 on the two-side of the clave. As McGuinness states in her interview, these are important and accented metric locations that mark the ‘beginning of the two-bar [clave sequence]’. Looking at the timing data, she does play slightly ahead by an average of μ = −7.89° (see again Table 6). For the metric locations she refers to (8.5 and 1; see again Table 8), only location 1 is statistically significant. Although there are just seven onsets, this location has the greatest level of asynchrony with an average of −35 ms. Whether these accents are due to intensity/volume or timing asynchronies is an open and interesting question. I would suggest that it is a combination of the two.
Thirdly, she says that although individual musicians may have timing preferences that contribute to their own particular playing style and musical personality, a successful ensemble groove is a collective phenomenon, born from a combination of these preferences and how they interact during performances. In her words: you need ‘the combination that grooves together’. Other musicians have made similar assertions. As the salsa bass player Ruben Rodríguez puts it when talking about his relationship with his fellow salsa musician the pianist Eddie Palmieri, ‘When I play with a pianist who pushes the tempo like Palmieri I try to pull him back. If they play behind then I have to push.’Footnote 58 This highlights how the process of rhythmic interaction or entrainment may play its part in shaping relative timing and groove production within the rhythm section.Footnote 59 Entrainment and groove are explored further in the analysis of the third and final extract.
Extract 3: AS group
The AS group tempo graph (see Appendix, Figure 9a) shows that, unlike in the previous performance extracts, in this group the bell remains relatively consistent until around 48 seconds, when there is a marked increase in tempo. More precisely, from 0 to 48 seconds the average bpm is 105.70 (SD = 2.76), and from 48 seconds to the end of the extract at 66 seconds the tempo increases by 2.54 beats per minute to an average of 108.24 (SD = 1.34). The increase coincides with a sectional change from the vocal solo to the final chorus and is slight but audible on listening. This ‘gear change’ provides contrast with the previous section and helps increase the feeling of tension and excitement in the groove as the performance builds, and then moves to a climax.
An interesting picture emerges when looking at relative phase between the bell and the bass/guitar before and after this tempo change (see Table 9). From 0 to 48 seconds the bass has a tendency to play ahead of the bell (by μ = −2.55°), while from 48 to 60 seconds the bass shifts to a more behind orientation (μ = 7.72°). Then, from 60 to 66 seconds the bass returns to a more ahead orientation just before the extract ends (see the relative phase graph in Figure 9b in the Appendix). My interpretation is that as the bell tempo increases, the bass falls behind slightly, and then takes a small amount of time to react and adjust relative phase before returning to a similar, ahead of the bell orientation.
SUMMARY CIRCULAR STATISTICS (AS GROUP) FOR THE INSTRUMENTAL PAIRS BELL/BASS AND BELL/GUITAR BEFORE AND AFTER THE TEMPO CHANGE
| Bell/Bass | Bell/Guitar | |
|---|---|---|
| before tempo change (0–48 secs) | ||
| number of observations | 66 | 107 |
| mean vector (μ) | −2.55° | −16.18° |
| length of mean vector (r) | 0.96 | 0.91 |
| circular standard deviation | 10.85° | 24.35° |
| Rayleigh test (Z) | 63.67 | 89.31 |
| Rayleigh test (p) | 1E−12 | 1E−12 |
| after tempo change (48–66 secs) | ||
| number of observations | 28 | 46 |
| mean vector (μ) | 7.72° | −7.01° |
| length of mean vector (r) | 0.95 | 0.93 |
| circular standard deviation | 19.15° | 21.44° |
| Rayleigh test (Z) | 25.04 | 39.99 |
| Rayleigh test (p) | 8.80E−11 | 1E−12 |
However, the guitar maintains a more constant phase relationship with the bell across the tempo increase, but does change from playing more ahead (μ = −16.18°) before the tempo change to a decreased μ = −7.01° afterwards. The length of the mean vector (see again Table 9) remains almost constant throughout: for the bass r = 0.96 then 0.95, and for the guitar r = 0.91 then 0.93. This suggests that although the bass and the guitar may adjust their timing in relation to the bell at the tempo change (albeit by very small amounts), they are entrained and remain tightly synchronized to it. If my interpretation is correct, it shows the nuanced ways in which entrained musicians work in time together to maintain synchrony during groove production.
There are no noteworthy timing features for specific metric locations between the bell and the bass. Only locations 6.5 and 8, where the mean asynchronies are −8 ms and −3 ms with 25% and 34% of the onsets ±20 ms respectively (see Figure 5 and Table 10), are statistically significant. Between the bell and the guitar, however, metric locations 2.5, 4.5 and 8.5 are noteworthy. These three locations, where the guitar plays ahead by an average of −24 ms, −20 ms and −21 ms (see Figure 6 and Table 11), are statistically significant. Location 2.5 has the greatest number of onsets ±20ms (6 of 9, 67%), then 6.5 (15 of 27, 56%) and 4.5 (13 of 29, 45%). Listening to the guitar and the bell, these metric locations sound accented and pushed, which makes sense musically because they are a key component in the bass–piano ‘staggered anticipation’ effect highlighted earlier, where the syncopations preceding strong locations (1 and 3) in every bar are accented. Again, further research is needed to determine whether these perceived accents are due to intensity/volume, timing asynchronies or a combination of the two.
Asynchronies (ms) by metric location for the instrumental pair bell and bass (AS group).

STATISTICAL SUMMARY OF ASYNCHRONIES BY METRIC LOCATION FOR BELL VS BASS (AS GROUP)
| Bell vs Bass | two-side | three-side | |||
|---|---|---|---|---|---|
| Metric location | 2.5 | 4 | 6 | 6.5 | 8 |
| total onsets | 4 | 26 | 4 | 24 | 29 |
| mean (ms) | 20 | 10 | 10 | −8 | −3 |
| SD | 53 | 19 | 7 | 16 | 21 |
| ANOVA (p) | 0.54 | 0.08 | 0.31 | 2.33E−05 | 0.008 |
Asynchronies (ms) by metric location for the instrumental pair bell and guitar (AS group).

STATISTICAL SUMMARY OF ASYNCHRONIES BY METRIC LOCATION FOR BELL VS GUITAR (AS GROUP)
| Bell vs Guitar | two-side | three-side | ||||||
|---|---|---|---|---|---|---|---|---|
| Metric location | 1 | 2 | 2.5 | 3 | 4.5 | 6 | 6.5 | 8.5 |
| total onsets | 3 | 12 | 9 | 25 | 29 | 13 | 28 | 27 |
| mean (ms) | −10 | −9 | −24 | −7 | −20 | 0 | −15 | −21 |
| SD | 7 | 23 | 21 | 23 | 19 | 15 | 15 | 22 |
| ANOVA (p) | 0.06 | 0.11 | 0.001 | 0.03 | 5.41E−09 | 0.14 | 5.77E−10 | 4.97E−09 |
When asked about timing preferences, the Havana musician Michel Salazar, the AS group bassist who plays on this extract, said:
In Cuban bass, you must be in time [but] you must think like more ahead, like movimiento [movement]. In the montuno, the tempo changes, just a bit faster but not too much. But in all the songs you have to keep the time, the same time, the same time. It’s for more excitement; it’s for the dancers because in the body of the song they dance a different way with their partners, with the lady. In the montuno they split the dancers and make another step.Footnote 60
The notion that the bass plays synchronously but slightly ahead to add a sense of movement to the groove ties in with the above timing data: he plays marginally ahead of the bell by μ = −2.55° (see again Table 9) before the tempo and sectional change at 48 seconds. Additionally, Salazar comments that the tempo changes should be ‘just a bit faster but not too much’ in order to satisfy the dancers. In this performance extract, the tempo change is around 2.5 beats per minute.
Adolfo Gonzalez, the guitarist and tresero Footnote 61 in the AS group, spoke of the relatedness between timing and specific regions of Cuba. He originated from Guantánamo in the east of Cuba but also studied guitar and tres in Havana, where he now lives and performs.
In the case of the tres, there are many ways of playing. For example, in changüí Footnote 62 that comes from Guantánamo, the way of playing tres is much more African. You play around with timings, in the percussion as well as with the tres. There is another way of playing tres that is called borracho [drunk], because the time goes in one way and you do the melodies as if you are out of time. Actually, you are ok, inside the time [sings in a dragging behind fashion] but it looks like you are drunk. I like to play like that, drunk.Footnote 63
Despite his preference for playing ‘drunk’ (behind), the timing data shows that, in this extract, the montuno is played slightly ahead before the tempo change by μ = −16.18° (see again Table 9). These comments echo those made earlier by Balfour, Riamba’s pianist, who also felt that the instrumentalist playing the montuno should play with a ‘lazy’, behind feel. It is unsurprising that pianists and treseros share similar notions of phase preferences on their respective instruments. These instruments fulfil a very similar role within the rhythm section (they both play the montuno pattern), and furthermore, it has been argued that within son and salsa traditions the tres has had a direct influence on the role of the piano since the early 1940s.Footnote 64 Although musicians formulate shared notions of relative timing on particular instruments within musical traditions, as Gonzalez points out, there are many ways of ‘playing around with timings’ and timings can vary from region to region in Cuba.
Conclusions
The aim of this article was to integrate ethno/musicological, ethnographic and microtiming analyses to examine and quantify how expert rhythm-section musicians play in time together when producing a groove in real-world performances of son and salsa.
The ethnography reveals that rhythm-section musicians share similar concepts about groove, instrumental roles and how relative timing should be: the bell provides a steady anchor, the bass plays ahead, while the piano/guitar/tres pattern is played behind. However, these concepts vary. For example, in the HCD group the bass player said that he tries to play steady, not ahead, whereas musicians in the RI and AS groups thought that the bass plays ahead. Similarly, the pianist in the RI group and the guitarist in the AS group said that the intention was to play the montuno pattern with a lazy, behind feel, but in the HCD group the pianist said that she tends to push the montuno pattern slightly.
Another theme that emerges is that while musicians often share concepts with regard to their own timing and that of fellow instrumentalists, relative timing is malleable in performance situations, shaped by individual preferences, group dynamics and the rhythmic interactions between musicians as they work together to negotiate a groove that has a sense of anticipation, excitement and forward movement. Previous musicological research suggests that the repeated patterns that comprise the rhythmic-harmonic structure of the montuno are influential in providing these feelings. Additionally, musicians report that the microtimed relationships between rhythm-section performers playing tightly synchronized but with slight separation is a key component in groove production.
Timing analyses using circular statistics produce a snapshot of how relationships are ‘played out’ between musicians in live performances and provide quantitative measures of the level of synchrony and separation. In the three performances analysed, the length of the mean vector shows that synchrony is higher between the bell and the bass (around r = 0.95) than it is between the bell and the piano/guitar (around r = 0.85), which suggests that bass players enjoy a tighter relationship with the bell than with pianists/guitarists. The mean vector suggests that bass players have a tendency to play slightly ahead or behind by around μ = 5°, while piano/guitar players have a tendency to play ahead by around μ = 9°, despite two musicians (RI and AS groups) saying that they had the intention to play behind.
A combination of ethnography and absolute measures in milliseconds suggests a relationship between timing, structure and groove. In two group performances, the greatest asynchronies were found between the bell and the bass on metric location 4 on the two-side of the clave (an average of 38 ms and −19 ms, RI and HCD groups). Between the bell and the piano, average asynchronies of 35 ms were found on location 1 on the two-side of the clave (HCD group), and an average of −24 ms between the bell and guitar were found on 2-and on the two-side of the clave (AS group). These metric locations are significant in the son/salsa tradition. The bass note on 4, or the ponche, is accented and anticipates the harmonic change. Both of the piano/guitar notes are accented, metric location 1 marks the beginning of the harmonic sequence, and 2-and is the anticipation of metric location 3 on the two-side.
The approach used in this article has provided insights into some of the complexities of groove production. Suggestions for future research include closer examination of the relationship between accents, key metric locations within the clave sequence and musicians’ timing – something only touched upon here. Second, the current study has used only the bell as a timing reference. Expansion to include the timing relationships within the whole rhythm section (maracas, guiro, clave, congas, etc.) would provide a more complete picture of structure, timing and groove. Lastly, another fruitful area of study would be to examine how groove changes (or does not change) across the binary son–montuno structure, which is pervasive in many Afro-Cuban and related styles.
APPENDIX
RI group, tempo and relative phase graphs
Bell tempo, extract 1, RI group, with trend line based on a moving average of 5 data points. Average bpm = 112.84, SD = 3.42.

Relative phase for the instrumental pair bell and bass, extract 1, RI group, with trend line based on a moving average of 5 data points.

Relative phase for the instrumental pair bell and piano, extract 1, RI group, with trend line based on a moving average of 5 data points.

HCD group, tempo and relative phase graphs
Bell tempo, extract 2, HCD group, with trend line based on a moving average of 5 data points. Average bpm = 100.13, SD = 2.06.

Relative phase for the instrumental pair bell and bass, extract 2, HCD group, with trend line based on a moving average of 5 data points.

Relative phase for the instrumental pair bell and piano, extract 2, HCD group, with trend line based on a moving average of 5 data points.

AS group, tempo and relative phase graphs
Bell tempo, extract 3, AS group, with trend line based on a moving average of 5 data points. Average bpm = 106.34, SD = 2.71.

Relative phase for the instrumental pair bell and bass, extract 3, AS group, with trend line based on a moving average of 5 data points.

Relative phase for the instrumental pair bell and guitar, extract 3, AS group, with trend line based on a moving average of 5 data points.