I. INTRODUCTION
Titanium dioxide (TiO2) is a widely used catalytic material due to its excellent stability and physical–chemical properties. It has demonstrated a wide range of application potentials in hydrogen production, lithium-ion batteries, fuel cells, gas sensors, detoxification, photovoltaic, photocatalysts, and supercapacitors.Reference Yang, Sun, Qiao, Zou, Liu, Smith, Cheng and Lu1–Reference Greene, Law, Yuhas and Yang13 The one-dimensional (1D) morphology, such as TiO2 nanowire (NW), is considered as a superior candidate for achieving higher performance in those applications compared to the bulk form. For example, a TiO2 NW-based electrode can provide large surface area for effectively collecting photons and/or electrons.Reference Liu and Aydil4 The high crystal quality of the NWs is essential for reducing the scattering effect and hence improving the electron mobility. In addition, using TiO2 NWs as electrodes could be beneficial to the mechanical stability of the device.Reference Jiu, Isoda, Wang and Adachi2, Reference Liu and Aydil4 Typically, TiO2 exhibits three different polymorphs (anatase, brookite, and rutile), which have different properties and result in different performance. Therefore, to synthesize TiO2NWs with defined phase, shape, dimension, and high quality, crystallinity is of fundamental importance for achieving desired functionality and performance.
Nonetheless, a well-controlled growth of TiO2 NW is rather challenging due to the existence of multiple polymorphs and the thermodynamically unfavorable crystallography for anisotropic crystal growth.Reference Barnard and Zapol14, Reference Barnard and Curtiss15 Templated sol–gel method, hydrothermal synthesis, and electrospinning process have been demonstrated for creating the NW morphology.Reference Miao, Xu, Ouyang, Guo, Zhao and Tang16–Reference Hosono, Fujihara, Kakiuchi and Imai19 However, the phase purity/selectivity, crystallinity, and impurity involvement are typical concerns of these methods.Reference Bavykin, Friedrich and Walsh20 For example, a large quantity of titanates usually can be found from the products of hydrothermal methods. Electrospinning and sol–gel methods often yield polycrystalline TiO2.Reference Liu and Aydil4, Reference Miao, Xu, Ouyang, Guo, Zhao and Tang16–Reference Formo, Lee, Campbell and Xia18, Reference Bavykin, Friedrich and Walsh20 Postheat treatment always is needed to improve the crystallinity of NWs.Reference Bavykin, Friedrich and Walsh20 It is usually difficult to control the dimension of TiO2 NWs by hydrothermal methods whose products often have large size variation.Reference Zhang, Li, Jin, Zhang, Zhang and Zhang17, Reference Yoshida, Suzuki and Yoshikawa21 Because a high degree of supersaturation is required for NW growth, growing uniform TiO2 NWs onto complex surfaces is very challenging.Reference Yoshida, Suzuki and Yoshikawa21 Templated sol–gel methods usually produce polycrystalline TiO2 NWs.Reference Miao, Xu, Ouyang, Guo, Zhao and Tang16 Although dye-sensitized solar cells have been fabricated based on such TiO2 two-dimensional (2D) NW arrays, the device performance was jeopardized by the NWs’ massive trapping states and low electrical conductivity.Reference Miao, Xu, Ouyang, Guo, Zhao and Tang16, Reference Chen, Lee and Wang22 In addition, the NWs’ density and arrangement are determined by the template (porous oxide substrates). Therefore, it is unlikely to arrange the distribution and orientation of NWs in micro- or submicroscale. Electrospinning is regarded as a simple, scalable, and low-cost method for TiO2 NW synthesis.Reference Formo, Lee, Campbell and Xia18 However, out-of-plane alignment of NWs is very hard in this process, which limits the utilization of such TiO2 NWs in devices requiring intimate contact between NWs and substrate (or electrode).Reference Feng, Shankar, Varghese, Paulose, Latempa and Grimes23 Similar to the sol–gel methods, the polycrystallinity of NWs and the lack of microscale arrangement controllability are two other disadvantages for applying the electrospinning technique in the fabrication of TiO2NW-based energy harvesting devices.
Compared to the solution-based synthesis approaches, high temperature vapor deposition can achieve higher crystal quality of TiO2 NWs with significantly improved electrical properties.Reference Wu, Shih, Wu, Tseng and Chen24, Reference Amin, Nicholls and Xu25 Through a vapor–liquid–solid (VLS) process, the location of NWs can be precisely controlled by patterning metal particle catalysts.Reference Ha, Sosnowchik, Lin, Kang and Davydov26, Reference Kim, Baik, Zhang, Larson, Li, Stucky, Moskovits and Wodtke27 Engineering the vapor precursor partial pressure can manipulate the growth kinetics and achieve NW morphology control.Reference Pradhan, Reucroft, Yang and Dozier28 The ability of controlling exposed crystal facets of single crystal TiO2 NWs is crucial for catalysis applications.Reference Yang, Sun, Qiao, Zou, Liu, Smith, Cheng and Lu1, Reference Zhang, Li, Jin, Zhang, Zhang and Zhang17 However, large-scale controlled synthesis of TiO2 NWs via vapor deposition is still a challenge due to the extreme low vapor pressure and high melting point of Ti that results in a very small and sensitive deposition condition window for the formation of TiO2 NW morphology.Reference Wu, Shih, Wu, Tseng and Chen24 As a result, TiO2 NWs grown by vapor deposition are still suffering from their large area nonuniformity and rough or defective crystal surfaces.Reference Pradhan, Reucroft, Yang and Dozier28 Recently, our group demonstrated a surface-reaction-limited pulsed chemical vapor deposition (SPCVD) technique that can grow highly uniform single-crystalline TiO2 nanorods (NRs, e.g., short NWs) over a large area, even inside highly confined submicrometer-sized spaces.Reference Shi, Sun, Starr and Wang29 This technique has the potential to achieve a large-scale synthesis of TiO2 1D nanostructure arrays with controlled dimensions and phases. This paper reviews the 1D anisotropic growth mechanism of TiO2 crystals via SPCVD, the morphology and phase control of TiO2NRs, and promising application potential as photoelectrochemical (PEC) anode for water splitting.
II. TiO2 NR GROWN BY SPCVD TECHNIQUE
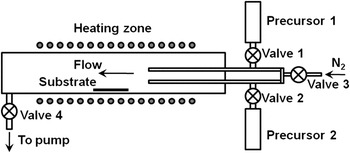
SPCVD can be considered as a derivative of the atomic layer deposition (ALD) technique that has been widely applied to the growth of conformal thin films with precisely controlled thickness down to the subnanometer level.Reference George30 The SPCVD reaction system is schematically shown in Fig. 1. The reaction chamber was a stainless steel flow type tube with a diameter of 35 mm, which was located inside a tube furnace. Two precursors were connected to two separated 1/8″ tubes through solenoid valves and extended to the center of the growth chamber. Substrate was located at the center and ∼5 cm away from the precursor injection nozzle. A constant flow of 40 sccm N2 was introduced into the chamber as the carrier gas and could be turned on/off by valve 3. The growth chamber was continuously pumped by a mechanical pump to a base pressure of ∼300–400 mTorr, and the connection was controlled by valve 4. Both valves 3 and 4 were always on unless a dwelling cycle was applied. The chamber temperature was maintained at 600 °C. TiCl4 and H2O vapor precursors were pulsed into the chamber for 1.5 s each and separated by N2 purging for 60 s. One complete growth cycle included 1.5 s of H2O pulse + 60 s of N2 purging + 1.5 s of TiCl4 pulsing + 60 s of N2 purging. Because of the similar cyclewise operation process as ALD, SPCVD inherited the unique conformal coating merit of ALD and is able to achieve conformal growth of TiO2NRs arrays inside highly confined spaces, such as anodic aluminum oxide (AAO) nanochannels. Formation of NR morphology was believed to be due to the high deposition temperature and elongated purging time.
Schematic SPCVD growth system.

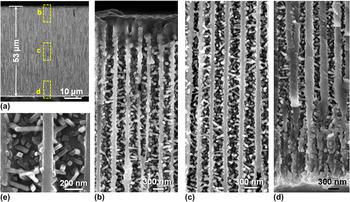
The as-grown TiO2 NR-coated AAO channel is show in Fig. 2. Figure 2(a) shows the cross section of the AAO template after 660 cycles of SPCVD growth. Scanning electron microscope (SEM) images acquired from the top, middle, and bottom sections are shown in Figs. 2(b)–2(d), respectively, revealing the uniform and dense coverage of TiO2 NRs along the entire channel length. Closer examination shows that all NRs were rooted on the walls of the AAO channels and pointed inward [Fig. 2(e)]. The majority of the as-synthesized TiO2 NRs had lengths and widths of between 170–210 and 25–30 nm, respectively. Transmission electron microscopy (TEM) and x-ray diffraction spectrum revealed that the NRs were single-crystalline anatase TiO2.
(a) A cross section of the AAO template after 660 cycles of SPCVD growth. (b–d) The uniform and dense coating of TiO2 NWs inside the AAO channels at the top, middle, and bottom sections, respectively, as indicated by the dashed yellow boxes in (a). (e) Higher magnification SEM of TiO2NWs rooted on the walls of AAO channels.

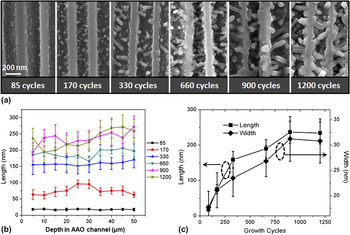
The evolution of TiO2 NRs inside AAO channels was first investigated by observing the morphologies after growth cycles of 85, 170, 330, 660, 900, and 1200, respectively [Fig. 3(a)]. Statistical analysis revealed a fairly uniform NR geometry distribution inside AAO channels [Fig. 3(b)]. This growth behavior was similar to the unique conformal coating feature of ALD. Length and width measurements revealed a faster growth rate in the first several hundred cycles [Fig. 3(c)]. Before the 330-cycle growth point, the average growth rate along the length was ∼0.5 nm/cycle, while subsequent rate dropped to ∼0.1 nm/cycle. Growth rate along the width direction was ∼0.03 nm/cycle. The slower growth rate was possibly the consequence of less volume left in the AAO channel for precursor transportation when the sizes of NRs became larger. The length of NRs saturated at 230–240 nm, which correlated with the average diameter of the AAO channels (∼250 nm).
(a) SEM images of typical NW morphology after different SPCVD cycles. (b) Length distribution analysis of the NWs grown by different number of SPCVD cycles. (c) Plots of NW length and thickness versus growth cycles.

A typical TiO2 NR morphology observed by TEM is shown in Fig. 4(a), where the NR exhibited a highly uniform thickness, well-faceted surfaces, and an aspect ratio of ∼7. Uniform contrast was observed on the corresponding dark field image [Fig. 4(b)], indicating the high lattice quality and a dislocation-free structure. No foreign elements, such as Cr that may be released from the stainless steel reactor,Reference Danon, Bhattacharyya, Vijayan, Lu, Sauter, Gray, Stair and Weitz31 was detected, and the as-synthesized TiO2 NRs exhibited a sharp cutoff absorption wave length at ∼400 nm.Reference Shi, Hara, Sun, Anderson and Wang32 Selected area electron diffraction (SAED) taken on the NR further confirmed the anatase structure [inset of Fig. 4(c)] with the {100} as side surfaces and the {011} as the surfaces in-plane of the image.Reference Zhang, Li, Jin, Zhang, Zhang and Zhang17 Combination of the [002] and  $[0\bar 11]$ directions was identified as the NR growth direction. High-resolution transmission electron microscopy (HRTEM) clearly revealed the arrangement of the (002) and
 $(0\bar 11)$ planes along the NR growth direction with a lattice spacing of 0.48 and 0.35 nm, respectively [Fig. 4(c)]. Based on the SEM, SAED, and TEM observations, structure of the anatase NRs is constructed and illustrated in Fig. 4(d). The four side planes of the NR are (011),
 $(0\bar 1\bar 1)$, (100), and
 $(\bar 100)$. They are perpendicular to each other and form a rectangular cross section.
(a, b) Bright field and dark field TEM images of a single-crystalline anatase TiO2 NR demonstrating high thickness/width uniformity and excellent crystal integrity. (c) HRTEM image of the TiO2 NR. Inset is the corresponding SAED pattern. (d) Proposed TiO2 NR structure shaped by three groups of atomic planes: 6, 6, and 6. A unit cell is represented by a cube with a, b, and c parallel to the [100], [010], and [001] directions, respectively. (e) HRTEM image of a typical NW tip faceted by the (001), (011),  $(0\bar 1\bar 1)$, and
 $(0\bar 11)$planes.

III. 1D MORPHOLOGY FORMATION MECHANISM
Understanding the 1D anisotropic growth mechanism by SPCVD is essential for achieving morphology control and applying this capable nanomaterial synthesis technique to different material systems. The key is to understand the evolution of 1D morphology from a textured polycrystalline thin film by ALD. Early research on ALD showed that crystalline TiO2 thin films could be grown at 600 °C using TiCl4 and H2O as precursors.Reference Ritala, Leskela, Nykanen, Soininen and Niinisto33 The differences for achieving NR growth were only the elongated purging time (60 s) and highly confined submicrometer-sized spaces.
The surface restructuring and surface (or gas phase) diffusion mechanisms that were responsible for the surface roughness of ALD films were adapted to explain the evolution of NR morphology. Ideally, TiCl4 and H2O are anchored onto the growing surface by reactions:
 $${\rm{-OH(surf}}{\rm{.)}} + {\rm{TiCl}}_{\rm{4}} {\rm{(g)}} \to {\rm{-\!O\!-\!\!TiCl}}_{\rm{3}} {\rm{(surf}}{\rm{.)}} + {\rm{HCl(g),}}$$
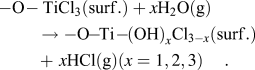 $${\rm{-O\!-TiCl}}_{\rm{3}} {\rm{(surf}}{\rm{.)}} + x{\rm{H}}_{\rm{2}} {\rm{O(g)}} \to {\rm{-O\!\!-\!\!Ti\!-\!\!(OH)}}_x {\rm{Cl}}_{{\rm{3}} - x} {\rm{(surf}}{\rm{.)}} +\,\, x{\rm{HCl(g) (}}x = 1,2,3{\rm{)}}{\rm{.}}$$
Meanwhile, the surface –OH and –Cl groups can also react with each other forming surface bridging groups:
 $${\rm{\!Ti\!\!-\!\!OH(surf}}{\rm{.)}} + {\rm{Ti\!\!-\!\!OH(surf}}{\rm{.)}} \to {\rm{Ti\!\!-\!\!O\!\!-\!\!\!Ti(surf}}{\rm{.)}} + {\rm{H}}_{\rm{2}} {\rm{O(g),}}$$
 $${\rm{Ti\!\!-\!\!OH(surf}}{\rm{.)}} + {\rm{Ti\!\!-\!\!Cl(surf}}{\rm{.)}} \to {\rm{Ti\!\!-\!\!O\!\!-\!\!Ti(surf}}{\rm{.)}} + {\rm{HCl(g)}}{\rm{.}}$$
The Ti–O–Ti bridging groups are acidic due to cation polarization. They could also reversibly react with TiCl4 with a much slower rate compared to the –OH groups:
 $${\rm{Ti\!-\!O\!-\!Ti(surf}}{\rm{.)}} + {\rm{TiCl}}_{\rm{4}} {\rm{(g)}} \leftrightarrow {\rm{Ti\!-\!O\!\!-\!\!TiCl}}_{\rm{3}} {\rm{(surf}}{\rm{.)}} + {\rm{Ti\!-\!Cl(surf}}{\rm{.)}}{\rm{.}}$$
Reactions (3)–(5) are responsible for the reduced growth rate in ALD. Furthermore, HCl by-products also could make important contributions to the growth, particularly at high temperature, if they are not quickly removed from the growing surfaces:
 $${\rm{Ti\!\!-\!\!OH(surf}}{\rm{.)}} + {\rm{HCl(g)}} \leftrightarrow {\rm{Ti\!\!-\!\!Cl(surf}}{\rm{.)}} + {\rm{H}}_{\rm{2}} {\rm{O(g),}}$$
 $${\rm{Ti\!\!-\!\!O\!\!-\!\!\!Ti(surf}}{\rm{.)}} + {\rm{HCl(g)}} \leftrightarrow {\rm{Ti\!\!-\!\!OH(surf}}{\rm{.)}} + {\rm{Ti\!\!-\!\!Cl(surf}}{\rm{.)}}{\rm{.}}$$
Equations (6) and (7) are the reversed reactions of (2) and (4), respectively. Thus, reaction (6) is a backward reaction and would reduce the growth rate, while reaction (7) could reactivate the bridging groups and facilitate the growth. Different combination of reactions (1)–(7), together with the diffusion of HCl by-product, could induce different growth rate along different crystal surfaces and thus faceted anisotropic growth might be possible.
TEM observations (Fig. 4) revealed that the NRs were grown along the combination of the [002] and [011] directions and the {011} and {100} planes were the side surfaces. Two possible mechanisms were suggested—surface recombination and HCl restructuring.
A. Surface recombination
From the crystal structure of anatase TiO2, we found that the (001) surface would have higher resistance to the active group recombination reactions [reactions (3) and (4)] compared to the {011} and {100} facets.Reference Shi, Sun, Starr and Wang29 Therefore, only the (001) surfaces exhibited kinks and ledges that were favorable sites for crystal growth [Fig. 4(e)].
B. HCl restructuring
Desorption of HCl typically requires higher energy than that for H2O molecules. This situation would become more prominent inside narrow and highly confined spaces. Thus, during the long purging step, as H2O molecules being quickly removed from the growth sites at high temperature, residual HCl would convert the active –OH groups to –Cl that is not reactive to the TiCl4 precursors [reaction (6)]. Due to the larger Ti–Ti distance on the (001) surface, larger strain is likely possessed by the Ti–O–Ti bridges, which make this “inert” bridge more reactive to HCl, thus reactivate the growing surface [reaction (7)]. These two mechanisms do not conflict with each other and may take effect simultaneously. For example, combination of reactions (4) and (7) could cause the active groups to move on crystal surfaces and reach more stable sites where recombination rate is low. Therefore, TiO2 NRs were grown by rapid surface chemical reaction on the active (001) planes but growth limited to an equal degree on the inert {100} and {011} facets. This explains the anisotropic growth behavior of anatase TiO2NRs.
IV. PHASE AND MORPHOLOGY CONTROL
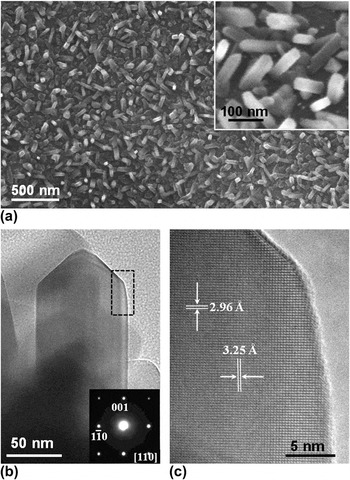
At 600 °C, SPCVD can grow highly uniform anatase TiO2 NRs over a large area, even inside highly confined submicrometer-sized spaces. By increasing the deposition temperature to 650 °C with other deposition conditions unchanged, the phase of NRs was turned into rutile.Reference Shi and Wang34 After 1000 growth cycles, short NRs were resulted covering the entire Si substrate surface [Fig. 5(a)]. The NRs were typically a few hundred nanometers long and tens of nanometer wide. Most of them had a rectangular cross section [inset of Fig. 5(a)]. TEM image showed that the TiO2 NRs had a typical sword-like shape [Fig. 5(b)].Reference Barnard and Curtiss15 The single-crystalline rutile structure was confirmed by the SAED pattern as shown in the inset of Fig. 5(b). Sharp surfaces and dislocation-free lattice of the rutile TiO2 NRs were identified by the HRTEM image shown in Fig. 5(c). The rutile NRs were grown along the [001] direction and surrounded by four equivalent {110} surfaces. This experiment showed that simply increasing the deposition temperature could change the phase of TiO2NRs from anatase to rutile but had negligible influence on the NR morphology.
(a) SEM image of rutile TiO2 NRs grown on Si substrate. Inset is the magnified image of the TiO2 NRs. (b) TEM image of a TiO2NR. Inset is the corresponding SAED pattern confirming the rutile phase. (c) HRTEM image of the NR acquired from the rectangle region in (b).

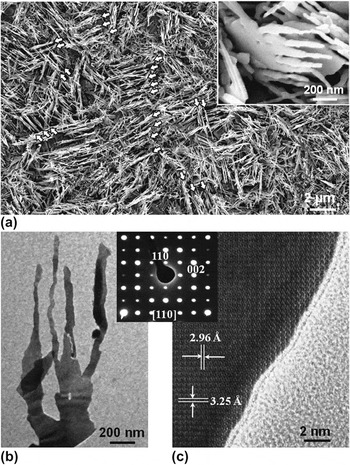
Typically, growth of NWs can be facilitated by introducing noble metal catalysts, such as Au, to expedite the nucleation and/or deposition. TiO2 NR morphology evolution was thus studied with the presence of Au catalysts by sputtering ∼5-nm-thick Au thin film on a silicon substrate. The deposition was conducted at 650 °C and a completely different morphology was resulted. Figure 6(a) shows a low magnification SEM image of the as-grown TiO2 NWs on silicon substrate. The entire substrate was covered by a large quantity of NWs, where short-range alignments of the NWs can be observed. The aligned NW region typically consisted of a few rugged strips that were parallel to each other. Both the distance between neighboring strips and the width of each strip were around a few hundred nanometers. This local alignment phenomenon indicated that the parallel strips likely originated from a crystallized film underneath. Tilted image of the NW sample revealed that the aligned arrays were actually packed TiO2 flakes with spaced NWs grown on the topside, where several NWs with rough surfaces and nonuniform widths could be clearly seen growing along the same orientation [inset of Fig. 6(a)]. These NWs shared the same thickness as the base flakes, while their widths decreased from the bottom (∼100 nm) to the tip (∼20–30 nm). The lengths of those NWs were typically 1–2 μm.
(a) SEM image of TiO2 nanostructures grown on Au-coated Si substrate. The quasialigned nanostructure arrays are pointed by white arrows. Inset is a tilted image showing the NWs-on-flake structure. (b) TEM image of a single piece of the NWs-on-flake structure. Inset is the SAED pattern confirming the single-crystalline rutie phase. (c) HRTEM images acquired from NW.

TEM images shown in Fig. 6(b) clearly revealed the NWs-on-flake structure and the curvy side surfaces of these NWs. This configuration suggested that the NWs were most likely formed by bifurcations of the flake matrix. Each bifurcation produced two branches as the newly formed small flakes or NWs. The branching took place at different vertical positions along the flakes until the width of the new flake became smaller than 100 nm, and thus, the NW morphology was resulted. The single-crystalline structure was confirmed by the SAED pattern shown in the inset of Fig. 6(b). The flat flake surface was the (110) facet, and the NWs were grown along the  $[1\bar 10]$ direction. HRTEM image revealed the perfect crystal structure of the NWs, as shown in Fig. 6(c). The uniform lattice pattern and contrast indicated that the NWs had a very uniform thickness. The lattice spacing measured from Fig. 6(c) and the lattice constants calculated from the SAED pattern further confirmed the rutile phase of the NWs. This high-quality lattice structure was found consistent over the entire flake–NW structure except the bifurcation regions.
Different from most other single crystal NW morphology made by either hydrothermal or vapor deposition approaches, which usually consisted of low index flat surfaces, the as-synthesized rutile TiO2 NWs showed curvy side surfaces,Reference Zhang, Li, Jin, Zhang, Zhang and Zhang17, Reference Wu, Shih, Wu, Tseng and Chen24 whereas no dislocations were observed, as shown in Fig. 6(c). The uniform contrast also indicated that the thickness along the curved edge was still uniform. Such curved side surfaces consist of high index crystal facets and thus renders much higher surface energy compared to the low index facets, which, as a result, might enhance the catalytic activity of the TiO2NWs.
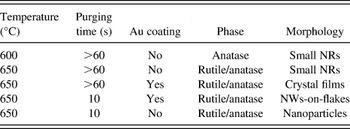
Further control experiments revealed that longer purging time only formed a quasicontinuous rutile TiO2 film when catalyzed by the same Au thin film. If no Au thin film was present and a short purging time (10 s) was used at 650 °C, only rutile TiO2 nanoparticles were observed, which was consistent with the experimental results conducted at 600 °C. From the control experiments, it was feasible to conclude that a thin layer of Au could facilitate the growth of crystalline TiO2 films during a SPCVD process. If the precursor was sufficient during the deposition, the films could evolve into bifurcated NWs. If the precursor supply was limited, the film-like morphology would not change. However, currently, it is still unclear about the exact role of Au during the growth. No Au was observed from the NWs by TEM after growth, suggesting that the Au did not likely act as the catalyst for a VLS growth. It might be possible that Au wetted Si at high temperature and created a large number of favorable sites on the surface for absorbing incoming molecules, thus facilitating 2D lateral growth.
The deposition condition related TiO2 nanostructure growth is summarized in Table I to illustrate their relationships. Comparing the first two conditions clearly shows that higher deposition temperature was the main reason for the formation of rutile phase since it is thermodynamically more stable than anatase phase at higher temperature.
Summary of the growth condition related TiO2 nanomorphologies.

V. PHOTOCATALYTIC PROPERTY OF TiO2 NW GROWN BY SPCVD
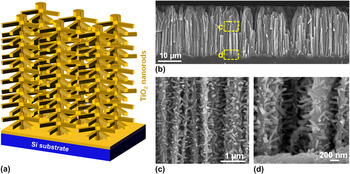
The unique capability of SPCVD for growing dense TiO2 NRs inside highly confined spaces allowed the creation of tree-like three-dimensional (3D) NW architectures that were ideal for high-performance PEC electrodes. The 3D NW architecture is schematically shown in Fig. 7(a). Vertically aligned Si NW arrays were used as the backbones, and high density TiO2 NRs were uniformly grown around the Si NWs. An additional thin film of anatase TiO2 was coated on the NR–NW heterostructure by ALD to completely cover Si NW surfaces. When this heterogeneous structure was used as a PEC anode for water splitting, photocatalyzed H2O oxidation reactions would only occur on the TiO2 surfaces. In principle, the photogenerated electrons should quickly be transported through the Si NW backbone and reach the counter electrode with minimal losses owing to the high conductivity of Si NWs and isolation from electrolyte.Reference Hwang, Boukai and Yang5, Reference Takabayashi, Nakamura and Nakato35 The very large surface area provided by the TiO2NR arrays together with the high-speed electron transport channels provided by the Si NWs are promising features that could lead to a significant improvement of PEC efficiency.
(a) Schematic tree-like TiO2 NR–Si NW 3D architectures. (b) Cross section of vertical Si NW arrays covered with TiO2 NRs. (c, d) The middle and bottom portions of Si NWs showing dense and uniform coverage of TiO2NRs along the entire NW length.

Vertical Si NW arrays made from dry reactive ion etching and metal-assisted wet etching were both successfully applied for TiO2 NR growth. For example, Fig. 7(b) shows the cross section of wet-etched Si NW arrays that were ∼25 μm in length. SEM images acquired along the length direction of the Si NWs forest confirmed the dense and uniform coverage of TiO2 NRs. These TiO2 NRs are 30 ± 6 nm in diameter and 243 ± 31 nm in length statistically. Figures 7(c) and 7(d) are two representative images indicating that the density and dimensions of TiO2 NRs were nearly identical at the middle and bottom regions. The NRs grew out laterally from the Si NWs and filled out the interspaces. Thus, considerably large surface area and high porosity were created by such a 3D architecture. Given that the density of TiO2 NR branches measured to be ∼20 per 1 μm Si NW length, and the average diameter and density of Si NWs at ∼100 nm and ∼10 NWs per square micrometers, respectively, the roughness factor of the TiO2NR–Si NW heterostructure was calculated to be ∼8 per micrometer in thickness (compared to ∼3 per micrometer for bare Si NW arrays). It should be noted that this number is a rough estimation from the observed NR dimension and density. The actual values may show big variation from this number due to the deviated density or distribution of the Si NW forest. For instance, the density of Si NWs is not uniform, and at certain areas, it could be much higher than 10 NWs per square micrometers. The bundling effect at the tip region of Si NWs could significantly reduce the available surface area locally. Therefore, this calculated roughness factor just presents a reference showing the capability of surface area density improvement by the 3D NW architectures. The actual value may vary sample by sample and the best way to determine it is to measure it experimentally.
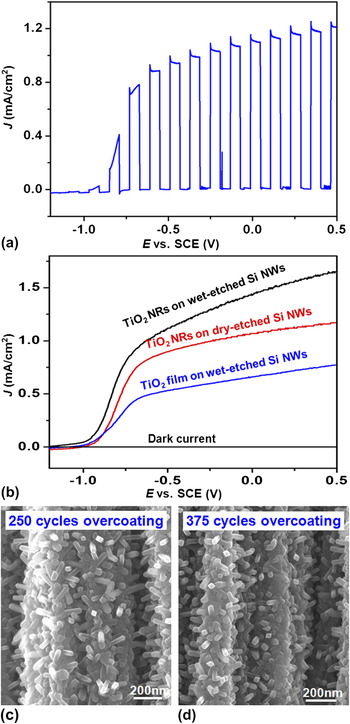
A 3D TiO2 NR–Si NW architecture was used as the photoanode for PEC water splitting. A typical plot of photocurrent density versus bias potential is shown in Fig. 8(a). Interrupted illumination was applied to demonstrate the instant dark current and photocurrent density. The dark current density remained at a very low level (<10−2 mA/cm2) under bias potentials between −1.2 and 0.5 V (versus saturated calomel electrode) indicating the high quality of the crystal surfaces of TiO2. The J-E curve exhibited a fill factor of 0.54 and short-circuit current density (J SC) of 1.14 mA/cm2, which demonstrated good charge transport properties and interfacial reaction chemistries of these 3D TiO2NR–Si NW anodes.
(a) J-E curve of TiO2 NR on 10-μm dry-etched Si NW under interrupted illumination. (b) J-E curves of different TiO2–Si NW configurations showing enhanced PEC performance by introducing high density TiO2 NR branches. (c, d) SEM images of TiO2 NR–Si NW structures after 250 and 375 cycles ALD overcoating, respectively. More overcoating cycles buried more TiO2 NRs in the TiO2 film.

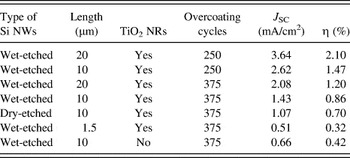
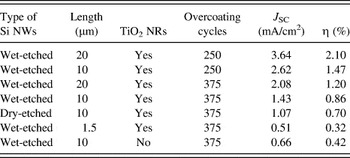
To demonstrate the merits of the 3D NW architectures as PEC anodes, performance of three TiO2–Si NW-based configurations were characterized and compared. They are wet-etched Si NWs with TiO2 NRs, dry-etched Si NWs with TiO2 NRs, and wet-etched Si NWs coated with a 375-cycle (∼37 nm) TiO2 film. Both TiO2 NR and Si NW samples were further overcoated with an additional 375-cycle TiO2 film to isolate Si NWs from KOH electrolyte. All the Si NW templates were 10 μm long. A light source with intensity of 100 mW/cm2 was provided by a 500 W Hg (Xe) arc lamp (Oriel, 66142, Irvine, CA). A liquid water filter (Oriel, 6123NS) was applied to eliminate the infrared light heating effect on electrolyte. Figure 8(b) shows the photocurrent density of these three samples as functions of the bias potential. The three plots followed the same trend and exhibited the same V OC, while J SC of these samples were dramatically different. The TiO2 thin-film-coated Si NWs produced a J SC of ∼0.66 mA/cm2, which was comparable to the value reported by others.Reference Hwang, Boukai and Yang5 Both NRs-coated samples exhibited significantly higher J SC owing to their larger surface areas. Because the density of wet-etched Si NWs was higher than that of dry-etched Si NWs, it yielded the highest J SC (∼1.43 mA/cm2), which was more than twice of what was produced by the thin-film-coated sample.
A series of 3D NW anodes with different lengths and overcoating thicknesses were fabricated and their performances were compared. The sample conditions, J SC, and efficiencies are summarized in Table II. As shown in Figs. 8(c) and 8(d), increasing overcoating cycles could “bury” more NRs in the TiO2 film and decrease the overall surface area of TiO2 crystals. Therefore, the highest efficiency (2.1%) was identified from the 20-μm sample with the 250-cycle overcoating (∼25 nm). This value was three times higher than that of TiO2 film–Si NWs core–shell structure. This comparison suggested that the 3D NW architecture is likely superior to straight NW arrays for PEC electrode design. The efficiency could be further improved by optimizing the number of overcoating cycles and the length/density of NW backbones.
Summary of photocurrent density and PEC efficiency of TiO2–Si heterostructures.
VI. CONCLUSION
SPCVD is a unique nanostructure growth technique. It mimics the self-limited growth mechanism of ALD using separated precursor pulses but utilizes much higher deposition temperature. It can effectively decouple the crystal growth from precursor concentration while retaining anisotropic 1D growth. Specifically, the SPCVD technique offers following unique merits.
(i) High density 3D NW network: SPCVD is, to our best knowledge, the first bottom-up approach that can uniformly grow NW arrays inside highly confined submicrometer-sized spaces forming high density 3D nanoarchitectures with uniform size and distribution.
(ii) High-quality nanostructures: NWs grown by SPCVD are single crystalline and dislocation free, which could offer excellent electronic and mechanical properties.
(iii) Tunable properties: Digital doping and/or composition control can be readily applied to SPCVD for electronic and optoelectronic property engineering.
(iv) Excellent versatility on material selection: It is possible to apply SPCVD strategy to the growth of NWs from a variety of functional materials on various substrates.
(v) Good scalability: Similar to ALD techniques, a parallel and uniform deposition on a stack of wafers in one growth chamber is possible.
SPCVD has been successfully applied to the growth of single-crystalline TiO2 1D nanostructures covering the entire inner surfaces of AAO nanochannels and dense Si NW arrays. The phase and morphology of TiO2 nanostructures can be well controlled by adjusting the deposition conditions. The resulted 3D NW architecture exhibited significantly enhanced PEC performance compared to straight NW arrays due to the largely improved surface area and excellent electronic transport property. Further in-depth and quantitative understanding of the nucleation and anisotropic crystal growth mechanisms of the SPCVD process would eventually realize a novel synthesis strategy to make 3D NW architectures from a variety of functional materials for the applications of electrochemical and photovoltaic electrodes, sensor elements, and catalysts.
ACKNOWLEDGMENTS
We thank C. Sun, M. Starr, Y. Hara, and M. Anderson for their contributions to the work reviewed in this paper. We also thank the support from National Science Foundation under Grant No. CMMI-0926245, 3M, and UW–Madison Graduate School.