Introduction
The abundance of coral reef benthic organisms can show a wide range of temporal patterns, including long-term trends of change and short-term (interannual or seasonal) fluctuations (Adjeroud et al., Reference Adjeroud, Augustin, Galzin and Salvat2002; Lamy et al., Reference Lamy, Galzin, Kulbicki, Lison de Loma and Claudet2016; Rovellini et al., Reference Rovellini, Dunn, Fulton, Webster, Smith, Jompa, Haris, Berman and Bell2019). Within the Indo-Pacific, the Coral Triangle is a hotspot of marine biodiversity (Roberts et al., Reference Roberts, Mittermeier and Schueler2002), and Indonesia has been found to be the centre of diversity of a number of marine taxa within the Coral Triangle (Hoeksema, Reference Hoeksema2007). However, many Indonesian reefs have suffered a loss of coral cover, due to local anthropogenic pressure (Edinger et al., Reference Edinger, Jompa, Limmon G, Widjatmoko and Risk1998) and increased water temperature (Heron et al., Reference Heron, Maynard, Van Hooidonk and Eakin2016). Coral bleaching events have been recorded after seawater warming in Indonesia since the early 1980s (Brown & Suharsono, Reference Brown and Suharsono1990; Hoeksema, Reference Hoeksema1991), and the loss of coral cover in the Indo-Pacific has been estimated at 1% per year between 1980–2003, and closer to 2% in the early 2000s (Bruno & Selig, Reference Bruno and Selig2007). Coral reefs throughout the Indo-Pacific are also projected to experience severe bleaching at increasing frequency in the future (Meissner et al., Reference Meissner, Lippmann and Sen Gupta2012; Hughes et al., Reference Hughes, Kerry, Álvarez-Noriega, Álvarez-Romero, Anderson, Baird, Babcock, Beger, Bellwood, Berkelmans, Bridge, Butler, Byrne, Cantin, Comeau, Connolly, Cumming, Dalton, Diaz-Pulido, Eakin, Figueira, Gilmour, Harrison, Heron, Hoey, Hobbs, Hoogenboom, Kennedy, Kuo, Lough, Lowe, Liu, McCulloch, Malcolm, McWilliam, Pandolfi, Pears, Pratchett, Schoepf, Simpson, Skirving, Sommer, Torda, Wachenfeld, Willis and Wilson2017).
After coral mortality and the early establishment of microbial films, macroalgae or filamentous turf algae are among the most efficient colonizers of the dead coral substrate (Hughes, Reference Hughes1994). Algal colonization of free substrate may be followed either by a long-term recovery of corals or by the establishment of an algal-dominated state (Mumby et al., Reference Mumby, Hastings and Edwards2007). For a permanent shift to an alternative stable state to occur, the establishment of feedback mechanisms that prevent the ecosystem from reverting to the original state are required (Scheffer et al., Reference Scheffer, Carpenter, Foley, Folke and Walker2001). Because transient changes in benthic dominance may be followed by permanent system state change if the perturbation that caused them persists, and if ecological feedbacks are established, identifying temporal changes in the abundance of benthic organisms is important.
Shifts from coral reefs towards algal dominance are the most commonly reported, but increased dominance of other benthic organisms, including corallimorpharians, soft corals and sponges, has also been documented from reefs around the world (Norström et al., Reference Norström, Nyström, Lokrantz and Folke2009). Coral reef sponges, in particular, are strong benthic competitors (reviewed in Wulff, Reference Wulff2006), and increased dominance of sponges on coral reefs has been documented for several Indo-Pacific reefs (Schils, Reference Schils2012; Knapp et al., Reference Knapp, Williams, Carballo, Cruz-Barraza, Gardner and Bell2013, Reference Knapp, Williams and Bell2016; Powell et al., Reference Powell, Smith, Hepburn, Jones, Berman, Jompa and Bell2014; Biggerstaff et al., Reference Biggerstaff, Jompa and Bell2017). In ecosystems that are subject to prolonged perturbation, some sponge species may become more abundant at the expense of corals and other reef benthic organisms (for example, some sponges on sedimented reefs, see Biggerstaff et al., Reference Biggerstaff, Jompa and Bell2017). Increased sponge abundance may be followed by a permanent shift towards sponge dominance if ecological feedbacks (like the pre-emption of available space for coral recovery) are established (Norström et al., Reference Norström, Nyström, Lokrantz and Folke2009).
While there is evidence of algae and other invertebrates becoming dominant on some coral reefs, the temporal dynamics of changes in benthic dominance are not always well described. In particular, little is known of how algae and sponges take advantage of free substrate becoming available on the reef after coral mortality. Most research on horizontal advancement of sponges into dead substrate overgrown by algae has been carried out on clionaid bioeroding sponges in the Caribbean (López-Victoria & Zea, Reference López-Victoria and Zea2005; López-Victoria et al., Reference López-Victoria, Zea and Weil2006), and on the Great Barrier Reef (Fang et al., Reference Fang, Mason, Schönberg, Hoegh-Guldberg and Dove2017). Studies considering direct competition between coral reef sponges and algae have also focused on bioeroding sponges (also mostly from the Caribbean), and have shown that macroalgae curtail sponge growth by rapidly occupying free space (González-Rivero et al., Reference González-Rivero, Yakob and Mumby2011, Reference González-Rivero, Ferrari, Schönberg and Mumby2012, Reference González-Rivero, Bozec, Chollett, Ferrari, Schönberg and Mumby2016). However, little information exists on how diverse sponge assemblages (which also include non-bioeroding sponges) and diverse algal groups benefit from bare substrate.
Some sponge taxa are also capable of settling and expanding over other benthic organisms, rather than only on bare substrate. Larval settlement of some Great Barrier Reef sponges is induced by crustose coralline algae (CCA) (Whalan et al., Reference Whalan, Webster and Negri2012), and some sponge taxa have been shown to form epibioses with turf algae (Ribeiro et al., Reference Ribeiro, Padua, Paiva, Custódio and Klautau2018). However, relationships between sponges and CCA or turf algae in the Coral Triangle have not been investigated.
The Wakatobi Marine National Park in South-east Sulawesi (Indonesia) is a biodiversity hotspot within the Coral Triangle (Clifton et al., Reference Clifton, Unsworth and Smith2010) where coral cover has declined over the last 15 years (Clifton & Unsworth, Reference Clifton, Unsworth, Clifton, Unsworth and Smith2010; Gouraguine et al., Reference Gouraguine, Moranta, Ruiz-Frau, Hinz, Reñones, Ferse, Jompa and Smith2019). While the reported decline in coral cover did not coincide with an increase in macroalgae (Marlow et al., Reference Marlow, Haris, Jompa, Werorilangi, Bates, Bennett and Bell2020), a shift towards a sponge-dominated state has been reported from one reef in the Wakatobi that is subjected to heavy sedimentation and local anthropogenic pressure (Powell et al., Reference Powell, Smith, Hepburn, Jones, Berman, Jompa and Bell2014; Biggerstaff et al., Reference Biggerstaff, Jompa and Bell2017).
In order to detect long-term changes in the coral reef benthic community composition of a coral reef in the Wakatobi, and to determine how different benthic organisms occupy free space that becomes available on the reef after coral mortality, we analysed percentage cover data from permanent reef quadrats between 2006 and 2017. The aims of this study were to: (1) investigate decadal changes in the abundance of sessile organisms on a reef wall; (2) investigate temporal changes in community structure of the benthos at this location; (3) quantify interannual variability in organism abundance; and (4) identify the effects of free space availability on the reef at one census point on the percentage cover of benthic organisms at the following census.
Materials and methods
Study location and data acquisition
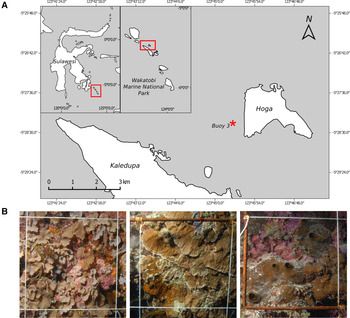
The study location was a vertical reef wall off Hoga Island (Wakatobi Marine National Park, South-east Sulawesi, Indonesia; Figure 1A), known locally as Buoy 3 (05°28.34′S 123°45.43′E). Here, three sites were established in 2005, ~100 m from each other. Due to the morphology of the reef, sites A and B were established on the vertical wall (90°), whereas site C was slightly inclined (~80°). At each site, five replicate 1-m2 permanent quadrats were haphazardly placed on the vertical wall, at a depth of 10–12 m and along a reef tract ~10 m in length. In the years 2006–2008, and 2014–2017, underwater photographs of the quadrats were taken by the same observer between June and July. Data from the 2009–2013 period could not be collected due to logistical reasons. Pictures of 25 cm × 25 cm sub-quadrats were taken to provide a higher resolution of the reef organisms (i.e. 16 images per 1 m2 quadrat).
Study location. (A) Map of Hoga Island, with insets showing the location of the Wakatobi National Marine Park and Sulawesi. The star indicates the location of Buoy 3. (B) examples of photoquadrats from the study location. The quadrats in the pictures are hanging on a vertical reef wall.

Benthic diversity in the Wakatobi is high, with 396 species of hermatypic corals (Pet-Soede & Erdmann, Reference Pet-Soede and Erdmann2003) and 90 gorgonian morphospecies (Rowley, Reference Rowley2018) recorded within the park, 141 sponge taxa reported from the reef considered in the present study (Rovellini et al., Reference Rovellini, Dunn, Fulton, Webster, Smith, Jompa, Haris, Berman and Bell2019) and many taxa of CCA, filamentous turfing algae, macroalgae and ascidians (Figure 1B). A total of eight benthic categories were used to describe the substrate in the photographs (Table 1). Benthic organisms were grouped into five taxonomic groups: hard corals, sponges, algae (including macroalgae and turf, with the former being rare in our quadrats), CCA, and other benthic invertebrates (which included octocorals, ascidians, bryozoans and hydrozoans, all of which were less common than hard corals, sponges or algae). Free space suitable for colonization (defined as bare rock or coral rubble not occupied by any visible organism) was also quantified from the photographs. Due to the vertical aspect of the reef wall and to the prevalence of encrusting coral growth forms at this location, coral rubble was not an abundant component of the sea floor. Abiotic substrate not suitable for growth (sand and silt) was also identified in the photoquadrats, mostly occurring over small ledges or inside crevices where soft sediments were retained despite the vertical aspect of the reef wall. The category ‘Undetermined’ was used to identify substrate that was visible in the photographs, but that was impossible to identify as any of the five live groups or two abiotic categories.
Groups of benthic organisms and abiotic substrata used in the percentage cover analysis

Percentage cover of the benthic categories was estimated with Coral Point Count with Excel extension (CPCe, Kohler & Gill, Reference Kohler and Gill2006). Because the photoquadrats were taken by a diver hovering in proximity of the reef wall, the distance of the camera from the substrate and the angle between the two varied slightly between years. For this reason, using the boundaries of the permanent quadrats as a reference to overlay the same set of points on photoquadrats from different years was not possible. We used 80 random points per image (corresponding to 1280 points m−2, equal to 1 point per 7.81 cm2 on average), with points being re-randomized for every image we scored. Trials were carried out to determine the minimum number of points per picture that were necessary to capture variations in percentage cover of the five live benthic groups and free space. Briefly, percentage covers of benthic organisms from three randomly chosen photoquadrats were quantified using an increasing number of points (20, 40, 60, 80, 100, 120). For each number of points, the same photoquadrat was scored eight times, with points being re-randomized each time. Calculating a coefficient of variation (SD/mean) from these eight iterations for each benthic category, it was determined that 80 points were needed to capture percentage cover variability in 25 cm × 25 cm photoquadrats (see Supplementary Figure S1 and text in the Supplementary Online Information for details on the selection of the number of points). Overall, the data set was composed of 134,400 points.
Decadal changes in benthic cover
Changes in percentage cover of the taxonomic groups (except the group ‘Undetermined’) between sites and over time were analysed with linear mixed-effects models with normally distributed errors and random intercepts (LMMs, R package nlme, Pinheiro et al., Reference Pinheiro, Bates, DebRoy and Sarkar2018). LMMs were chosen because they account for some properties of the data that would violate the assumption of more simple regression models, like repeated measurements and between-quadrat heteroscedasticity. Mixed models were built with number of years after the first census and site as fixed effects, and with quadrat as a random effect to account for quadrat-related variance. A continuous autocorrelation function was fitted to the LMMs to account for the temporal structure in the data, with correlation strength declining for years further apart. Candidate models with different combinations of fixed effects (year and site) were fitted with Maximum Likelihood, and the best model was chosen by backwards step-wise selection with Likelihood Ratio Tests (LRT). A constant variance-covariance structure with as many levels as the number of quadrats, and with each level allowing for quadrat-specific variance (see Pinheiro et al., Reference Pinheiro, Bates, DebRoy and Sarkar2018) was then fitted to the best model. The final model was re-fitted with Restricted Maximum Likelihood. For the fixed effects that were found significant, post hoc pairwise tests with Bonferroni correction were applied to identify between-site differences (R package emmeans, Lenth, Reference Lenth2019). Goodness of fit, normality and homoscedasticity of the errors were checked for all models by inspecting plots of the normalized residuals and the quantile-quantile plots (Supplementary Figure S2).
Previous studies that have modelled percentage cover of benthic organisms as outcome variables have relied on transformations such as the arcsine or the isometric log-ratio, to handle the compositional nature of cover data that violates the assumption of equal variance of model errors (see models in Cooper et al., Reference Cooper, Spencer and Bruno2015; Gross et al., Reference Gross, Edmunds and Holmes2015). However, some of these popular transformations of compositional data can cause difficulties in interpreting model results (Warton & Hui, Reference Warton and Hui2011). Because separate models were constructed for each benthic taxonomic group (except the group ‘Undetermined’), thus controlling for between-group heteroscedasticity, and because fitting a variance structure to the models accounted for quadrat-specific variance, the outcome variable was not transformed.
Spatial and temporal variation of community structure
The relative proportions of the three most common benthic competitors (hard corals, sponges and algae) were visualized with ternary plots (R package ggtern; Hamilton, 2017), which are useful to evaluate whether the system is in a state of coral, sponge or algal dominance. CCA are an abundant benthic organism at this reef, but ternary plots were used in this analysis to visualize the relative proportions of algae and sponges as organisms that have been shown to outcompete and replace corals on some degraded reefs (Hughes, Reference Hughes1994; Biggerstaff et al., Reference Biggerstaff, Jompa and Bell2017).
Changes in community structure across the three sites and over time were examined with constrained and unconstrained ordination methods (Anderson & Willis, Reference Anderson and Willis2003; R package vegan, Oksanen et al., Reference Oksanen, Blanchet, Friendly, Kindt, Legendre, McGlinn, Minchin, O'Hara, Simpson, Solymos, Stevens, Szoecs and Wagner2019). Community structure was visualized with non-metric Multidimensional Scaling (nMDS) in two dimensions (stress = 0.07), based on a Bray–Curtis similarity matrix. The amount of variation explained by time (year) and space (site) was then quantified with a permutational MANOVA (Anderson, Reference Anderson2001) with 9999 permutations. A Canonical Analysis of Principal Coordinates (CAP, Anderson & Willis, Reference Anderson and Willis2003) was then performed to visualize the contribution of the benthic groups to samples from different sites and different years.
Interannual changes in benthic cover
Interannual changes in percentage cover of live benthic taxonomic groups were expressed as the log-ratio φ = log(C1/C0), where C0 is percentage cover of group X in year y and C1 in year y + 1. Log-ratio was used to allow for interannual changes of the same magnitude but of opposite sign to be represented as a signed deviation from zero. Significant differences in average interannual variability between benthic groups were identified with a Kruskal–Wallis test, followed by post-hoc Dunn's tests with the Šidák correction for multiple comparisons to identify pairwise differences (R package dunn.test, Dinno, Reference Dinno2017). For this test, the absolute value of the log-ratio |φ| was used to express interannual variability in such a way that the larger the interannual change the larger |φ|, and the smaller the change, the closer |φ| is to zero. The non-parametric Kruskal–Wallis test was necessary due to the deviation from normality of |φ| for all benthic groups.
Lagged effects of free space on benthic cover
To investigate the effects of free colonizable space on the abundance of benthic organisms, the lagged effect of the cover of bare substrate available on the reef in year y on the cover of benthic taxonomic groups in year y + 1 was investigated with LMMs. Models were built with percentage cover of bare substrate at time y and site as fixed effects, and unique quadrat as a random effect. Model building, selection and validation were carried out as described above. In addition, because many benthic organisms have the potential to outcompete (or settle onto) filamentous turf algae and CCA, we re-ran these models three more times using as fixed effects site and: (1) the sum of bare substrate and turf algae cover; (2) the sum of bare substrate and CCA cover; and (3) the sum of bare substrate, turf and CCA cover. These alternative models have the purpose of allowing the investigation of lagged relationships (lag of 1 year) between substrate covered in generally weaker algal competitors and other benthic organisms. Exploring lags >1 year may identify longer-term succession dynamics in the benthic community. However, a 2-year lag almost halved our data points, as only three pairs of years were two years apart (2006–2008, 2014–2016 and 2015–2017). This sample would have been too small to allow for the interpretation of LMM results, and therefore we did not consider >1 year lags.
All statistical analyses were performed in R (version 3.5.3, R Core Team, 2019), and all plots were created with the R package ggplot2 (Wickham, Reference Wickham2016).
Results
Temporal changes in percentage cover
Percentage cover of benthic organisms at this reef was generally stable over the study period (Figure 2). Hard corals were the most abundant benthic organism on the Buoy 3 wall, with a mean (± SE) percentage cover of 42.7 ± 1.9%. The second most abundant benthic group on average was CCA (23.4 ± 1.0%), followed by sponges (9.2 ± 0.4%), algae (8.5 ± .0.4) and other invertebrates (8.3 ± 0.8%). There was on average 4.7 ± 0.3% of bare substrate open for settlement or growth of benthic organisms, and 3.2 ± 0.2 of sand and silt combined. Cover of undetermined organisms was <0.1% on average and this group was not considered for further analysis.
Mean percentage cover of benthic organisms at the Buoy 3 reef. Different columns (A, B, C) indicate the three sites. Vertical bars represent the standard error of the mean. Sites A and B are placed on a vertical wall, whereas Site C is a steep incline (~80° incline). Note the different scales for different benthic categories.

LMMs showed limited temporal variation in percentage cover of live benthic groups. Hard corals, sponges and algae showed no significant long-term cover changes, but all three varied between sites (Table 2). Overall, percentage cover of benthic organisms at site C (the slightly inclined site) were different from sites A and B (the vertical wall sites). Namely, at site C, coral cover was lower than at sites A and B (P = 0.005 and P < 0.001, respectively), whereas sponge cover was higher (P = 0.014 and P = 0.006, respectively). Algal cover was also higher at site C than at site B (P = 0.019). Coralline algae and other benthic invertebrates had site-dependent long-term dynamics. Coralline algae declined over time at site C (LMM-derived mean effect −0.8, 95% CI: −1.3, −0.3), whereas other organisms declined over time at site A, where soft corals had high abundance in one of the quadrats at the beginning of the study period (LMM-derived mean effect −0.6, 95% CI: −1.1, −0.1). Both CCA and other invertebrates showed no temporal trend at the other two sites. Overall, no group showed long-term variations that were consistent across space, showing that there is no evidence of overall change in dominance of benthic groups at this reef (Supplementary Figure S3).
Results of the linear mixed-effects models (LMMs) showing the effects of site and year on percentage cover of the benthic taxonomic groups

Coefficient estimates, their standard error (SE), model degrees of freedom (df), t-values, and P-values (P) are reported for each fixed effect (P values in bold are significant).
Community structure
Considering the three main benthic competitors hard corals, algae and sponges, site C was the only site where hard corals were not the dominant benthic competitor at all times, with sponges or algae being more abundant than scleractinian corals (Figure 3).
Ternary plots showing the relative proportions of the three main benthic competitors (hard corals, sponges and algae) at the three sites (A, B and C). The points indicate single photoquadrats. The closer the dot is to a corner of the ternary plot, the more dominant the group in that corner is.

Like the abundance of the individual benthic categories, community structure of the reef was characterized by spatial heterogeneity and temporal stability. nMDS showed similarity between the composition of quadrats from the same site and from sites A and B, highlighting the different composition of the benthos at site C (Figure 4A, see Supplementary Figure S4 for the assessment of nMDS quality). Samples from adjacent years, or even from the same year and different sites, did not show higher similarity than samples from years further apart. Permutational MANOVA results showed that site explained 58.9% of the variation in the community composition (Pseudo-F 2 = 72.12, P < 0.001), whereas year was not a significant predictor of community composition (Pseudo-F 6 = 1.429, P = 0.175, see CAP plot in Figure 4B).
Spatial and temporal variation of community structure. (A) Non-metric Multidimensional Scaling (nMDS) plot for the benthic community at the three sites in surveyed years between 2006 and 2017. The points correspond to the mean position of each site each year (i.e. each point represents the mean position of five photoquadrats). Symbols indicate the year, colours the site, and the dashed lines show the temporal trajectory of the community structure at each site. (B) Canonical Analysis of Principal Coordinates (CAP) plot. Years and sites represent the centroid for each set of samples. HC: hard corals; SP: sponges; AL: algae; CA: CCAs; OT: other invertebrate; FS: free space; AB: abiotic (sand and silt). Category ‘Undetermined’ not shown in CAP.

Interannual changes of benthic cover of taxonomic groups
Short-term temporal variability expressed as φ = log(C1/C0) was small for corals and CCA, and large for algae, sponges, and other invertebrates (Figure 5). Significant differences in |φ| were detected between live benthic groups at reef level (i.e. all sites pooled, χ2 = 124.95, df = 7, P < 0.001, Kruskal–Wallis test). Pairwise comparisons between groups showed that, at reef level, interannual changes in coral cover were similar in magnitude to changes in CCA (P = 0.075), but were smaller than all other groups (algae, sponges, other invertebrates, all P < 0.001). Short-term temporal variability of sponge cover was comparable to that of algae (P = 0.991) and of other benthic invertebrates (P = 0.806).
Box-plots showing the interannual variability of percentage cover of the benthic taxonomic groups, expressed as log(φ) = log(C1/C0), where C1 is the cover of group X at time y + 1 and C0 is the cover of group X in year y. Dashed horizontal line represents log(C1/C0) = 0, that is C1/C0 = 1, equal to no change between consecutive years. A large spread from the zero-line denotes high interannual variability for a group.

Lagged effects of free space on benthic cover
A positive lagged relationship was found between bare substrate and algal cover, uniformly across sites (mean effect 0.2, 95% CI: 0–0.4, P = 0.018). When turf algae cover was added to bare substrate, a positive lagged relationship between these groups combined and CCA cover was detected (mean effect 0.6, 95% CI: 0.4–0.8, P < 0.001). A positive lagged relationship with sponge cover was also found at site A (mean effect 0.5, 95% CI: 0.2–0.8, P < 0.001), but not at the other two sites. Similarly, when CCA cover was added to free space, a positive lagged relationship between this combined set and sponge cover was detected, but again only at site A (mean effect 0.4, 95% CI: 0.3–0.6, P < 0.001). Finally, when both turf algae and CCA were added to free space, there was once again a positive lagged relationship between the combined set and sponge cover at site A (mean effect 0.4, 95% CI: 0.3–0.4, P < 0.001), but not at the other two sites.
Discussion
This study aimed to measure decadal and interannual variability in the percentage cover of benthic organisms on an Indonesian coral reef, and to investigate the effects of colonizable substrate available on the reef on benthic cover of organisms the following year. Percentage cover of all benthic organisms showed no long-term change. Similarly, community structure did not change over time, although differences in community structure between site C and the other two sites were detected. Sponges and turf algae showed larger interannual changes than hard corals and CCA. A positive lagged relationship between bare substrate and turf algae was detected. Furthermore, when percentage cover of turf algae and/or CCA were added to bare substrate and considered as colonizable substrate, a positive lagged relationship between colonizable substrate and sponge cover was detected, but only at one of the sites. These results show that: coral cover has not changed at this Indonesian reef wall between the beginning and the end of the study period (2006–2017 decade); turf algae and sponges have the potential to fluctuate rapidly; only turf algae had an apparent direct benefit from free space becoming available on this reef.
Long-term stability of benthic cover
This coral-dominated Indonesian reef showed limited temporal variation between 2006 and 2017. Mean hard coral cover at reef level (42.7 ± 1.9%) was comparable with values reported by previous studies from the Wakatobi at a similar depth on the slope of non-degraded reefs (e.g. Bell & Smith, Reference Bell and Smith2004; Powell et al., Reference Powell, Smith, Hepburn, Jones, Berman, Jompa and Bell2014; Marlow et al., Reference Marlow, Schönberg, Davy, Haris, Jompa and Bell2018a). Earlier studies from other Wakatobi reefs have reported a decline in coral cover between the early 2000s and 2012 (Powell et al., Reference Powell, Smith, Hepburn, Jones, Berman, Jompa and Bell2014; Gouraguine et al., Reference Gouraguine, Moranta, Ruiz-Frau, Hinz, Reñones, Ferse, Jompa and Smith2019), similar to other Indo-Pacific reefs (Bruno & Selig, Reference Bruno and Selig2007). Conversely, no overall decline of coral cover was observed at Buoy 3 over the study period. These results are consistent with earlier findings of McMellor & Smith (Reference McMellor, Smith, Clifton, Unsworth and Smith2010), who reported that no decline in coral cover occurred at the reef wall off Hoga Island between 2002 and 2007, whereas corals had uniformly declined across other reefs in the Park with variable local environmental conditions (see also Marlow et al., Reference Marlow, Haris, Jompa, Werorilangi, Bates, Bennett and Bell2020). The stability of hard corals at this reef may be due to local characteristics of the coral assemblage and of the reef aspect. Hard corals in the Wakatobi are subjected to increased seawater temperature linked to bleaching events (Wilson et al., Reference Wilson, Ardiwijaya and Prasetia2012), increased sedimentation associated with decreased growth rates (Crabbe & Smith, Reference Crabbe and Smith2005) and destructive fishing methods (Clifton et al., 2010). However, corals at Buoy 3 are predominantly encrusting, probably because the vertical aspect of the reef causes its reduced exposure to sunlight, promoting flattened and encrusting coral growth forms (Dinesen, Reference Dinesen1983). Encrusting corals were the least affected coral growth form by past bleaching events that occurred in the region (Wilson et al., Reference Wilson, Ardiwijaya and Prasetia2012). Furthermore, the accumulation of sediments on the reef wall at Buoy 3 is also lower than at nearby degraded reefs (Bell & Smith, Reference Bell and Smith2004; Marlow et al., Reference Marlow, Smith, Werorilang and Bell2018b), due to its vertical aspect.
Sponges were never the dominant benthic organism at Buoy 3, but they were on average the third most abundant benthic organism, after hard corals and CCA. While high sponge density has been reported for this location (Rovellini et al., Reference Rovellini, Dunn, Fulton, Webster, Smith, Jompa, Haris, Berman and Bell2019), few studies have measured percentage cover of sponges from Indonesian coral reefs. Sponge cover across the Wakatobi is variable (mean across 10 Wakatobi reefs 6.98% ± 0.64%, Marlow et al., Reference Marlow, Haris, Jompa, Werorilangi, Bates, Bennett and Bell2020), and previous studies from locations near Buoy 3 on Hoga Island at similar depth (10 m) reported sponge cover to be between 10% (Bell et al., Reference Bell, Jompa, Haris, Werorilangi, Shaffer and Mortimer2018) and 29% (Bell & Smith, Reference Bell and Smith2004). Sponge cover at Buoy 3 did not show an overall increase over time like it has at the degraded reefs in this region (Biggerstaff et al., Reference Biggerstaff, Jompa and Bell2017). Consistent with this result, sponge density at this location, although highly dynamic, has also not changed significantly between 2005 and 2017 (Rovellini et al., Reference Rovellini, Dunn, Fulton, Webster, Smith, Jompa, Haris, Berman and Bell2019). An increase in the percentage cover of the phototrophic sponge Lamellodysidea herbacea was reported between the early 2000s and 2015 for a highly sedimented reef in the area (Bell & Smith, Reference Bell and Smith2004; Powell et al., Reference Powell, Smith, Hepburn, Jones, Berman, Jompa and Bell2014; Biggerstaff et al., Reference Biggerstaff, Jompa and Bell2017), but this sponge was not a dominant taxon in the sponge assemblage at Buoy 3 (Rovellini et al., Reference Rovellini, Dunn, Fulton, Webster, Smith, Jompa, Haris, Berman and Bell2019).
Fleshy macroalgae were virtually absent from this reef, with the mean cover for this group never exceeding 0.1%, and all algae (except CCA) were filamentous turf. Species composition and richness of macroalgal assemblages on Indonesian coral reefs are influenced by a number of environmental parameters, including shelf depth, sand vs coral cover, turbidity, seawater temperature and chlorophyll-a concentration (Draisma et al., Reference Draisma, Prud'homme van Reine, Herandarudewi and Hoeksema2018). However, in the Coral Triangle macroalgae are often found in limited abundance on reef crests and slopes (e.g. Sawall et al., Reference Sawall, Jompa, Litaay, Maddusila and Richter2013; Plass-Johnson et al., Reference Plass-Johnson, Heiden, Abu, Lukman and Teichberg2016), and their abundance has declined steadily across the Wakatobi between 2002 and 2014 (Marlow et al., Reference Marlow, Haris, Jompa, Werorilangi, Bates, Bennett and Bell2020).
Spatial and temporal variation in community structure
Temporal stability of the community structure was consistent with the long-term stability of percentage cover of taxonomic categories. The observed lack of long-term temporal changes in the composition of the benthos may be due to stable environmental conditions over the study period. For example, sea surface temperature and temperature anomalies in the Wakatobi had no detectable effect on sponge abundance and interannual growth, possibly due to the stability of temperature at this location (Rovellini et al., Reference Rovellini, Dunn, Fulton, Webster, Smith, Jompa, Haris, Berman and Bell2019). However, site C generally had lower coral cover than sites A and B, and also had a different community structure. This difference is likely due to the slight inclination (~80°) of the reef wall at site C, as opposed to the vertical surface of sites A and B. Different inclination may result in different exposure to light and sedimentation, factors that can have an important impact on other benthic organisms (e.g. Cheshire & Wilkinson, Reference Cheshire and Wilkinson1991; Carballo, Reference Carballo2006). Furthermore, hard coral settlement and survival has been found to be higher on vertical than on horizontal surfaces (Rogers et al., Reference Rogers, Fitz HC, Gilnack, Beets and Hardin1984). Therefore, the vertical aspect of this reef likely supported a stable coral assemblage over time, leaving limited scope for other benthic organisms to increase in abundance.
Although percentage cover of the benthic organisms and benthic community structure did not change significantly between the beginning and the end of the study period, changes may have occurred over the five-year gap (2009–2013) between the first and second sampling periods. In 2010, abnormally high sea surface temperature caused coral bleaching at a number of reefs in the Wakatobi (Wilson et al., Reference Wilson, Ardiwijaya and Prasetia2012). However, Wilson et al. (Reference Wilson, Ardiwijaya and Prasetia2012) reported limited bleaching in 2010 from the Buoy 3 reef wall at 10 m depth, and the bleached colonies on the reef crest (3 m) had almost completely recovered by 2011. More recent warming events in the Wakatobi caused bleaching and partial host mortality in the Symbiodinium-associated bioeroding sponge Cliona aff. viridis, but the bleaching was followed by rapid recovery and had no significant effect on sponge density in subsequent surveys (Marlow et al., Reference Marlow, Davy, Shaffer, Haris and Bell2018c). Therefore, it is likely that any changes that occurred to benthic cover and community structure at the study location between the two sampling periods were followed by recovery to an extent that made them undetectable in the present analysis.
Interannual changes in benthic cover
Interannual changes in percentage cover varied among the benthic taxonomic categories, with little interannual variation of hard corals and CCA, and larger variability for sponges, turf algae and other benthic invertebrates. Coral reef monitoring in the Spermonde Archipelago (South-west Sulawesi) over a 3-year period showed limited interannual changes in benthic cover of hard corals, sponges, other benthic invertebrates and macroalgae, but some degree of temporal variability in cover of CCA and turf algae (Teichberg et al., Reference Teichberg, Wild, Bednarz, Kegler, Lukman, Gärdes, Heiden, Weiand, Abu, Nasir, Miñarro, Ferse, Reuter and Plass-Johnson2018). Low interannual variability of Indo-Pacific coral assemblages has also been reported from New Caledonia (Adjeroud et al., Reference Adjeroud, Poisson, Peignon, Penin and Kayal2019; but see Adjeroud et al., Reference Adjeroud, Augustin, Galzin and Salvat2002 for evidence of pronounced interannual variability in coral cover in response to natural disturbance in French Polynesia).
There is evidence of short-term temporal variability of sponge abundance and cover from reefs within the Wakatobi. Biggerstaff et al. (Reference Biggerstaff, Jompa and Bell2017) reported a doubling in area covered by L. herbacea at a degraded Wakatobi reef over a period of 18 months. Moreover, while changes in sponge abundance expressed as number of sponge patches may not always correspond to changes in sponge percentage cover (Bell et al., Reference Bell, Biggerstaff, Bates, Bennett, Marlow, McGrath and Shaffer2017), mean sponge abundance at the Buoy 3 reef has showed large interannual variability, changing by as much as 40% between 2014 and 2015 (Rovellini et al., Reference Rovellini, Dunn, Fulton, Webster, Smith, Jompa, Haris, Berman and Bell2019). This highlights that sponges at this location are highly dynamic on short time scales, while showing overall decadal stability.
Effect of free space on benthic cover
Occasional mortality of coral colonies, sponge patches, or other benthic organisms was apparent from our photoquadrats, although the causes of such mortality were not assessed. When bare substrate becomes available on coral reefs, it is rapidly covered by a film of bacteria or opportunistic microalgae (e.g. Crisp & Ryland, Reference Crisp and Ryland1960), which is then colonized by other benthic organisms (reviewed in Qian et al., Reference Qian, Lau, Dahms, Dobretsov and Harder2007). Turf algae colonize bare rock after massive coral mortality events (reviewed in O'Brien & Scheibling, Reference O'Brien and Scheibling2018). Experiments on the early succession of benthic colonizers on recruitment tiles in the Indo-Pacific showed that filamentous turf algae are present on immersed surfaces as soon as two weeks after deployment in Hawaii (Bailey-Brock, Reference Bailey-Brock1987), and that turf algae occupy up to 50% of free space four months after deployment in the Spermonde Archipelago (Plass-Johnson et al., Reference Plass-Johnson, Heiden, Abu, Lukman and Teichberg2016). A settlement study from Caribbean reefs showed that, while CCA and turf algae are the first group to colonize clean artificial substrate, encrusting invertebrates (mostly sponges) overgrow thin algal crusts and small recruits of other organisms, covering over 20% of the substrate one year after deployment (Arnold & Steneck, Reference Arnold and Steneck2011). However, in the present study only turf algae showed a positive relationship between bare substrate and percentage cover at the following census (one year later). This suggests that opportunistic algae promptly occupied the bare substrate that had become available on the reef, and that no other benthic organism had a direct and immediate benefit from the opening of free space. No lagged relationship was found between colonizable substrate and coral cover. This result was expected, given that encrusting corals, dominant at this reef, generally grow slower than branching growth forms, and that the lag used in this analysis was one year.
Many benthic organisms can expand their margins or settle onto substrates other than barren rock. For example, corals can settle on CCA (e.g. Heyward & Negri, Reference Heyward and Negri1999; Negri et al., Reference Negri, Webster, Hill and Heyward2001), and filamentous turf algae have no significant effects on the settlement success of coral recruits (O'Brien & Scheibling, Reference O'Brien and Scheibling2018). However, ecological interactions between sponges and these algal groups are poorly understood. It has been shown that the larval settlement of the two Great Barrier Reef sponges Coscinoderma matthewsi and Rhopaloeides odorabile is induced by CCA (Whalan et al., Reference Whalan, Webster and Negri2012), but it is unclear whether all sponges can settle on CCA, and how competitive interactions between sponges and CCA are resolved. Similarly, turf algae have been considered part of bare substrate in a study on bioeroding sponges in the Wakatobi, because these sponges advance into calcareous substrate overgrown by turf (Marlow et al., Reference Marlow, Smith, Werorilang and Bell2018b).
Our results showed mixed support for benthic invertebrates colonizing algal substrates. Sponges had a positive lagged relationship with the combination of bare rock and algal substrates (turf, CCA and the two combined), but this effect was detected only at Site A. Sponges at this reef are mostly small encrusting species, and some dominant taxa include small calcareous sponges such as Pericharax sp. and Sycon sp. (Rovellini et al., Reference Rovellini, Dunn, Fulton, Webster, Smith, Jompa, Haris, Berman and Bell2019). Calcareous sponges have been found to form associations with many benthic organisms (Ribeiro et al., Reference Ribeiro, Padua, Paiva, Custódio and Klautau2018), and some sponge taxa formed close associations with turf algae at this reef (Supplementary Figure S5). The positive lagged relationship between bare rock combined with algal groups cover and sponge cover at site A suggests that some sponge taxa at this reef might recruit to areas of the reef that are already fouled by algae. However, because this relationship was not consistent across sites, further research is needed to elucidate relationships between early-settled filamentous algae and other benthic organisms at this reef.
CCA have been shown to be fast colonizers of bare substrate (e.g. Arnold & Steneck, Reference Arnold and Steneck2011; Boschetti, Reference Boschetti2016). Conversely, in the present study bare substrate alone had no effect on CCA cover at the following census, and CCA had a positive lagged relationship with bare space and turf algae combined, uniformly across all sites. This suggests that CCA at this reef are not limited by bare substrate and can overgrow patches of algal turf.
In summary, the lack of delayed correlation between bare substrate and percentage cover of benthic invertebrates at this reef suggests that either: (1) benthic invertebrates at this reef are not limited by bare substrate on the reef; or (2) they indirectly benefit from the opening of free space not by promptly colonizing it but by overgrowing the filamentous algae that occupy it first. In this second case, turfing algae colonize the empty space first, being the dominant group after one year, and other groups (for example, sponges) overgrow them or form associations with them on longer time scales. Due to the limited size of our dataset, it was not possible to explore higher-order lag relationships (i.e. >1 year) between colonizable substrate and benthic organisms.
Implications for Indonesian reef dynamics
There was no evidence that a change in benthic cover and community structure has occurred over the last 13 years on this Indonesian reef. This is in contrast with other studies from reefs in the Wakatobi, which have shown a decline in coral cover (Gouraguine et al., Reference Gouraguine, Moranta, Ruiz-Frau, Hinz, Reñones, Ferse, Jompa and Smith2019), or a relative increase in sponge dominance at some locations (Biggerstaff et al., Reference Biggerstaff, Jompa and Bell2017). However, when comparing temporal dynamics and community structure of the benthos at the Buoy 3 reef with other Indonesian reefs in the Wakatobi, it is important to consider the vertical aspect of the reef at Buoy 3, the dominance of encrusting coral morphologies, and the sampling depth (~10 m). The negative effects on hard coral cover of stressors such as thermal anomalies (Wilson et al., Reference Wilson, Ardiwijaya and Prasetia2012), land-based input of silt and pollutants causing reduced water quality (Crabbe & Smith, Reference Crabbe and Smith2005; Polónia et al., Reference Polónia, Cleary, de Voogd, Renema, Hoeksema, Martins and Gomes2015; Plass-Johnson et al., Reference Plass-Johnson, Heiden, Abu, Lukman and Teichberg2016) and destructive fishing methods (Nurdin & Grydehøj, Reference Nurdin and Grydehøj2014) have been observed on other reefs in the Coral Triangle. The extreme rarity of macroalgae from this reef should also be considered in the context of the depth and position of the Buoy 3 reef. While macroalgae on Indo-Pacific reefs are not as abundant as they are in the Caribbean (Bruno et al., Reference Bruno, Sweatman, Precht, Selig and Schutte2009), they can be more abundant than hard corals on shallow reefs with low water quality (Teichberg et al., Reference Teichberg, Wild, Bednarz, Kegler, Lukman, Gärdes, Heiden, Weiand, Abu, Nasir, Miñarro, Ferse, Reuter and Plass-Johnson2018), or where high cover of dead corals provides a substrate for macroalgae to grow (Draisma et al., Reference Draisma, Prud'homme van Reine, Herandarudewi and Hoeksema2018). For these reasons, it is likely that local-scale conditions favoured the decadal stability of the benthic community reported in the present study.
The results of this study indicate that, when benthic organisms die and bare substrate becomes available on the reef, sponges and other invertebrates may not immediately benefit from it. Instead, filamentous turfing algae rapidly occupy bare substrate, and CCA and sponges may benefit from turf cover by overgrowing it. Although the reef wall at this location has not experienced the same decline in coral cover and habitat degradation of neighbouring sites, increasing threats of local anthropogenic pressure and global environmental change may result in increased coral mortality in the future. If this happens, further research is needed to understand how other organisms overgrow turf algae that had occupied bare substrate after coral mortality. The lack of long-term increase in algal cover indicates that, while turfing algae are the first colonizer of free substrate, they are outcompeted or overgrown by other benthic organisms at subsequent successional stages, or they form associations with them.
Supplementary material
The supplementary material for this article can be found at https://doi.org/10.1017/S0025315421000291.
Acknowledgements
Operation Wallacea, in particular Pippa Mansell and Rowan Watt-Pringle, facilitated the fieldwork in Indonesia. Research permits were awarded to Joseph Marlow and Charlotte Mortimer (VUW). This work was supported by a long-term collaboration (and multiple research permits) between Hasanuddin University and Victoria University of Wellington.
Financial support
AR, JJB and MRD were supported by a Royal Society of New Zealand Marsden Fund. Fieldwork was also funded by VUW and the PADI Foundation.