


1 Introduction
Since their discovery, detonation phenomena have attracted a great deal of attention regarding safety hazards and propulsion applications. Detonation is a self-sustaining supersonic premixed combustion wave, which consists of a leading shock wave coupled with a reaction zone.
Many advantages could be achieved from its use in a combustor. Indeed, according to the Fickett–Jacob cycle, higher total temperature and pressure than in conventional engines can be reached, resulting in a higher thermal efficiency and increased thrust. Moreover, the use of smaller compressors renders the engine more compact. These advantages have motivated many studies all over the world (Kailasanath Reference Kailasanath2000; Roy et al. Reference Roy, Frolov, Borisov and Netzer2004; Wolanski Reference Wolanski2013). As the full-scale propulsion system is limited in space, using fuel as a liquid is very attractive because of its high energy density content (see Li et al. (Reference Li, Fan, Chen, Wang and Yan2011) and Lu et al. (Reference Lu, Fan, Wang, Zhang and Chi2017) on liquid fuel based pulsed detonation engines and Kindracki (Reference Kindracki2015) and Frolov et al. (Reference Frolov, Aksenov, Ivanov and Shamshin2017) for rotating detonation engines). For instance, Kindracki (Reference Kindracki2015) designed the geometry of a rotating detonation chamber that uses liquid kerosene and gaseous air and investigated the initiation and propagation of rotating detonation. No stable rotating detonation could be obtained at room temperature. Stable operation was then obtained with lean and rich mixtures, with a small addition of gaseous hydrogen (below the lean limit) and 20 % liquid isopropyl nitrate. A velocity deficit of 20 %–25 % as compared to the Chapman–Jouguet (CJ) velocity was furthermore observed. Moreover, the instability of the detonation wave with liquid fuel may affect the performance and reliability of the detonation engine and therefore must be controlled.
On the other hand, severe damage to people and goods may occur if the detonation happens unintentionally, such as in coalmines or nuclear power plants. Therefore, knowledge of initiation and mitigation of detonations are essential for safety applications. One of the potential solutions to mitigate damage is the use of water sprays (Thomas Reference Thomas2000). Boeck et al. (Reference Boeck, Kink, Oezdin, Hasslberger and Sattelmayer2015) showed that water droplets whose Sauter mean diameter (SMD) is  $13~\unicode[STIX]{x03BC}\text{m}$ delays the deflagration-to-detonation transition for atmospheric stoichiometric hydrogen air mixture and that the detonation propagation speed decreases by 3 % as compared to the CJ speed. Another experimental study by Niedzeilska et al. (Reference Niedzeilska, Kapusta, Savard and Teodorczyk2017) indicated the possibility of water spray with an SMD of
 $500~\unicode[STIX]{x03BC}\text{m}$ for detonation quenching.
Therefore, knowledge of detonation in a liquid heterogeneous mixture is of primary importance (Murrary & Thibault Reference Murrary and Thibault2009; Higgins Reference Higgins2012) not only for the development of the detonation combustor using liquid fuel but also for the mitigation of detonation by water spray. Much fundamental research (Ragland, Dabora & Nicholls Reference Ragland, Dabora and Nicholls1968; Dabora, Ragland & Nicholls Reference Dabora, Ragland and Nicholls1969; Thomas, Edwards & Edwards Reference Thomas, Edwards and Edwards1990; Ju & Law Reference Ju and Law2002; Chang & Kailasanath Reference Chang and Kailasanath2003; Lu & Law Reference Lu and Law2004; Papalexandris Reference Papalexandris2004, Reference Papalexandris2005; Kailasanath Reference Kailasanath2006; Smirnov et al. Reference Smirnov, Nikitin, Khadem and Alyari-Shourekhdeli2007; Fedorov & Kratova Reference Fedorov and Kratova2015a,Reference Fedorov and Kratovab; Benmahammed et al. Reference Benmahammed, Veyssiere, Khasainov and Mar2016; Jarsalé, Virot & Chinnayya Reference Jarsalé, Virot and Chinnayya2016; Liu, Liu & Li Reference Liu, Liu and Li2016) has been conducted to obtain some physical insight into these combined phenomena. Their aim is to clarify their characteristics such as lower propagation velocity compared with the CJ velocity, modification of the cellular structures, and delayed (or enhanced) deflagration-to-detonation transitions. In addition, these aforementioned characteristics are known to be affected by the droplet diameter, liquid volume fraction, polydisperse droplet diameter distribution and mixture reactivity. Nevertheless, the detailed propagation mechanism and the structure of gaseous detonation in heterogeneous mixtures remain partially understood as compared to homogeneous gaseous detonation.
One of the studies to clarify the structure for gaseous detonation with water droplets (WD) in term of the hydrodynamic thickness has been conducted by Jarsalé et al. (Reference Jarsalé, Virot and Chinnayya2016). They performed an experiment to generate new data on gaseous detonation propagating through a  $\text{C}_{2}\text{H}_{4}$-air mixture laden with WD. The cell size was drastically altered and the velocity decreased compared with the dry CJ velocity. Also, they measured the hydrodynamic thickness by the analysis of the post-shock pressure fluctuations and revealed that the ratio of hydrodynamic thickness over the cell size remains quite constant regardless of the presence of WD. However, they were not able to get access to the behaviour of WD such as, for instance, their motion and the location of evaporation. Therefore, both numerical and experimental approaches are required to understand the structure of detonation in heterogeneous mixtures and the interplay between phases. Watanabe et al. (Reference Watanabe, Matsuo, Matsuoka, Kawasaki and Kasahara2019) performed two-dimensional (2-D) numerical simulations based on previous experiments by Jarsalé et al. (Reference Jarsalé, Virot and Chinnayya2016) and analysed the structure of two-phase detonation via Favre-averaged one-dimensional profiles. Favre averaging of gaseous detonations has been previously performed to gain more insight into the chaotic and turbulent cellular gaseous detonations (Lee & Radulescu Reference Lee and Radulescu2005; Radulescu et al. Reference Radulescu, Sharpe, Law and Lee2007; Maxwell et al. Reference Maxwell, Bhattacharjee, Lau-Chapdelaine, Falle, Sharpe and Radulescu2017), when losses are present (Sow, Chinnayya & Hadjadj Reference Sow, Chinnayya and Hadjadj2014, Reference Sow, Chinnayya and Hadjadj2015, Reference Sow, Chinnayya and Hadjadj2019; Reynaud, Virot & Chinnayya Reference Reynaud, Virot and Chinnayya2017) and with spatially inhomogeneous initial conditions (Mi et al. Reference Mi, Higgins, Ng, Kiyanda and Nikiforakis2017a; Mi, Timofeev & Higgins Reference Mi, Timofeev and Higgins2017b). Watanabe et al. (Reference Watanabe, Matsuo, Matsuoka, Kawasaki and Kasahara2019) confirmed stable propagation of gaseous detonation in fresh gas mixture with WD with a small velocity decrease (maximum 3.2 %) as compared to the dry CJ speed and also the change of the cellular structure by addition of WD in the leaner mixture case, as in the experiments. The structure of detonation can be seen to be significantly modified by WD evaporation. This endothermic process is coupled with the detonation wave and the levels of velocity, vorticity and temperature fluctuations downstream of the mean leading shock are lowered. Additionally, they reported that the hydrodynamic thickness decreased with WD when the sound speed for a two-phase mixture, of which one of the assumptions is velocity equilibrium, is used. Nevertheless, the computational domain was quite short from the interaction with water droplet domain (i.e. 100 mm). Moreover, their Favre-average analysis was based only on one last instantaneous flow field of the gaseous phase and they did not obtain the dispersed phase counterpart. In addition, they did not take into account droplet break-up. Indeed, the impingement of high amplitude shock waves on the liquid dispersed phase will shatter the droplets. The exchange surface will be increased and will enhance the energy transfer between phases.
Steady laminar detonation is composed of a shock wave, followed by an induction zone where a pool of intermediate species proliferate before the exothermic reactions proceed to raise the temperature. However, detonations are intrinsically unstable and are prone to develop multidimensional cellular structures, of which regularity depends on the reactivity of the mixture. These instabilities delay the mean sonic line, propagating at the same speed as the shock, and which isolate the detonation front from the rear. Thus, four characteristic lengths of detonation can be defined at least (Lee Reference Lee2008): induction and reaction lengths, the cell size and the hydrodynamic thickness, which is the distance from the mean shock to the mean sonic plane.
After the passage of the shock that is driven by the gas phase in the dilute regime, the mixture is out of equilibrium. At least, three relaxation zones (in contrast to two with solid particles) can be identified to recover this equilibrium: droplet equilibration to the saturation temperature, velocity and temperature equilibration (Guha Reference Guha1992a,Reference Guhab). As the shock is of high amplitude in detonation conditions, break-up is likely to occur, which will enhance the relaxation processes and its characteristic time has to be taken into account (Saurel & Lemetayer Reference Saurel and Lemetayer2001; Kolev Reference Kolev2007). Secondary atomization is a very active field of research (Guildenbecher, Lopez-Rivera & Sojka Reference Guildenbecher, Lopez-Rivera and Sojka2009). More recently, Theofanous (Reference Theofanous2011) has discussed the different physical mechanisms that could explain the loss of the integrity of the droplet. The present study is also motivated by Jarsalé’s experiments (Jarsalé Reference Jarsalé2017), driven by the ratio of the induction length to the secondary break-up length of the spray of droplets.
Therefore, this study aims to understand to what extent the four detonation characteristic lengths and the four droplet characteristic times can be intertwined, and how these processes interact with each other. To that end, a weakly unstable gaseous mixture with an initial regular cellular structure is chosen, for which the third dimension should not bring any quantitative difference on the mean quantities (Taileb et al. Reference Taileb, Reynaud, Chinnayya, Virot and Bauer2018). The mixture is  $2\text{H}_{2}+\text{O}_{2}+2\text{N}_{2}$ at the initial low pressure of 10 kPa and at an initial temperature of 300 K. The mass loading of the water droplets is 0.07, with a uniform diameter of
 $15.9~\unicode[STIX]{x03BC}\text{m}$. This initial distribution is expected to evolve as the droplet undergoes continuous acceleration as well as transverse shock wave impingement during its course within the cell. In addition, the different flow and break-up regimes that the droplet undergoes from the shock to the mean sonic plane can also be inferred from the computations.
In order to capture the motion and behaviour of WD, an Eulerian–Lagrangian method is desirable to model the two-phase mixture. In addition, the evaporation of WD generates additional water vapour in the gaseous phase and the reactivity of the mixture may thus be affected. Therefore, in this study, two-dimensional numerical simulations based on an Eulerian–Lagrangian method that takes droplet break-up into account and reactive Navier–Stokes equations, with source terms accounting for the detailed chemistry and the interactions with the liquid phase, are performed to clarify quantitatively the influence of the dilute water spray on the characteristics of the gaseous detonation. A detailed discussion is carried out to analyse the detonation structure and the interactions between gas phase and water spray via statistical Favre-averaged one-dimensional profiles for both gaseous phase and dispersed phase from the simulation results. The recycling block method (Sow et al. Reference Sow, Chinnayya and Hadjadj2019) is used to enable a longer length of the detonation propagation.
The plan of this paper is organized as follows. Section 2 describes the mathematical modelling and numerical method for gaseous detonation with dilute water spray. Then, the problem statement is presented in § 3. Section 4 presents the results obtained in the simulation and discusses the mean structure of gaseous detonation with dilute WD. The different flow regimes of the droplet will be highlighted. A master equation will be derived that helps to classify the relative importance of the different interphase exchanges to the thermicity. The effect of the evaporated water on the reactivity of the mixture will also be evaluated. Finally, the main conclusions are drawn in § 5.
2 Mathematical modelling and numerical method
2.1 Governing equations
The detonation propagation in a water spray is related to a two-phase flow of gas and liquid droplets. The Eulerian–Lagrangian method is used to model the gaseous detonation laden with dilute water spray. The gaseous phase is assumed to be a viscous, reactive, compressible and ideal gas. Nine chemical species are considered, namely  $\text{H}_{2}$,
 $\text{O}_{2}$, H, O, OH,
 $\text{H}_{2}\text{O}$,
 $\text{HO}_{2}$,
 $\text{H}_{2}\text{O}_{2}$ and
 $\text{N}_{2}$. The governing equations combined with gas porosity are the 2-D reactive compressible Navier–Stokes equations with source terms accounting for the chemical reactions and the interactions with the droplets. The equation of state for an ideal gas is used to close the system;
 $$\begin{eqnarray}\displaystyle & \displaystyle \frac{\unicode[STIX]{x2202}}{\unicode[STIX]{x2202}t}(\unicode[STIX]{x1D6FC}_{g}\unicode[STIX]{x1D70C}_{g})+\unicode[STIX]{x1D735}\boldsymbol{\cdot }(\unicode[STIX]{x1D6FC}_{g}\unicode[STIX]{x1D70C}_{g}\boldsymbol{u}_{g})=\frac{1}{V_{cell}}\mathop{\sum }_{i=i_{1}}^{i_{2}}n_{i}\dot{m_{i}}, & \displaystyle\end{eqnarray}$$
 $$\begin{eqnarray}\displaystyle & \displaystyle \frac{\unicode[STIX]{x2202}}{\unicode[STIX]{x2202}t}(\unicode[STIX]{x1D6FC}_{g}\unicode[STIX]{x1D70C}_{g}\boldsymbol{u}_{g})+\unicode[STIX]{x1D735}\boldsymbol{\cdot }(\unicode[STIX]{x1D6FC}_{g}\unicode[STIX]{x1D70C}_{g}\boldsymbol{u}_{g}\boldsymbol{u}_{g})-\unicode[STIX]{x1D735}\boldsymbol{\cdot }(\unicode[STIX]{x1D6FC}_{g}\unicode[STIX]{x1D70F}_{g})+\unicode[STIX]{x1D6FC}_{g}\unicode[STIX]{x1D735}p_{g}=\frac{1}{V_{cell}}\mathop{\sum }_{i=i_{1}}^{i_{2}}n_{i}~[\dot{m_{i}}\boldsymbol{u}_{i}-\boldsymbol{f}_{drag,i}],\qquad & \displaystyle\end{eqnarray}$$
 $$\begin{eqnarray}\displaystyle & & \displaystyle \frac{\unicode[STIX]{x2202}}{\unicode[STIX]{x2202}t}(\unicode[STIX]{x1D6FC}_{g}e_{g})+\unicode[STIX]{x1D735}\boldsymbol{\cdot }[\unicode[STIX]{x1D6FC}_{g}(e_{g}+p_{g})\boldsymbol{u}_{g}]-\unicode[STIX]{x1D735}\boldsymbol{\cdot }(\unicode[STIX]{x1D6FC}_{g}\unicode[STIX]{x1D70F}_{g}\boldsymbol{u}_{g})-\unicode[STIX]{x1D735}\boldsymbol{\cdot }(\unicode[STIX]{x1D6FC}_{g}q_{g})+p_{g}\frac{\unicode[STIX]{x2202}\unicode[STIX]{x1D6FC}_{g}}{\unicode[STIX]{x2202}t}\nonumber\\ \displaystyle & & \displaystyle \quad =\frac{1}{V_{cell}}\mathop{\sum }_{i=i_{1}}^{i_{2}}n_{i}\left[\frac{1}{2}\dot{m_{i}}\boldsymbol{u}_{i}\boldsymbol{\cdot }\boldsymbol{u}_{i}-\boldsymbol{f}_{drag,i}\boldsymbol{\cdot }\boldsymbol{u}_{i}-(q_{conv,i}+q_{evap,i})\right],\end{eqnarray}$$
 $$\begin{eqnarray}\displaystyle & \displaystyle \frac{\unicode[STIX]{x2202}}{\unicode[STIX]{x2202}t}(\unicode[STIX]{x1D6FC}_{g}\unicode[STIX]{x1D70C}_{g}Y_{g,k})+\unicode[STIX]{x1D735}\boldsymbol{\cdot }[\unicode[STIX]{x1D6FC}_{g}\unicode[STIX]{x1D70C}_{g}Y_{g,k}\boldsymbol{u}_{g}]-\unicode[STIX]{x1D735}\boldsymbol{\cdot }(\unicode[STIX]{x1D6FC}_{g}\boldsymbol{j}_{g,k})=\unicode[STIX]{x1D6FC}_{g}\dot{\unicode[STIX]{x1D714}}_{g,k}+\frac{1}{V_{cell}}\mathop{\sum }_{i=i_{1}}^{i_{2}}n_{i}{\dot{m}}_{i,k}, & \displaystyle\end{eqnarray}$$
 $$\begin{eqnarray}\displaystyle & \displaystyle p_{g}=\unicode[STIX]{x1D70C}_{g}R_{g}T_{g}. & \displaystyle\end{eqnarray}$$
Here,  $\unicode[STIX]{x1D6FC}_{g}$,
 $\unicode[STIX]{x1D70C}_{g}$,
 $\boldsymbol{u}_{g}$,
 $p_{g}$,
 $T_{g}$,
 $e_{g}$,
 $Y_{g,k}$ and
 $R_{g}=R_{u}(\sum _{k=1}^{N_{s}}Y_{g,k}/W_{g})$ represent porosity, gas density, velocity vector, pressure, temperature, total energy, mass fraction of species
 $k$ and gas constant, respectively. Here,
 $N_{s}$ is the total number of chemical species and
 $\unicode[STIX]{x1D70F}_{g}$,
 $q_{g}$,
 $\boldsymbol{j}_{g,k}$ and
 $\dot{\unicode[STIX]{x1D714}}_{g,k}$ denote the shear stress, heat flux, diffusion flux, and reaction rate, respectively. Also,
 $V_{cell}$,
 $n_{i}$,
 $\boldsymbol{f}_{drag,i}$,
 $q_{conv,i}$,
 $q_{evap,i}$ and
 $\dot{m_{i}}$ are cell volume, number density, drag force, heat flux by convection, heat flux by evaporation, and mass flux by evaporation, respectively for each droplet
 $i\in (i_{1},i_{2})$ belonging to the cell volume.
The hydrogen–oxygen combustion mechanism used is the detailed model proposed by Hong, Davidson & Hanson (Reference Hong, Davidson and Hanson2011), which considers nine species and 20 elementary reactions. The detailed chemical mechanism is given in appendix A. The thermochemical species properties are calculated using the Janaf thermochemical polynomials (McBride, Gordon & Reno Reference McBride, Gordon and Reno1993). As for the transport properties of viscosity and thermal conductivity, apart from  $\text{HO}_{2}$, a method proposed by Gordon, McBride & Zeleznik (Reference Gordon, McBride and Zeleznik1984) is used to estimate the gas viscosity and thermal conductivity. The reason why the transport coefficients of viscosity and thermal conductivity are evaluated using different methods is that the coefficient data for
 $\text{HO}_{2}$ are not available from the Gordon et al. method. From a preliminary study, the Gordon et al. method can be shown to be accurate as compared to the experimental data for viscosity and thermal conductivity. As for the
 $\text{HO}_{2}$ chemical species, the viscosity and thermal conductivity are calculated from the Chapman–Enskog method (Chapman & Cowling Reference Chapman and Cowling1991) and the Eucken method (Poling, Prausnitz & O’Connel Reference Poling, Prausnitz and O’Connel2001), respectively. The Wilke method (Wilke Reference Wilke1950) and the Wassiljewa method (Wassiljewa Reference Wassiljewa1904) are used to estimate the multi-component gas viscosity and thermal conductivity based on the pure species values. The binary diffusion coefficients are evaluated using the Chapman–Enskog method (Chapman & Cowling Reference Chapman and Cowling1991).
Particle tracking is employed to model the droplet motion. The governing equations for droplets are Newton’s equation of motion, the energy conservation equation, the mass conservation equation and the number density conservation equation:
 $$\begin{eqnarray}\displaystyle & \displaystyle m_{i}\frac{\text{d}\boldsymbol{u}_{i}}{\text{d}t}=\boldsymbol{f}_{drag,i}+\boldsymbol{f}_{pres,i}, & \displaystyle\end{eqnarray}$$
 $$\begin{eqnarray}\displaystyle & \displaystyle m_{i}c_{i}\frac{\text{d}T_{i}}{\text{d}t}=q_{conv,i}+q_{evap,i}, & \displaystyle\end{eqnarray}$$
 $$\begin{eqnarray}\displaystyle & \displaystyle \frac{\text{d}m_{i}}{\text{d}t}=\dot{m_{i}}, & \displaystyle\end{eqnarray}$$
 $$\begin{eqnarray}\displaystyle & \displaystyle \frac{\text{d}n_{i}}{\text{d}t}=\dot{n_{i}}. & \displaystyle\end{eqnarray}$$
Here,  $m_{i}$,
 $c_{i}$ and
 $\boldsymbol{f}_{pres,i}$ are the WD mass, WD specific heat, and the force due to the pressure gradient, respectively. The drag force
 $\boldsymbol{f}_{drag,i}$ is estimated using a model proposed by Ling et al. (Reference Ling, Wagner, Beresh, Kearney and Balachandar2012). As the Biot number in this study is much less than unity, the intraparticle temperature gradient can be neglected. Additionally, the particle-specific heat is assumed to be constant. Droplet evaporation is estimated by the model proposed by Abramzon & Sirignano (Reference Abramzon and Sirignano1989). The convective heat flux is calculated using the Ranz–Marshall equation (Ranz & Marshall Reference Ranz and Marshall1952). The droplet break-up occurs under the assumption that the droplet diameter decreases linearly during the break-up process (Chauvin et al. Reference Chauvin, Daniel, Chinnayya, Massoni and Jourdan2016). It is a phenomenological model based on the critical Weber number (
 $We_{c}$) and the non-dimensional total break-up time which are modelled by Brodkey (Reference Brodkey1967) and Pilch & Erdman (Reference Pilch and Erdman1987), respectively. Even if the hydrodynamic model of Chauvin et al. (Reference Chauvin, Daniel, Chinnayya, Massoni and Jourdan2016) differs from the present one, the numerical results can be shown to agree very well with each other. Comparison with the experimental data of Chauvin et al. (Reference Chauvin, Jourdan, Daniel, Houas and Tosello2011) on shock interaction with a cloud of water droplets can be found in appendix B.
In most cases, the cellular structures can be retrieved with the use of the reactive Euler equations with a proper chemical mechanism. However, when the fuel comes to methane and propane-like based fuels, of which cellular structure can be classified as very highly irregular (Libouton, Jacques & van Tiggelen Reference Libouton, Jacques and van Tiggelen1981), we cannot exclude turbulent burning of the unburnt pockets torn off by triple point collision (Radulescu Reference Radulescu2018). Nevertheless, in our case of very weakly unstable detonation, the reactive Euler equations would be sufficient to retrieve the proper cellular structure. However, as the initial pressure is very low (10 kPa) and there are few cells in the width of the channel (of which conditions have been chosen for resolution issues), we cannot exclude a priori the influence of the growth of the boundary layer on the detonation velocity. Computations in the next sections have shown a posteriori that this is not the case (see § 4.3) and that the detonation deficit comes from the presence of the water droplets. In addition, the additional water vapour from the evaporation of water droplets will mix with the gas phase, and the diffusion effect needs to be taken into account to estimate its influence on the reactivity of the gaseous mixture.
The mean structure of three-dimensional gaseous detonations has been addressed only recently (Taileb et al. Reference Taileb, Reynaud, Chinnayya, Virot and Bauer2018) and is still in its infancy, also due to its computational cost. However, 2-D simulations have been shown to bring about the main qualitative features of gaseous detonations. This has driven the choice of a weakly unstable mixture, for which the third dimension will not bring quantitative modifications on the gas mean quantities. The only modification will be at the intersection of lines of triple points, which will influence very locally the droplet motion. However, this will not influence the mean quantities. Once again, different conclusions would have to be drawn for mildly or very unstable cases.
2.2 Numerical solvers
A classical time-splitting method is employed to couple the hydrodynamics with the detailed chemistry and the interphase exchanges. The spatial derivatives of the left-hand side of (2.1)–(2.4) are discretized by fifth-order advection upstream splitting methods using pressure-based weight functions (known as AUSMPW+) improved by Kim, Kim & Rho (Reference Kim, Kim and Rho2001) based on a modified weighted essentially non-oscillatory scheme (known as MWENO-Z) (Hu, Wang & Chen Reference Hu, Wang and Chen2016) and the diffusive terms by a second-order central differential scheme. The time integration method for the convective and diffusion terms is the third-order total variation diminishing Runge–Kutta method (Gottlieb, Shu & Tadmor Reference Gottlieb, Shu and Tadmor2001), and the multi-time-scale method (Gou et al. Reference Gou, Sun, Chen and Ju2010) is used for efficient time integration of the chemical source term.
The first-order symplectic Euler method (Cromer Reference Cromer1981; Tuley et al. Reference Tuley, Danby, Shrimpton and Palmer2010) is used for the integration of (2.6) for droplets. For the time integration of (2.7)–(2.9), the Euler explicit method is used.
The porosity is then calculated using the ratio of the total volume of droplets which locate inside the computational cell to the computational cell volume. For the summation of the total volume of droplets inside the computational cell, the particle centroid method is utilized (van der Hoef et al. Reference van der Hoef, van Sint Annaland, Deen and Kuipers2008; Sun & Xiao Reference Sun and Xiao2015).
The gas phase quantities around the droplet to calculate the interphase exchanges are estimated by interpolating the surrounding three nearby Eulerian cell values by the barycentric interpolation, as in Shimura & Matsuo (Reference Shimura and Matsuo2018).
The simulations used approximately  $3\,500\,000$ cells, along with nine chemical species and
 $5\,000\,000$ Lagrangian parcels of particles with a typical cost of approximately
 $10\,000$ central processing unit (known as CPU) scalar hours. The wall is an adiabatic no-slip wall, and a transmissive boundary is applied to the left-hand side of the computational domain. The half-reaction length (h.r.l.) in the present reaction model is
 $1696~\unicode[STIX]{x03BC}\text{m}$. The minimum grid width is
 $50~\unicode[STIX]{x03BC}\text{m}$ and the resolution is then approximately 34 points per h.r.l. The Courant–Friedrichs–Lewy number is fixed at 0.1 and the typical time step size is around
 $10^{-9}~\text{s}$.
3 Problem statement
The physical configuration associated with the numerical simulations is depicted in figure 1. The premixed gas is chosen to be a stoichiometric  $\text{H}_{2}{-}\text{O}_{2}$ mixture diluted with 40 %
 $\text{N}_{2}$ at an initial pressure of 10 kPa and ambient temperature. Indeed, the post-shock non-dimensional activation energy (
 $E_{a}/RT_{VN}$) for the premixed mixture in the present reaction model is 5.5. The premixed gas can then be classified as a weakly unstable mixture according to the stability analysis (Lee & Stewart Reference Lee and Stewart1990; Austin Reference Austin2003).
Computational initial conditions of two-phase detonation with dilute water spray.

The width of the channel is 39 mm, which corresponds approximately to one cell and a half. Initially, the detonation is fully developed in the initial section of the computational domain, and then propagates towards the WD section. The WD whose initial diameter and temperature are  $15.9~\unicode[STIX]{x03BC}\text{m}$ and 300 K, respectively, are uniformly distributed in the fresh gas. The apparent density of liquid is
 $5.5~\text{g}~\text{m}^{-3}$, of which mass loading is 7.45 %.
The Reynolds average values are computed as follows:
 $$\begin{eqnarray}\displaystyle \overline{G}=\frac{1}{H}\int _{0}^{H}\left\{\lim _{T\rightarrow \infty }\left(\frac{1}{T}\int _{0}^{T}G(x-x_{s}(y,t),y,t)\,\text{d}t\right)\right\}\text{d}y. & & \displaystyle\end{eqnarray}$$
In (3.1),  $H$ is the height of the channel,
 $x_{s}(y,t)$ is the instantaneous position of the shock front, which is not straight due to cellular instabilities, and
 $T$ is the period of sampling. Then from the Reynolds averages, the Favre quantities can be obtained from the conservative variables
 $\tilde{\boldsymbol{\cdot }}=\overline{(\unicode[STIX]{x1D6FC}\unicode[STIX]{x1D70C})_{k}\boldsymbol{\cdot }}/\overline{(\unicode[STIX]{x1D6FC}\unicode[STIX]{x1D70C})_{k}}$,
 $k=g\text{ or }l$. This limit has been shown to exist since Radulescu et al. (Reference Radulescu, Sharpe, Law and Lee2007) and more recent aforementioned references, and also that this mean steady state can be obtained for the subsonic reaction zone, which stands between the mean leading shock and sonic line. As they travel at the same velocities, the distance between them is the hydrodynamic thickness. However, this limit cannot describe the unsteady rarefaction waves, Taylor–Zel’dovich waves, which takes place beyond.
From the comparison of the simulation results using the coarse grid in appendix C, the average quantities are converged with the present grid resolution. Moreover, Reynaud et al. (Reference Reynaud, Virot and Chinnayya2017) have also shown that such resolution is sufficient to recover the gaseous averaged quantities. Therefore, conclusions on the mean structure are not called into question by the present numerical resolution.
The disturbances downstream of the last characteristic line do not influence the detonation front nor the propagation and the mean structure of gaseous detonation. Thus, the simulation is performed with a small computational domain which encompasses the mean leading shock and the mean sonic line. The computational domain is updated every time when the gaseous detonation approaches the right boundary, i.e. a new region is appended to the right of the computational domain and another is discarded on the opposite side. As a result of this procedure, the total number of droplets varies during the simulation by the recycling block method. Namely, the droplets are discarded once they leave the computational domain and new droplets are added in front of the detonation wave. The recycling bock method (Mi et al. Reference Mi, Higgins, Ng, Kiyanda and Nikiforakis2017a,Reference Mi, Timofeev and Higginsb; Reynaud et al. Reference Reynaud, Virot and Chinnayya2017; Sow et al. Reference Sow, Chinnayya and Hadjadj2019) is used to reduce the computational cost with a relatively small computational domain and allows the detonation to run a long distance, enough to compute mean and statistical values. Details can be found in Sow et al. (Reference Sow, Chinnayya and Hadjadj2019).
The length of the computational domain with minimum grid size is set to 120 mm in the present study. The length of the front detonation propagation, in the computations which are shown in this study, is 900 mm. Then in order to get the averaged values, the instantaneous 2-D flow fields are saved each time the detonation front has propagated 1 mm, from 300 mm to 900 mm after the first contact with WD section. Afterwards, the 600 one-dimensional profiles can be obtained, from which we finally get the Favre mean one-dimensional profiles.
For the simulation of gaseous detonation, a finer mesh is desirable to capture the flow field details. However, the mesh size should be larger than the droplet size in the present numerical method. Therefore, there is a trade-off between mesh resolution for gaseous detonation and droplets. The low pressure of the initial mixture enables us to have a large half-reaction length and a mesh resolution of  $50~\unicode[STIX]{x03BC}\text{m}$, which is larger than the size,
 $15.9~\unicode[STIX]{x03BC}\text{m}$, of the droplets. This mesh resolution corresponds to approximately 34 points per half-reaction length, which is enough to capture the detonation structures of this weakly unstable mixture.
4 Results and discussion
4.1 Propagation velocity
Normalized propagation velocity on the bottom wall.

Probability density function of detonation propagation velocity.

Two-dimensional flow fields for gas phase without water droplets. (a) Pressure, (b) gas density, (c) gas temperature, (d) gas  $x$-velocity in mean shock frame, (e) Mach number in mean shock frame, (f) gas
 $y$-velocity, (g) mass fraction of
 $\text{H}_{2}\text{O}$, (h) Q criterion, (i) maximum pressure.

Two-dimensional flow fields for gas phase with water droplets. (a) Pressure, (b) gas density, (c) gas temperature, (d) gas  $x$-velocity in mean shock frame, (e) Mach number in mean shock frame, (f) gas
 $y$-velocity, (g) mass fraction of
 $\text{H}_{2}\text{O}$, (h) Q criterion, (i) maximum pressure.

Two-dimensional flow fields for interphase exchange by water droplets. (a) Evaporation rate, (b) momentum transfer rate in the  $x$-direction, (c) momentum transfer rate in the
 $y$-direction, (d) energy transfer rate.

Two-dimensional flow fields for water droplets. (a) Droplet volume fraction, (b) number density, (c) droplet mass ratio, (d) droplet diameter, (e) droplet  $x$-velocity, (f) droplet
 $y$-velocity, (g) droplet temperature, (h) particle Mach number, (i) Weber number, (j) total break-up time.

To capture the propagation behaviour and front structure globally, the propagation velocity is presented in this subsection. The propagation velocity on the bottom wall is shown in figure 2. The propagation velocity with WD starts to change from the profile without WD after the first contact with WD. Both peak and minimum velocities become lower due to the interaction with WD. To analyse the propagation velocity, the probability density function (p.d.f.) for the detonation velocity is shown in figure 3. Without WD, the mean detonation velocity ( $D_{CJ,w/o\,droplet}=2\,111~\text{m}~\text{s}^{-1}$) agrees well with the theoretical dry case (chemical equilibrium with application (known as CEA) calculation McBride & Gordon (Reference McBride and Gordon1996)). With WD, the mean detonation velocity shows a decrease of 3.8 % as compared to the previous dry case. The instantaneous propagation velocity ranges from 0.8 to 1.6 CJ velocity and the p.d.f. distribution is skewed toward the sub-CJ velocity. The peak value of the distribution is 0.9 in the present study. The overall shape of the p.d.f. in figure 3 is similar between both cases and the same power-law dependence is observed (Radulescu et al. Reference Radulescu, Sharpe, Law and Lee2007). However, the percentage below dry CJ speed increases from around 50 % (without WD) to 60 % by the addition of WD.
4.2 Global features
This subsection is devoted to the study of the instantaneous features of the flow fields in order to address the differences, which come from the presence of the liquid dispersed phase. Figure 4 depicts the gas phase instantaneous 2-D flow fields without WD. The different quantities are (a) pressure, (b) gas density, (c) gas temperature, (d) gas velocity in the  $x$-direction in the mean shock frame, (e) Mach number in the mean shock frame, (f) gas velocity in the
 $y$-direction, (g) mass fraction of
 $\text{H}_{2}\text{O}$, (h) Q criterion, (i) maximum pressure, respectively. The maximum pressure history in figure 4(i) corresponds to soot foils in experiments. The number of cells inside the channel is 1.5. The cellular structure is regular, with a characteristic sawtooth shape of the interface between the inert and burned gases and no large fresh pockets of gas downstream can be seen (figures 4c and 4g). The boundary layer growth can also be observed near the wall behind the shock wave (figures 4d, 4e and 4h). But it is too thin to affect the propagation velocity as the ideal theoretical detonation velocity is retrieved. The vapour water is in a thermochemical equilibrium state far from the leading shock waves in the absence of WD (figure 4g).
Figure 5 depicts the gas phase instantaneous 2-D flow fields for gaseous detonation with WD. The instantaneous 2-D flow fields for interphase exchange by WD are shown in figure 6. Furthermore, figure 7 shows the droplet instantaneous 2-D flow fields. The figures 6(a–d) and 7(a) correspond to Eulerian fields whereas figure 7(b–j) represents Lagrangian data and the white colour in figure 7(b–j) mean that there is no droplet.
The overall cellular detonation structure looks similar to what would be the detonation without WD, still constituted of incident shocks, Mach stems and transverse waves. Indeed, the cellular structure with WD does not change drastically even if the propagation velocity decreases by 3.8 % compared with the dry CJ velocity (see figures 4i and 5i). However, closer inspection reveals differences. This lower propagation velocity will induce a lower post-shock gas pressure. The pressure in the wet case in figure 5(a) will then overtake that of the dry case in figure 4(a) as the two-phase interactions take place. The same behaviour in figures 4(b) and 5(b) can be seen as for the density, as water vapour from the liquid phase evaporation is released in the gas phase from evaporation (figure 6a). Moreover, from temperature and water vapour flow fields comparison (see figures 4c,g and 5c,g), the lower detonation velocity can be seen to induce a greater induction length, behind the incident shocks. However, on the contrary of what would be expected, the flow fields of the gas velocity components and its gradient in figures 4(d–f,h) and 5(d–f,h) exhibit less complicated structures and vortexes are even suppressed by the of WD (figures 4h and 5h).
The flow field for droplet volume fraction which is uniformly distributed initially shows preferential concentration (figure 7a), the reason for which is not completely known yet, and jets from triple point collision and shear layers should probably play a central role. Then further from the leading shock, the liquid volume fraction decreases due to the evaporation process. Its rate is highest in the higher liquid concentration zones. The water vapour content is then increased, compared to the dry case (figures 4g and 5g).
In the first 15–20 mm behind the leading shock, the droplet velocity remains relatively low (figures 7e and 7f), inducing the highest momentum transfer rates (figures 6b and 6c). The droplet motion seems mainly driven by the high speed forward and backward jets generated by triple point and transverse wave collisions. Moreover, the droplet trajectory depends on its inertia and therefore on its diameter, which decreases due to two processes: break-up and evaporation. The former takes place within a narrower zone in the first 10 mm (figures 7j and 7b), the latter then taking over (figure 7c). The particle Mach number (figure 7h) and the Weber number (figure 7i) decrease accordingly due to the decrease of both diameter and relative velocity. The WD are then more likely to follow the gas. Nevertheless, they seem more likely to lie near the shear layers, which are torn off by the triple point collision and convected downstream.
The WD accelerate after the shock wave passage due to pressure and drag forces and approach velocity equilibrium with gas in the horizontal direction (figure 7e). However, the WD velocity in the  $y$-direction fluctuates due to the transverse waves, and velocity equilibrium in the
 $y$-direction is not achieved (figure 7f). Indeed, the transverse waves which pertain long downstream of the shock lead to rapid and sudden changes of
 $y$-gas-velocity (figures 5f and 7f), inducing
 $y$-momentum transfer (figure 6c).
As for temperatures, the droplet temperature reaches very rapidly the saturation temperature (figure 7g), being the fastest relaxation process (Guha Reference Guha1992a,Reference Guhab), before the beginning of evaporation (figure 6a). A temperature disequilibrium between the gas and liquid phases remains during all the detonation process.
After the shock passage, the flow becomes subsonic, and then as the gas velocity is accelerated by burned gas expansion in both cases in figures 4(e) and 5(e), the flow becomes gradually supersonic. However, some supersonic pockets appear due to the definition of the Mach number, which is based on the mean detonation velocity, whereas a more proper definition should rely on limiting characteristic surfaces (see Kasimov & Stewart Reference Kasimov and Stewart2004; Stewart & Kasimov Reference Stewart and Kasimov2005). In addition, the gas total energy decreases constantly along with the interaction with WD behind the shock wave (figure 6d). As the result of momentum and energy transfer, the gas  $x$-velocity in the shock fixed frame is lower (figure 5d). The high relative velocity in
 $x$-direction immediately downstream of the leading shock implies the particle Mach number being over one and the flow around the WD being supersonic. Then as velocity equilibrium in the
 $x$-direction is approached, the particle Mach number becomes subsonic again (figure 7h).
Even if velocity equilibrium is achieved only in one direction, the Weber number is greater than the critical Weber number only in the vicinity of the leading shock (figure 7i). As can also be seen in figure 7(j), the order of magnitude of the total break-up time is around  $5~\unicode[STIX]{x03BC}\text{s}$. Break-up generated a great deal of smaller daughter droplets. This process occurs mainly at the vicinity of triple point and transverse wave collisions (figure 7b). The evaporation of WD is enhanced by the smaller droplet diameter and the mass of the droplet decreases as time passes (figure 7c).
4.3 Mean structure for gaseous phase
Favre-averaged profiles for gas phase. (a) Pressure, (b) gas density, (c) gas temperature, (d) Mach number in mean shock frame, (e) gas  $x$-velocity in mean shock frame, (f) sound speed, (g) mass fraction of
 $\text{H}_{2}$, (h) mass fraction of
 $\text{H}_{2}\text{O}$, (i) mass fraction of OH, (j) thermicity.

In order to analyse quantitatively the differences between the dry and wet cases, the Favre average (Favre Reference Favre1965) in time and space in the frame of the instantaneous detonation motion is obtained from the simulations, following previous studies (Lee & Radulescu Reference Lee and Radulescu2005; Radulescu et al. Reference Radulescu, Sharpe, Law and Lee2007; Sow et al. Reference Sow, Chinnayya and Hadjadj2014, Reference Sow, Chinnayya and Hadjadj2015, Reference Sow, Chinnayya and Hadjadj2019; Maxwell et al. Reference Maxwell, Bhattacharjee, Lau-Chapdelaine, Falle, Sharpe and Radulescu2017; Reynaud et al. Reference Reynaud, Virot and Chinnayya2017; Mi et al. Reference Mi, Higgins, Ng, Kiyanda and Nikiforakis2017a,Reference Mi, Timofeev and Higginsb) and (3.1). In order to deal with multiphase features, gas phase quantities are weighted by the gas apparent density  $(\unicode[STIX]{x1D6FC}\unicode[STIX]{x1D70C})_{g}$ and the liquid quantities by
 $(1-\unicode[STIX]{x1D6FC}_{g})\unicode[STIX]{x1D70C}_{l}$. The one-dimensional Favre-averaged profiles for gas phase are shown in figure 8, which shows (a) pressure, (b) gas density, (c) gas temperature, (d) estimation of Mach number in the mean shock frame, (e) gas
 $x$-velocity in the mean shock frame, (f) sound speed, (g)
 $\text{H}_{2}$, (h)
 $\text{H}_{2}\text{O}$ (i) OH mass fraction, (j) thermicity, respectively. The horizontal axis in figure 8 is normalized by the h.r.l.
The behaviour of the mean pressure and gas density and their differences (figure 8a,b) can be clearly visualized. The lower detonation velocity of the wet case induces a lower post-shock pressure. The density at the von Neumann (vN) state in figure 8(b) is approximately the same. However, further from the shock, the decrease of the pressure is tempered and the gas density is also increased, due to the different relaxation processes (Rudinger Reference Rudinger1964; Guha Reference Guha1992a,Reference Guhab). In addition, the gaseous velocity decreased as would be expected from the presence of the liquid dilute phase (figure 8e). The sound speed in two-phase mixture  $c_{two}$ can be evaluated by following formula (Brennen Reference Brennen2005) under the assumption that the velocities of both phases are in equilibrium:
 $$\begin{eqnarray}\displaystyle c_{two}=\left(\frac{\unicode[STIX]{x1D6FE}_{g}p_{g}}{\unicode[STIX]{x1D6FC}_{g}((1-\unicode[STIX]{x1D6FC}_{g})\unicode[STIX]{x1D70C}_{l}+\unicode[STIX]{x1D6FC}_{g}\unicode[STIX]{x1D70C}_{g})}\right)^{1/2}. & & \displaystyle\end{eqnarray}$$
Here  $\unicode[STIX]{x1D6FE}_{g}$ and
 $\unicode[STIX]{x1D70C}_{l}$ are the specific heat ratio of gas and liquid density, respectively. The estimation of the sound speed for the two-phase mixture defined by (4.1) is valid under thermal disequilibrium and is lower than the sound speed in the gas phase all the more so as the gas volume fraction
 $\unicode[STIX]{x1D6FC}_{g}$ decreases. That explains why the Mach number based on (4.1) is greater than the gaseous Mach number in figure 8(d). However, the sound speed in (4.1) holds for two-phase mixtures in velocity equilibrium, which does not stand in our case. Thus, it is expected that the group velocity of the pressure waves should be between those two. We have seen in the previous sub-section, 4.2, that the level of fluctuations is lowered with the WD presence. However, the hydrodynamic thickness is further delayed. The hydrodynamic thickness (subscript HT) without WD and with WD based on sound speed for gas
 $x_{HT,gas}$ are 33.0 and 47.2 h.r.l., respectively. This could be due to the gaseous phase being continuously cooled by the liquid phase, due to evaporation.
In the case with WD, evaporation produces water vapour so that the amount of  $\text{H}_{2}\text{O}$ is higher than that by the only combustion of hydrogen–oxygen mixture as shown in figure 8(h). This figure also shows that evaporation mainly takes place further downstream from the shock. Moreover, the amount of
 $\text{H}_{2}$ is the same (figure 8g) and the profiles of mass fraction of OH is similar between both cases (figure 8i), even if there is release of water vapour within the flow, indicating a strong interaction with the chemical mechanism.
The profile of the thermicity in figure 8(j), which is computed from the mean values obtained by the averaging process, becomes thicker. However, the peak which is little lower remains approximately at the same position. In the present study, the induction length is estimated from the distance from the shock to the position of the peak thermicity maximum. The estimation of the induction length  $x_{ind,thermicity}$ is 0.4 h.r.l. in the dry case and 0.7 h.r.l. in the wet case, respectively. Another method recommended by Austin & Shepherd (Reference Austin and Shepherd2003) to estimate the induction length
 $x_{ind,OH}$ is from the position of the peak of OH. In that case, the estimation of
 $x_{ind,OH}$ is 2.6 and 3.4 h.r.l. for the dry and wet case, respectively. After close inspection, two nearby peaks can be inferred from the thermicity profiles. The increase in the induction length by the first peak is in line with the 3.8 % decrease in the detonation velocity. However, the cell size, which is roughly proportional to the induction length, does not change much. In conclusion, the estimation of the induction length in this study will be considered to be
 $0.4\sim 3.4~\text{h.r.l.}$ Moreover, the reaction length was at first estimated as the distance from the shock to the position where the thermicity is 1 % of the maximum thermicity
 $x_{reac,1\,\%}$ and then from the ratio of the peak thermicity maximum to the velocity at the CJ state
 $x_{reac,max}$ as suggested by Radulescu (Reference Radulescu2003) and Ng et al. (Reference Ng, Radulescu, Higgins, Nikiforakis and Lee2005),
 $$\begin{eqnarray}\displaystyle x_{reac,max}=u_{CJ}/\dot{\unicode[STIX]{x1D70E}}_{max}. & & \displaystyle\end{eqnarray}$$
Here,  $u_{CJ}$ is the gas velocity at the CJ plane and
 $\dot{\unicode[STIX]{x1D70E}}_{max}$ is the maximum value of thermicity. For the dry case, both estimates give similar results, 13.3 and 15.7 h.r.l., whereas for the wet case they give 13.6 and 15.9 h.r.l., respectively. When the two-phase sound speed is used, the same value of 13.0 h.r.l. is obtained. As a result, the characteristic induction length
 $x_{ind}$ increases with WD presence, whereas the reaction length
 $x_{reac}$ remains almost the same.
In order to quantify the growth of the boundary layer, the displacement thickness and momentum thickness are depicted in figure 9 based on the Favre-averaged 2-D flow fields. The boundary layer develops downstream of the leading front. There are some oscillations which remain in the profiles due to continuous impingement of transverse waves. The boundary layer in the case without WD seems thicker than that with WD, the reason for which is beyond the scope of the present study even if particularly relevant for practical applications. In both cases, the boundary layer thickness remains small compared to the channel width so that the propagation velocity is not affected by the boundary layer growth (see § 4.1).
Boundary layer growth.

Characteristic lengths for gaseous detonation (normalized by h.r.l.).

The different characteristic lengths for gaseous detonation in the present study are summarized in table 1.
4.4 Droplet behaviour
In this section, the behaviour of WD is quantitatively analysed through the Favre-averaging process. The WD Lagrangian data are at first projected on the Eulerian grid and then the same averaging process as in the previous section is applied. Figure 10 shows the Favre-averaged one-dimensional profiles for water droplets, (a) droplet volume fraction, (b) droplet diameter, (c) Weber number, (d) particle Reynolds number and particle Mach number, (e) force acting on WD, (f) the characteristic time for evaporation and break-up, (g) square of droplet diameter, (h) number density, (i) droplet mass ratio, respectively. The characteristic time for break-up is taken as the total break-up time, and the characteristic time for evaporation  $\unicode[STIX]{x1D70F}_{evap}$ is defined by the following equation in this study:
 $$\begin{eqnarray}\displaystyle \unicode[STIX]{x1D70F}_{evap}=m/{\dot{m}}. & & \displaystyle\end{eqnarray}$$
Here,  $m$ and
 ${\dot{m}}$ are the mass of WD and the evaporation rate of WD, respectively. To indicate the velocity and temperature equilibration between gas and WD, figure 11 shows (a) temperature, (b)
 $x$-velocity, (c) slope for relative
 $x$-velocity, (d)
 $y$-velocity of gas and droplets and relative
 $y$-velocity, (e) acceleration of WD, respectively.
Favre-averaged profiles for water droplets. (a) Droplet volume fraction, (b) droplet diameter, (c) Weber number, (d) particle Reynolds number and particle Mach number, (e) force acting on droplet, (f) characteristic times for evaporation and break-up, (g) square of droplet diameter, (h) number density, (i) droplet mass ratio.

Comparison between gas and droplets quantities. (a) Temperature, (b)  $x$-velocities, (c) normalized relative
 $x$-velocity, (d) velocity based on transverse kinetic energy, (e) droplet acceleration.

From figure 10(a), the liquid volume fraction increases at first due to drag between phases. Then, the droplet mass decreases (figure 10i), indicating that the evaporation implies the decrease of the volume fraction of WD, after the droplets have reached the saturation temperature (figure 11a).
The WD with an initial uniform diameter of  $15.9~\unicode[STIX]{x03BC}\text{m}$ sharply decrease to approximately
 $5~\unicode[STIX]{x03BC}\text{m}$ after the leading shock wave passage and then gradually decrease to around
 $3~\unicode[STIX]{x03BC}\text{m}$ (figure 10b). From figure 10(f), the break-up time is much shorter than that of evaporation immediately behind the shock where the droplet diameter and the relative velocity are the greatest, highlighting the dominant role of the break-up. The end of break-up can be seen in figure 10(c,f). As a result of break-up, a single parent droplet ‘gives birth’ to approximately 60 daughter droplets (figure 10h). Indeed, the Weber number which is highest after the shock then falls below the critical Weber number (around 12), which comes from the decrease of the droplet diameter towards its equilibrium value, but also due to the decrease of relative velocity. In this study, the characteristic length for break-up,
 $x_{br}$, is defined as the distance from the shock wave to the position where the Weber number becomes
 $We_{c}$. Under the present calculation conditions, the characteristic length for break-up is 4.9 h.r.l. from figure 10(c). The break-up completes after the induction zone (
 $x_{ind,thermicity}=0.7~\text{h.r.l.}$).
As shown in figure 10(i), the evaporation of WD is not completed within the computational domain. Indeed, the droplet mass ratio based on the initial mass constantly decreases and becomes 0.47 at 70 h.r.l. from the mean shock position. After the completion of break-up, the square of the droplet diameter can be seen to vary linearly with the distance to the shock (figure 10g), which is reminiscent of the evaporation  $d^{2}$ law and which emphasizes the fact that the droplet varies only by evaporation in this flow region. Therefore, the characteristic length for evaporation
 $x_{evap}$ is the distance for WD to finish evaporation and is evaluated from the linear approximation after the break-up, i.e. the region between 10 and 70 h.r.l. from the shock wave (figure 10g). This evaporation characteristic length is estimated to be 153.8 h.r.l.
The gas and WD temperature are shown in figure 11(a). The gas temperature increases by exothermic chemical reactions. The temperature of WD also increases due to the convective heat transfer with gas phase and then reaches the saturation temperature at the distance of 2.9 h.r.l., of which will be shown to be the fastest of all the relaxation processes. The temperature of WD does not equilibrate with the gas temperature, which means that temperature equilibrium is not achieved. The characteristic length for temperature equilibrium  $x_{sat}$ is defined as the distance from the shock wave to the position where the WD reaches the saturation temperature, and is estimated as 2.9 h.r.l.
The gas phase in the laboratory frame gets accelerated by the shock wave and then decreases due to the expansion of burned gas (figure 11b). The WD are accelerated due to quasi-steady drag and pressure forces. Due to these momentum transfers, the velocity of the droplet increases and that of the gas decreases to the equilibrium value. As a result, the relative velocity in the  $x$-direction between the gas and WD is maximum immediately after the shock wave and gradually decreases to one tenth of the maximum at a distance of 70 h.r.l. from the mean shock position. The ratio of the relative
 $x$-velocity to its initial value at the vN state is plotted as a function of distance in figure 11(c). After some transients, the slope is constant despite the change in the diameter due to evaporation, break-up and pressure gradient, from which a time constant can be deduced. The characteristic length for velocity equilibrium in the
 $x$-direction
 $x_{eq,velo}$ is defined as the distance from the shock wave to the position where the relative velocity decreases to 1 % of its maximum. Under the present conditions, the characteristic length for the velocity equilibrium in the
 $x$-direction is estimated as 304.6 h.r.l.
In order to obtain the spanwise contribution, the gas velocity in the  $y$-direction is estimated as follows:
 $\widetilde{v_{g}}=(\widetilde{\unicode[STIX]{x1D6FC}_{g}\unicode[STIX]{x1D70C}_{g}{v_{g}}^{2}}/\widetilde{\unicode[STIX]{x1D6FC}_{g}\unicode[STIX]{x1D70C}_{g}})^{1/2}$. The same procedure is used for the liquid spanwise velocity. The following is used for relative spanwise velocity:
 $\sqrt{\overline{(v_{g}-v_{l})^{2}}}$. The gas spanwise contribution is maximum at the shock and then decreases (figure 11d). However, the fluctuations of gas velocity in the
 $y$-direction remain large and the
 $y$-velocities do not seem to approach equilibrium (figure 11d).
The particle Reynolds number and the particle Mach number are also shown in figure 10(d). They have a maximum at the shock and then gradually decrease. The peak value of the particle Mach number is relatively high, with a value of 1.7 due to the high relative post-shock velocity. Thus, compressibility effects may have a large influence on the flow field around the WD. As for the particle Reynolds number, the peak value immediately after the shock wave is relatively low, approximately 300, because the diameter of WD is small, of the order of  $\unicode[STIX]{x03BC}\text{m}$, and the initial pressure is rather low in the present study. The particle Reynolds number rapidly decreases to approximately 60 due to the rapid decrease in diameter and relative velocity, and is approximately 20 at the end of the computational domain.
Both the quasi-steady drag and the pressure drag are also maximum after the shock, and the force acting on the WD becomes two or three orders less at the end of the computational domain (figure 10e). The magnitude of the quasi-steady drag is determined by the relative velocity and the diameter. Again, lower diameter and relative velocity further from the front induce the decrease of these two contributions in the momentum transfer. Their  $x$ and
 $y$-components are comparable. In addition, pressure drag is much smaller than quasi-steady drag by three orders of magnitude (figure 10e). The acceleration of WD in both the
 $x$ and the
 $y$-directions become maximum at the detonation front and smaller as the WD move from the shock wave (figure 11e). Since the quasi-steady drag, which is the dominant force acting on the WD, is larger in the
 $x$-direction than in the
 $y$-direction, the acceleration of the WD in the
 $x$-direction is larger than that in the
 $y$-direction from figure 11(e). The acceleration of the WD is proportional to the cube of the reciprocal of the diameter and the force acting on the WD. The diameter is approximately a quarter of the initial droplet diameter at the end of the computational domain (figure 10b) and the force acting on the WD is smaller by two or three orders of magnitude compared to its maximum value (figure 10e). Therefore, the acceleration decreases, mainly due to the decrease of the momentum transfer between phases, which comes from the decrease of the diameter and the drag.
The different characteristic lengths for WD in the present study are summarized in table 2.
Probability density function for droplet diameter as a function of the diameter for several distances from the shock.

Characteristic lengths for liquid dispersed phase (normalized by h.r.l.).

In the Favre-averaged one-dimensional profile on the droplet diameter shown in figure 10(b), the polydispersity in diameter observed in figure 7(d) and the process of break-up cannot be evaluated. Figure 12 shows the p.d.f. on the diameter as a function of the diameter for several distances from the shock. Indeed, the process of break-up is not uniform downstream of the leading detonation front. The latter is composed of incident shocks, Mach stems and transverse waves, all of which have different intensities. Thus, even though the initial droplet diameter is uniform, the polydisperse spray is the result of the interaction of break-up with the detonation cellular instabilities. The p.d.f. of droplets is shown in figure 12 for the positions 0.5, 1.0, 1.5, 2.0, 3.0, 5.0, 20.0, 40.0 and 60.0 h.r.l. After the break-up process, which is completed at 4.9 h.r.l. (figure 10c), the shape of the p.d.f. is similar and the diameter only gradually decreases by evaporation of WD, the influence of the cellular instabilities being reduced.
Break-up regime. (a) Probability density function for Weber number exceeding the critical Weber number, (b) cumulative function for Weber number exceeding the critical Weber number.

Figure 13 represents the p.d.f. and the cumulative function distribution for the Weber number exceeding the critical Weber number to show the break-up mode which the WD experience in the present study. According to the review by Guildenbecher et al. (Reference Guildenbecher, Lopez-Rivera and Sojka2009), the different break-up scenarios are bag, multimode, sheet-thinning and catastrophic break-up. Although the maximum Weber number is high up to 1200, the percentage of bag, multimode, sheet-thinning and catastrophic break-up is approximately 60 %, 20 %, 20 % and 0.3 % from figure 13(b) for the present calculation conditions. The break-up causes a decrease in diameter and also a polydisperse spray, highlighting the important influence of the break-up of the droplet during its course in the detonation cell, the leading shock continuously decelerating along with further impingements from transverse shock waves.
4.5 Interphase interactions and master equation
The interphase exchanges rates which are the right-hand side terms of (2.1)–(2.3) are evaluated in figure 14. Figure 14(a) confirms that evaporation is promoted by break-up, as the droplet size is greatly decreased. Indeed, only 1 % of WD can be estimated to be evaporated during this first phase. Then, evaporation rate is rather constant, with a slight peak, the temperature difference between phases that is not relaxed, being the driven force.
Favre-averaged interphase exchange rates from mean values. (a) Evaporation rate, (b) momentum transfer rate, (c) energy transfer rate.

Computed gaseous flux from averaged values. (a) Gaseous mass flux, (b) gaseous momentum flux, (c) mechanical fluctuations in the gaseous momentum flux, (d) gaseous total enthalpy flux, (e) mechanical and thermal fluctuations in the gaseous total enthalpy flux.

Favre-averaged profile on fluctuation. (a) Fluctuation normalized by Favre-averaged value, (b) turbulent Mach number, (c) Favre-averaged root mean gas velocity in the  $y$-direction.

The profile of momentum transfer rate in figure 14(b) is similar to that of the drag force in figure 10(e), the maximum being located at the detonation front. However, two factors for the momentum transfer are present: the first is due to drag and the second is due to evaporation. The former decreases as the relative velocity decreases and the latter contributes to increase the gas momentum.
The energy transfer is composed of three contributions (figure 14c). The first is due to the kinetic energy of the evaporating droplets, the second is due to the work of drag and the third, which is the main contribution, is due to the convective heat transfer and evaporation. The transferred kinetic energy increases due to the increase of the velocity of the droplet (figure 11b). The drag work is maximum at some distance from the shock. Indeed, the droplet has to get some velocity so that the drag work is non-zero. The peak of the energy transfer is due to the heat transferred to the droplets to attain the saturation temperature. The amount of energy transfer associated with endothermic evaporation is proportional to the amount of evaporated WD (figure 14a,c).
The interphase exchanges will modify the gaseous flux. From the mean values, the mass, momentum and total enthalpy gaseous flux have been evaluated and shown in figure 15, in line with Radulescu et al. (Reference Radulescu, Sharpe, Law and Lee2007). As for the gaseous mass flux, the density and velocity have opposite trends but the overall flux increases by several per cent (figure 15a). The overall gaseous momentum flux of the wet case is less than the dry case (figure 15b), mainly due to drag, which surpasses the evaporation contribution (figure 14b). The dynamic pressure of the wet case is lower than the dry case. The wet static pressure is lower at the shock due to the detonation velocity decrease, and then gets higher after some distance due to the relaxation processes. As for the gaseous total enthalpy flux, all contributions decrease (figure 15d). Near the shock, the contribution of enthalpy to the total enthalpy is very high, then a first decrease to 75 % can be observed. Indeed, below 5 h.r.l., the gas has to bring the droplets to their saturation temperature. Then, the total enthalpy continues to decrease more smoothly, due to drag and evaporation. The relative contribution of the enthalpy which decreases to 60 % in the dry case, decreases up to 40 % in the wet case, which means that the energy transfer mainly acts on the enthalpy. Thus in our case, the ratio of the enthalpy to the kinetic energy greatly decreases near the sonic line, as compared to the pure gaseous case.
Regardless of the presence of the WD, the mechanical fluctuations in the total momentum flux take a peak value of approximately 4 % compared to the gaseous momentum flux just after the shock wave and then remain relatively constant in the rear (figure 15c). The mechanical fluctuations for gaseous detonation with WD are lower than that without WD behind the shock wave. The mechanical and thermal fluctuations in total enthalpy flux are suppressed with the presence of WD as shown in figure 15(e). Indeed, the drag of droplets, of which their size is smaller than the eddy size will naturally decrease the level of velocity fluctuations.
To obtain more insight into the lowering of fluctuations, figure 16 shows (a) Favre-averaged fluctuations in gas quantities normalized by the Favre-averaged value and (b) Favre-averaged turbulent Mach number, (c) Favre-averaged root mean gas velocity in the  $y$-direction. Here, the turbulent Mach number is defined as the ratio of the fluctuations in gas velocity in the
 $x$-direction to the gas sound speed. After a first peak, the momentum transfer between phases decreases the gas
 $y$-velocity (figure 16c). Also, fluctuations of gas density, pressure, gas velocity in the
 $x$-direction and gas temperature take their maximum value just behind the front, and reach equilibrium (figure 16a), of which value is lower with WD. In addition, the turbulent Mach number gradually approaches 0.19 and 0.21 in the rear for the case with and without WD, respectively (figure 16b). This implies that the existence of WD lowers the turbulence. From the above, the interphase transfer moderates the gradient of the physical quantity and the WD play a role in lowering the overall fluctuations.
As the liquid volume fraction and the level of fluctuations are very low, the following laminar master equation for gaseous detonations laden with inert WD ( $\text{ME}^{2}$) can be derived from Higgins (Reference Higgins2012), Zhang (Reference Zhang2009) and Lee (Reference Lee2008):
 $$\begin{eqnarray}\displaystyle \left.\begin{array}{@{}l@{}}(1-M_{g}^{2}){\displaystyle \frac{1}{u_{g}}}{\displaystyle \frac{\text{d}u_{g}}{\text{d}x}}=\unicode[STIX]{x1D6F7},\\[12.0pt] \unicode[STIX]{x1D6F7}=\unicode[STIX]{x1D6F7}_{1}+\unicode[STIX]{x1D6F7}_{2}+\unicode[STIX]{x1D6F7}_{3}+\unicode[STIX]{x1D6F7}_{4}+\unicode[STIX]{x1D6F7}_{5}.\end{array}\right\} & & \displaystyle\end{eqnarray}$$
The ‘global generalized thermicity’ can be decomposed into the following five contributions:
 $$\begin{eqnarray}\displaystyle & \displaystyle \unicode[STIX]{x1D6F7}_{1}=\frac{{\dot{m}}}{\unicode[STIX]{x1D70C}_{g}u_{g}}, & \displaystyle\end{eqnarray}$$
 $$\begin{eqnarray}\displaystyle & \displaystyle \unicode[STIX]{x1D6F7}_{2}=\frac{1}{p_{g}}[{\dot{F}}-(D-u_{g}){\dot{m}}], & \displaystyle\end{eqnarray}$$
 $$\begin{eqnarray}\displaystyle & \displaystyle \unicode[STIX]{x1D6F7}_{3}=\frac{1}{\unicode[STIX]{x1D70C}_{g}u_{g}c_{p,g}T_{g}}\left[{\dot{E}}+\frac{D^{2}}{2}{\dot{m}}-D{\dot{F}}-{\dot{m}}\left(h_{g}+\frac{u_{g}^{2}}{2}\right)\right], & \displaystyle\end{eqnarray}$$
 $$\begin{eqnarray}\displaystyle & \displaystyle \unicode[STIX]{x1D6F7}_{4}=\unicode[STIX]{x1D6F7}_{4a}+\unicode[STIX]{x1D6F7}_{4b}, & \displaystyle\end{eqnarray}$$
 $$\begin{eqnarray}\displaystyle \unicode[STIX]{x1D6F7}_{4a}=-\frac{1}{u_{g}W_{g}}\frac{\text{d}W_{g}}{\text{d}t}, & & \displaystyle\end{eqnarray}$$
 $$\begin{eqnarray}\displaystyle \unicode[STIX]{x1D6F7}_{4b}=-\frac{1}{u_{g}c_{p,g}T_{g}}\mathop{\sum }_{k}\frac{\dot{\unicode[STIX]{x1D714}}_{g,k}}{\unicode[STIX]{x1D70C}_{g}}h_{k}, & & \displaystyle\end{eqnarray}$$
 $$\begin{eqnarray}\displaystyle \unicode[STIX]{x1D6F7}_{5}=-\frac{1}{\unicode[STIX]{x1D70C}_{g}u_{g}c_{p,g}T_{g}}\mathop{\sum }_{k}h_{g,k}(\dot{m_{k}}-Y_{g,k}{\dot{m}}). & & \displaystyle\end{eqnarray}$$
Here  $\unicode[STIX]{x1D70C}_{g}$,
 $u_{g}$,
 $T_{g}$,
 $M_{g}$,
 $h_{g}$,
 $c_{p,g}$ and
 $W_{g}$ are gas density, gas
 $x$-velocity in the shock frame, gas temperature, Mach number based on gas sound speed, gas enthalpy, specific heat at constant pressure for gas phase and gas molar mass, respectively. In this equation,
 ${\dot{m}}$,
 ${\dot{F}}$ and
 ${\dot{E}}$ represent the right-hand side of (2.1)–(2.3) and
 $D$ is the mean detonation velocity obtained from the simulations. The first term (4.5) is related to the evaporation mass transfer. The second term (4.6) is related to the momentum transfer. The third term (4.7) and fifth term (4.9) translate the influence of the energy transfer. The fourth term (4.8) is the classical thermicity term due to molar change (4.8a) and chemical heat release (4.8b). On figure 17, the global generalized thermicity
 $\unicode[STIX]{x1D6F7}$ (4.4), which is here the right-hand side of
 $\text{ME}^{2}$ shows a non-monotonous behaviour. It becomes zero at 15 h.r.l., at approximately the same location where the Mach number based on the two-phase sound speed goes to one. The global thermicity is also zero at 53 h.r.l., where the Mach number based on the gas sound speed
 $M_{g}$ goes to one (figures 17a,b).
Global generalized thermicity for gaseous detonations laden with inert WD. (a) Global generalized thermicity, (b) close-up view of global generalized thermicity and gas Mach number, (c) contribution of each term of the global generalized thermicity of the master equation ( $\text{ME}^{2}$) equation (4.4).

However, the two-phase sound speed is not completely relevant in our case, as there is still a pronounced velocity disequilibrium. Thus, the master equation  $\text{ME}^{2}$ shows that the hydrodynamic thickness should rely on the gaseous sound speed, due to the fact that the group velocity of the pressure waves is probably close to that of the gas pressure wave velocity. Moreover, this laminar master equation works well as the working mixture is a weakly unstable one and the cell becomes more regular with WD addition. From the contribution of each term in the master equation,
 $\text{ME}^{2}$, around the mean sonic point by gas sound speed (figure 17c), energy transfer by WD decreases the gas velocity whereas the mass, momentum and chemical reactions play a role in accelerating the gas.
4.6 Effect of water vapour from evaporation on chemistry
The additional water vapour from the evaporation of WD may modify the chemical path of the gaseous detonation. The p.d.f. of the induction and reaction lengths during propagation are depicted in figure 18. Owing to a lower detonation velocity, the probability to get greater induction lengths increases (figures 8j and 18a). However, the p.d.f. of the reaction length is almost the same regardless of the presence of WD (figures 8j and 18b). Figure 19 depicts the heat release rate computed from the mean values,  $\sum _{k}\dot{\unicode[STIX]{x1D714}}_{g,k}h_{g,k}$. The peak is decreased and the width is thickened, with the addition of WD.
Variation in induction and reaction zone length. (a) Probability density function for induction length defined by maximum thermicity position, (b) probability density function for reaction length defined by the position where the thermicity is 1 % of the maximum value.

Computed heat release rate from mean values as a function of distance.

Computed reaction rate of  $\text{H}_{2}$ from mean values as a function of mean temperature.

In order to quantify the influence of additional water vapour on the reactivity of the mixture, figure 20 shows the Arrhenius plot for hydrogen computed from the mean values. The chemical reaction starts from a lower temperature than that without WD due to the decrease of the propagation velocity. However, the slope is the same regardless of the presence of the WD, which means that the global activation energy in the induction and reaction zones does not change with WD.
Indeed, from comparison of the characteristic length for induction zone and break-up in the previous sub-sections, the break-up occurs downstream of the induction zone. Thus, the water vapour from the evaporation of WD does not affect the reactivity of the gaseous detonation in our case, as the amount of water coming from the WD evaporation within the induction zone is small (see figures 8h,j and 10c).
4.7 Comparison of the characteristic lengths
In this section, the mean structure of gaseous detonation with WD is explained by comparing the characteristic lengths of gaseous detonation and that of WD obtained in previous sections.
The characteristic lengths for gaseous detonation are the induction length, reaction length and the hydrodynamic thickness. The induction length is more or less increased (0.4–3.4 h.r.l.) due to lower propagation velocity, whereas the reaction length remains almost the same between the dry and wet case, approximately 15 h.r.l. (see § 4.6). Based on the gas sound speed, the hydrodynamic thickness increased from 33 to 47 h.r.l. (§ 4.3).
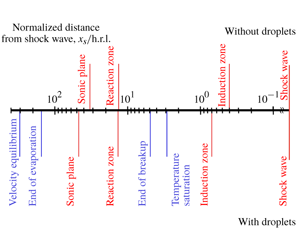
Schematic of gaseous detonation with dilute water spray under present simulation conditions.

The two-phase interactions between the gas and WD inside the mean subsonic zone between the mean shock location and the sonic surface induce the decrease of detonation propagation velocity. The temperature of the droplet rapidly reaches the saturation temperature at 3 h.r.l. Then, break-up which occurs and ends at 5 h.r.l. will produce smaller droplets, enhancing the overall interphase exchanges. However, the break-up is performed mostly after the induction zone. Thus, the additional water vapour which is produced during evaporation does not influence the main reaction zone. Only a drop of gas temperature is inferred from this endothermic evaporation. The latter proceeds well after the sonic plane and at the end, velocity equilibrium is also achieved. On the other hand, thermal equilibrium is not achieved.
Under the present simulation conditions, the schematic of gaseous detonation with dilute WD based on the present analysis is shown in figure 21 and the characteristic lengths of detonation and interphase exchanges can be ordered as follows:  $x_{ind}<x_{sat}<x_{br}<x_{reac}<x_{HT}<x_{evap}<x_{eq,velo}$. These characteristic lengths are intimately intertwined and characterize the mean structure of steady gaseous detonation laden with WD.
The present finding is thus in line with one of the limits exhibited by Jarsalé’s experiments (Jarsalé Reference Jarsalé2017) when the induction zone is shorter than the secondary break-up length and that the additional water vapour produced does not influence the main reaction zone, even if the mixtures are different.
5 Conclusions
The mean structure of gaseous detonation with dilute water spray was numerically analysed using two-dimensional reactive Navier–Stokes equations with detailed chemistry and the Eulerian–Lagrangian method. The present simulation takes into account droplet break-up which plays a crucial role in interphase exchanges and the behaviour of WD. The gaseous detonation with dilute water spray is studied using the recycling block method to enable detonation to propagate a long distance with an aim to get the statistical values. Its structure is qualitatively revealed by 2-D flow fields and more quantitatively by the Favre-averaged profiles in time and space for the dry and wet cases. The cellular structure of gaseous detonation with dilute water spray is more regular than the dry gaseous detonation counterpart, even if the cell size does not change much. Also, the flow fields reveal less complicated structures and the level of the fluctuations that develop downstream of the leading shock is lowered. However, the hydrodynamic thickness, based on the gas sound speed is increased due to the interaction with water spray, probably due to the cooling process of evaporation and the energy transfer. The global two-phase exchanges (mass, momentum and energy) that occur within the subsonic zone, induce a decrease of the detonation velocity. Droplet break-up occurs downstream of the induction zone and in our case, the water vapour from evaporation of the spray does not affect the reactivity of the gaseous detonation. Moreover, the mean particle Reynolds and Weber numbers have enabled us to characterize the regimes of droplet motion and the break-up regimes, which depend on the initial pressure. From the particle Mach number, immediately after the shock, the droplet experiences supersonic flows and then relaxes to subsonic conditions. In addition, the ratio of the enthalpy to that of the total enthalpy is decreased as compared to the dry case, increasing the relative importance of the kinetic energy. The laminar master equation which has been derived shows that the hydrodynamic thickness should rely on the gaseous sound speed, and works well as the working mixture is a weakly unstable one and its cellular structure is regular.
The characteristic lengths of detonation and interphase exchanges have been ordered under the present simulation conditions and have been shown to be intimately intertwined.
Acknowledgements
This work is partially supported by ‘Joint Usage/Research Center for Interdisciplinary Large-scale Information Infrastructures’ and ‘High Performance Computing Infrastructure’ in Japan (Project ID: jh170040, jh180030 and hp170039). Some of the experimental results in this research were obtained using supercomputing resources at Cyberscience Center, Tohoku University. An academic visit of A.C. to Keio University as Guest Professor (Global) was made possible through a funding for top Global University Project in the Keio University. This work was supported by the CPER FEDER project of Région Nouvelle Aquitaine.
Declaration of interests
The authors report no conflict of interest.
Appendix A. Detailed chemical reaction mechanism by Hong et al. (Reference Hong, Davidson and Hanson2011)
The chemical reaction used in the present paper is the detailed chemical reaction mechanism proposed by Hong et al. (Reference Hong, Davidson and Hanson2011), which considers nine species and 20 elementary reactions. The chemical reaction mechanism is listed in table 3.
The  $\text{H}_{2}\text{O}_{2}$ reaction mechanism by Hong et al. (Reference Hong, Davidson and Hanson2011).
 $k=AT^{n}\exp (E_{a}/RT)$ in unit of (
 $\text{s}^{-1}$), (
 $\text{cm}^{3}~\text{mol}^{-1}~\text{s}^{-1}$) or (
 $\text{cm}^{6}~\text{mol}^{-2}~\text{s}^{-1}$).

Appendix B. Validation case: interaction of a shock wave with a cloud of water droplets
The validation for the present numerical model on the droplet break-up is conducted through the comparison with previous experiment and the simulation on the interaction of a shock wave with a cloud of water droplets.
B.1 Computational target
The reference experiment has been conducted by Chauvin et al. (Reference Chauvin, Jourdan, Daniel, Houas and Tosello2011). Figure 22 shows the schematic of the experiments, as well as the initial conditions for the computations. They used a vertical shock tube with a total length of 3795 mm and an inner square cross-section of side 80 mm. The high-pressure chamber is 750 mm long and the driven section is 3045 mm. The test section at atmospheric conditions is filled with a cloud of droplets which is located between 2970 mm and 3710 mm. In the simulations, the droplet distribution is uniform, with a mean diameter of  $500~\unicode[STIX]{x03BC}\text{m}$. The liquid volume fraction is 1 %. Two pressure transducers are placed at 3080 mm and 3520 mm, which lie within the cloud. The Mach number is 1.49, thus the pressure in the driver section is 0.68 MPa. The mesh is uniform with a grid size of 1 mm and one-dimensional unsteady simulation is performed. The simulation without break-up is also conducted and is compared with the case that takes break-up into account to highlight its influence.
Interactions of a shock wave with a cloud of droplets. Initial conditions of the interaction of shock wave with a cloud of droplets.

Comparison of the overpressure evolution at two locations in the cloud of droplets between the experimental and numerical results. (a) First transducer P1 at  $x=3080~\text{mm}$, (b) second one P2 at
 $x=3520~\text{mm}$.

B.2 Overpressure history
The evolution of the overpressure in the present simulation is compared to the experimental and numerical results of Chauvin et al. (Reference Chauvin, Jourdan, Daniel, Houas and Tosello2011) and Chauvin et al. (Reference Chauvin, Daniel, Chinnayya, Massoni and Jourdan2016) in order to validate the implementation of the model. Figure 23 shows the overpressure history (a) of P1 the first pressure transducer at  $x=3080~\text{mm}$, (b) and P2 the second one at
 $x=3520~\text{mm}$, inside the water cloud. The initial time in figure 23 is the time when the shock wave reaches
 $x=1770~\text{mm}$ in the experiment. The simulation with break-up in figure 23 can capture the main features observed in the experiment that is, the overpressure decreases just after the shock wave passage and then relaxes to its equilibrium value. Indeed, droplet break-up greatly increases the interphase exchanges between phases, thus decreasing the gaseous velocity. The induced expansion decreases the overpressure, which also decreases the shock velocity driven by the gaseous phase. The simulation shows the same trend in overpressure after the passage of the shock wave as in the experiment. Also, the comparison between the present simulation with break-up based on the Eulerian–Eulerian method and the previous simulation results with the Marble model (Chauvin et al. Reference Chauvin, Daniel, Chinnayya, Massoni and Jourdan2016) shows good agreement. Therefore, the present simulation reproduces the phenomenon of the interaction of the shock wave with a water cloud, thus validating the break-up model. On the other hand, the simulation without break-up overestimates the overpressure history and shows a completely different trend. These comparisons show that the break-up modelling plays an important role in post-shock two-phase flows.
Appendix C. Assessment of numerical convergence
The numerical uncertainty is assessed by comparing the simulation results in the coarser grid in this section. The grid width used in the main result is  $50~\unicode[STIX]{x03BC}\text{m}$ and that for the coarse grid is double, i.e.
 $100~\unicode[STIX]{x03BC}\text{m}$. The simulation conditions are the same as presented in § 3. The gaseous detonation with dilute water spray propagates steadily and the decrease in mean propagation velocity compared to CJ velocity without WD is 3.8 %.
Favre-averaged profiles for gas phase in the coarse grid ( $100~\unicode[STIX]{x03BC}\text{m}$). (a) Pressure, (b) gas density, (c) Mach number in mean shock frame, (d) thermicity.

In order to assess the robustness of the main conclusions on mean structure by characteristic length comparison in figure 21, the Favre-averaged one-dimensional profiles for the gas phase in the coarse grid are shown in figure 24, which shows (a) pressure, (b) gas density, (c) Mach number in the mean shock frame, (d) thermicity, respectively. From figure 24, the profiles for gas phase globally show the same tendency between the present and the coarse grid. The characteristic lengths for the gas phase are estimated in the same manner as in § 4.3 and listed in table 4. Moreover, although the value of the characteristic length for the gas phase becomes slightly lower in the coarse grid, the ordering among the different characteristic lengths for the gas phase is not affected by the grid resolution.
Favre-averaged profiles for water droplet in the coarse grid ( $100~\unicode[STIX]{x03BC}\text{m}$). (a) Droplet diameter, (b) Weber number, (c) droplet mass ratio, (d) velocity in
 $x$-direction.

Characteristic lengths for gaseous detonation (normalized by h.r.l.) in coarse grid.

Figure 25 shows the Favre-averaged one-dimensional profiles for water droplets, (a) droplet diameter, (b) Weber number, (c) droplet mass ratio, (d) velocity in the  $x$-direction, respectively. The profiles for the Weber number between the two grids show a similar trend and the time for WD to finish break-up is longer in the coarse grid (figure 25b). The numerical resolution influences the degree of droplet break-up and then the diameter at the break-up process is larger in the coarse grid (figure 25a). After the break-up completion, the droplet diameter gradually decreases only by evaporation and the droplet mass ratio is higher in the coarse grid, which comes from the slower evaporation process by larger droplet diameter (figure 25a,c). From the viewpoint of the velocity equilibrium, water droplets with larger diameter in the coarse grid take a slightly longer time to accelerate due to a smaller surface area (figure 25d). However, the general feature for the velocity profiles is captured in the coarse grid. The characteristic lengths for water droplets are estimated in the same manner as in § 4.4 and listed in table 5. The characteristic lengths for water droplets are elongated in the coarse grid due to the change in behaviour of droplet diameter in figure 25(a). Nevertheless, the grid resolution does not change the sequence of the characteristic lengths for water droplets.
Characteristic lengths for liquid dispersed phase (normalized by h.r.l.) in coarse grid.

The mean quantities for the gas phase are converged and the mean behaviour of water droplets is similar between the fine present grid and the coarse grid. Therefore, the main conclusions on the mean structure for gaseous detonation with dilute WD will not be changed by the numerical uncertainty.



