Introduction
Several systematic reviews have shown that a diagnosis of major depressive disorder (Saz & Dewey, Reference Saz and Dewey2001; Cuijpers & Smit, Reference Cuijpers and Smit2002; Cuijpers et al. Reference Cuijpers, Vogelzangs, Twisk, Kleiboer, Li and Penninx2013), minor depression (Saz & Dewey, Reference Saz and Dewey2001), and screening positive for ‘caseness’ on self-report scales of depressive symptoms (Saz & Dewey, Reference Saz and Dewey2001; Cuijpers et al. Reference Cuijpers, Vogelzangs, Twisk, Kleiboer, Li and Penninx2013) are associated with an elevated risk of mortality. In the few studies which have examined depressive symptoms across the full continuum of severity, an increased risk of mortality has emerged in some at moderate levels of depressive symptom severity (Schoevers et al. Reference Schoevers, Geerlings, Deeg, Holwerda, Jonker and Beekman2009; Almeida et al. Reference Almeida, Alfonso, Hankey and Flicker2010; Scafato et al. Reference Scafato, Galluzzo, Ghirini, Gandin, Rossi, Solfrizzi, Panza, Di Carlo, Maggi and Farchi2012), whereas in others risk is only elevated in people with more severe symptoms (Everson-Rose et al. Reference Everson-Rose, House and Mero2004; van den Brink et al. Reference Van den Brink, Tijhuis, van den Bos, Giampaoli, Nissinen and Kromhout2005; Wulsin et al. Reference Wulsin, Evans, Vasan, Murabito, Kelly-Hayes and Benjamin2005; Ryan et al. Reference Ryan, Carriere, Ritchie, Stewart, Toulemonde, Dartigues, Tzourio and Ancelin2008). In all of these studies, scores on the severity of depressive symptoms were collapsed into a small number of categories (Everson-Rose et al. Reference Everson-Rose, House and Mero2004; van den Brink et al. Reference Van den Brink, Tijhuis, van den Bos, Giampaoli, Nissinen and Kromhout2005; Wulsin et al. Reference Wulsin, Evans, Vasan, Murabito, Kelly-Hayes and Benjamin2005; Ryan et al. Reference Ryan, Carriere, Ritchie, Stewart, Toulemonde, Dartigues, Tzourio and Ancelin2008; Schoevers et al. Reference Schoevers, Geerlings, Deeg, Holwerda, Jonker and Beekman2009; Almeida et al. Reference Almeida, Alfonso, Hankey and Flicker2010; Scafato et al. Reference Scafato, Galluzzo, Ghirini, Gandin, Rossi, Solfrizzi, Panza, Di Carlo, Maggi and Farchi2012), so limiting insights into the ‘shape’ of the depressive symptom-mortality relation (i.e. dose–response v. threshold).
We undertook an analysis of the association between depressive symptoms and mortality across the full range of severity of depressive symptoms in the English Longitudinal Study of Ageing (ELSA), a large, well-characterized, community-based cohort study of older adults. We hypothesized that the association between depressive symptoms and the risk of all-cause mortality would emerge at a severity below current thresholds for identifying clinically relevant symptoms of depression.
Method
We used data from the ELSA. Initiated in 2002/2003, the ELSA is an on-going, longitudinal, biannual, nationally representative, prospective cohort study of health and ageing (Mindell et al. Reference Mindell, Biddulph, Hirani, Stamatakis, Craig, Nunn and Shelton2012). It is derived from adults aged ⩾50 years who had earlier participated in the Health Survey for England (HSE) in 1998, 1999, and 2001. Comparisons of the social and demographic characteristics of participants with the national census show that this sample was representative of the English population (Steptoe et al. Reference Steptoe, Breeze, Banks and Nazroo2013). We excluded 287 participants who did not give consent to link to the mortality records, resulting in a sample of 11 104 study members (6054 women, 5050 men). Ethical approval for the ELSA was given by the National Research Ethics Service (MREC/01/2/91).
Measurement of depressive symptoms
During the 2002/2003 household visit, information was collected on depressive symptoms using a computer-assisted personal interview. Depressive symptoms were measured using the eight-item Center for Epidemiological Studies – Depression scale (CES-D; Radloff, Reference Radloff1977; Turvey et al. Reference Turvey, Wallace and Herzog1999). Used in the Health and Retirement Study (Steffick & the HRS Health Working Group, Reference Steffick2000) and other population-based studies (Radloff, Reference Radloff1977; Turvey et al. Reference Turvey, Wallace and Herzog1999), the CES-D captures information on depressive symptoms and somatic complaints experienced in the past week (see online Supplementary material for individual scale items). A dichotomous (yes/no) response to each item results in a total score of between 0 (no symptoms) and 8 (most severe symptoms). This short version has good internal consistency (Cronbach's α > 0.95) and has comparable psychometric properties to the full 20-item CES-D (Radloff, Reference Radloff1977; Turvey et al. Reference Turvey, Wallace and Herzog1999). A total CES-D score of ⩾3 (Turvey et al. Reference Turvey, Wallace and Herzog1999) or ⩾4 (Steffick & the HRS Health Working Group, Reference Steffick2000) has been used to denote ‘caseness’. These thresholds have been validated against standardized psychiatric interviews for depression in older adults, and are equivalent to the conventional demarcation point of ⩾16 on the full 20-item CES-D (Turvey et al. Reference Turvey, Wallace and Herzog1999; Steffick & the HRS Health Working Group, Reference Steffick2000).
Measurement of covariates
From the 2002/2003 interview we obtained information on social, demographic, clinical, and lifestyle covariates using a computer-assisted personal interview. Socioeconomic position was based on the National Statistics Socio-economic Classification (NS-SEC) classification system (Rose & Pevalin, Reference Rose and Pevalin2003). A wealth score was based on the sum of all financial, physical (businesses, land) and housing wealth, minus debts and pension payments (Banks et al. Reference Banks, Breeze, Lessof and Nazroo2006). Cohabitation status was defined as currently living alone or not. Self-reported health behaviours included smoking status (current, ex-smoker, never), frequency of alcohol consumption in the past year (not at all, on special occasions, once or twice a month, once or twice a week, daily, ⩾2 times a day), and physical activity during leisure time, recorded as participation in vigorous, moderate, and mild activities (more than once per week, once per week, 1–3 times per month, hardly ever) (Hamer et al. Reference Hamer, Molloy, de Oliveira and Demakakos2009).
Measures of health included lifetime self-reported doctor diagnoses of chronic somatic conditions [chronic obstructive pulmonary disorder (COPD), asthma, diabetes, and arthritis], circulatory disease (hypertension, prior heart attack, stroke, angina), heart conditions (murmur, abnormal heart rhythm), depression and cancer. The use of antidepressants was recorded at wave 0 (HSE interviews in 1998, 1999 and 2001). Cognitive function was assessed using a test of memory and executive function (Steel et al. Reference Steel, Huppert, McWilliams and Melzer2003). Functional impairments were assessed by asking participants whether they experienced difficulties, for at least 3 months, with six activities of daily living (ADL) and seven instrumental activities of daily living (IADL; Steel et al. Reference Steel, Huppert, McWilliams and Melzer2003). Participants reporting one or more problems with an ADL or IADL were classified as having a functional impairment.
Mortality ascertainment
All-cause mortality was ascertained for a 9-year period for consenting study members (11 104; 97.5% of eligible participants) by linking to the UK National Health Service mortality register up to until 15 March 2012. In the UK, registration of death within 5 days is a legal requirement so participants not registered as dead were assumed to be alive.
Statistical analysis
The characteristics of participants were compared according to the severity of their depressive symptoms using the χ2 test and analysis of variance. We then used Cox proportional hazards models (Cox, Reference Cox1972), with accompanying 95% confidence intervals (CIs), to estimate the association between depressive symptoms and mortality. We ascertained that the proportional hazards assumption had not been violated by inspecting the log [−log(survival)] plot and Schoenfeld residuals. Participants scoring 0 on the CES-D were regarded as being free of depressive symptoms and this was our reference group. We compared this reference group with those participants scoring in each of the remaining eight groups, plotted Kaplan–Meier survival curves for each group, and also reported hazard ratios (HRs) per standard deviation (s.d.) increase in depressive symptoms (s.d. = 2.00).
Survival time was measured in months from the date of interview to date of death or the 15 March 2012 – which ever came first. Emigrants were included in analyses with the date of their last interview as their censoring date. In preliminary analyses, there was no evidence that the association between depressive symptoms and mortality was modified by sex, so data for men and women were pooled and analyses sex-adjusted. We also took into account potentially important covariates, grouped according to themes. Basic model: age, sex and ethnicity; socioeconomic position, health behaviours, chronic conditions, circulatory disease, heart conditions, cancer, tests of cognitive function, any functional impairment, all diagnosed conditions, any antidepressant use reported in HSE interviews in 1998, 1999 and 2001, and a fully adjusted model with all variables. As depression and cognitive function share symptoms (e.g. impaired concentration, fatigue) the adjustment for cognitive function could be considered an example of over-adjustment. We therefore show models with and without the addition of cognitive function. The effect on the HR of adjusting for each set of covariates was estimated using the following formula [(HR basic model – 1) – (HR adjusted model – 1)/(HR basic model – 1)] × 100% (Batty et al. Reference Batty, Der, Macintyre and Deary2006).
Sensitivity analysis
We conducted several planned sensitivity analyses. We compared people with data missing for one or more variables with those with complete data using t tests and the χ2 test. The proportion of missing data from item non-response was then imputed using multiple imputation by chained equations which included all variables (including mortality) in the prediction model using the ‘ice’ command in Stata v. 13 (StataCorp., USA) to generate 10 imputed datasets (White et al. Reference White, Royston and Wood2011). To examine the effect of imputing data on the association between depressive symptoms and mortality we ran our analysis in a sample with no missing data (n = 10 131). In addition, we calculated a depressive symptom score after removing three items relating to somatic symptoms (see online Supplementary material for scale items), to examine if associations with mortality could be attributed to somatic complaints brought about by physical illness, rather than depressive symptoms. To examine reverse cause, whereby somatic illness might have increased the risk of both depressive symptoms and death, we carried out subgroup analysis after excluding the 982 deaths that occurred within the first 5 years of follow-up. All analyses were conducted using Stata v. 13. The reporting of this study conforms to the STROBE statement (von Elm et al. Reference Von Elm, Altman, Egger, Pocock, Gøtzsche and Vandenbroucke2007).
Results
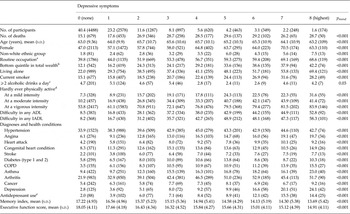
Table 1 shows the characteristics of participants according to the severity of their depressive symptoms. The majority of people reported at least one depressive symptom (59.5%, 95% = 58.7–60.5) and the mean symptom severity score was 1.68 (s.d. = 2.00, range 0–8, median = 1.00, interquartile range 1.00–2.00). People reporting a greater severity of depressive symptoms were more likely to be female, older, non-white, employed in a routine occupation, have lower wealth, live alone, have impaired physical functioning, a smoker, hardly ever engage in physical activity, use antidepressants, have lower memory and executive function scores, and report a doctor-diagnosed health condition, than those with lower scores (p < 0.001, Table 1). There was also evidence that the highest levels of alcohol consumption were found in study members at opposing ends of the continuum of depressive symptoms.
Characteristics of 11 104 ELSA participants according to the severity of depressive symptoms

s.d., Sandard deviation; IADL, instrumental activities of daily living; COPD, chronic obstructive pulmonary disorder.
Data are % (N) of participants unless stated otherwise.
a National Statistics Socio-economic Classification (NS-SEC) classification system: Higher managerial, administrative and professional occupations, Intermediate occupations, Routine and manual occupations.
b Total wealth excludes debt and regular pension payments.
c Two alcoholic drinks a day over the past year.
d Hardly ever engaged in: mild; moderate; or vigorous physical activity.
e Self-reported use of antidepressants in wave 0 comprising of selective serotonin reuptake inhibitors (SSRIs) [British National Formulary (BNF) code: 40303] and tricyclic antidepressants (BNF: 40301). A higher CES-D score indicates greater depressive symptoms.
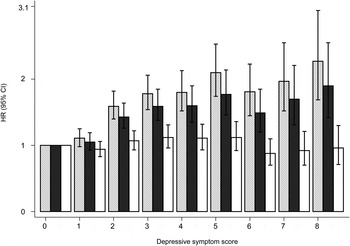
Of the 11 104 participants in the ELSA, 2267 (20.4%) died during a mean follow-up of 9.1 years (s.d. = 2.3). Fig. 1 shows a positive trend was found with more severe depressive symptoms associated with a higher rate of mortality (p trend < 0.001). After adjustment for socioeconomic position, the strength of the association between depressive symptoms and mortality (HR per 1 s.d. disadvantage) reduced from 1.26 in the basic model (age-, sex- and ethnicity-adjusted) to 1.20, representing a 23% attenuation in risk. The greatest reduction in HRs occurred after adding health behaviours to the model (a 62% reduction compared to the basic model), followed by functional impairments (54%) and physician diagnoses (23%), although after these separate adjustments the trend remained statistically significant at the p < 0.001 level. After full adjustment, the positive association between symptom severity and mortality was effectively eliminated (100% attenuation, p trend = 0.25, Fig. 1 and online Supplementary Table S1). Of the factors entered into the multivariable model, physical activity and functional impairments alone accounted for 73% of the depressive symptom-mortality association.
Basic adjustment: age, sex and ethnicity (hatched bars); basic adjustment plus any condition or diagnosis: chronic diseases, circulatory disease, and cancers (black); full adjustment: basic adjustment plus socioeconomic position, living alone, any condition or diagnosis antidepressant medication, and health behaviours (white). The reference group are participants with a score of zero; a higher score indicates more severe depressive symptoms. HR, Hazard ratio; CI, confidence interval.

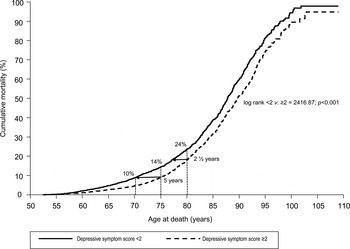
The unadjusted Kaplan–Meier failure curve (Fig. 2), 95% CIs for the HRs for a CES-D score of 0–8 (online Supplementary Table S1) and survival curve (online Supplementary Fig. S1) suggest there is a threshold in the association between depressive symptoms and mortality. Although the HRs increase with symptom severity there is not a statistically significant increase in risk after a score of 2 (log rank for a score of <2 v. ⩾2 = 2416.87; p < 0.001). Fig. 2 shows that by 70 years of age 10% of people with a depressive symptom score ⩾2 had died, a mortality rate that is not reached until age 75 years in those with a depressive symptom score <2.
Kaplan–Meier failure curve for all-cause mortality in people with a depressive symptom score of <2 or ⩾2.

Sensitivity analysis
Data were missing for one or more variables for 8.8% (n = 973) of the sample. Compared to those study members who featured in the analytical sample, people with missing data were more likely to be older, female, non-white, be in the lowest quintile for wealth, live alone, have had a heart attack, stroke, have diabetes, a heart condition, be inactive at mild, moderate or vigorous intensities, have a functional impairment, but less likely to drink heavily, or have smoked. However, no more likely to have angina, cancer, arthritis, COPD, asthma, be in a lower social class, or report using antidepressants. We examined the impact on our main estimates of missing data by repeating the analysis in participants without any missing data (n = 10 131). The results were comparable to those in the main analysis [age-, sex- and ethnicity-adjusted HR per s.d. disadvantage with imputed data was 1.26 (95% CI 1.22–1.31); the HR in sample without any missing data was 1.25 (95% CI 1.21–1.31); online Supplementary Tables S1 and S3]. We also re-ran our analysis after removing items from the depressive symptom scale relating to somatic symptoms. The association between depressive symptoms and mortality was slightly attenuated after removing somatic symptoms, but the trend remained significant (p < 0.001, online Supplementary Table S4).
Subgroup analysis
We excluded 982 deaths which occurred within the first 5 years of follow-up to test for reverse causality. These exclusions slightly reduced the strength of the association between depressive symptoms and mortality, but replicated the trend found in the main analysis (online Supplementary Table S5).
Discussion
The main finding in this study was an association between depressive symptoms across the full range of severity and all-cause mortality. We found that even in people with low to moderate symptom scores that they would not usually bring them to the attention of mental health services, experienced an increased risk of mortality. Excluding deaths occurring in the first 5 years of follow-up produced only a modest attenuation of the association suggesting it may be partially attributable to reverse cause. Adjustment for a wide range of potential confounding factors, including levels of physical inactivity, cognitive function, impairments and physical illnesses fully attenuated the association.
We identified seven cohort studies that had examined the association between depressive symptoms across the continuum of severity and mortality (Everson-Rose et al. Reference Everson-Rose, House and Mero2004; van den Brink et al. Reference Van den Brink, Tijhuis, van den Bos, Giampaoli, Nissinen and Kromhout2005; Wulsin et al. Reference Wulsin, Evans, Vasan, Murabito, Kelly-Hayes and Benjamin2005; Ryan et al. Reference Ryan, Carriere, Ritchie, Stewart, Toulemonde, Dartigues, Tzourio and Ancelin2008; Schoevers et al. Reference Schoevers, Geerlings, Deeg, Holwerda, Jonker and Beekman2009; Almeida et al. Reference Almeida, Alfonso, Hankey and Flicker2010; Scafato et al. Reference Scafato, Galluzzo, Ghirini, Gandin, Rossi, Solfrizzi, Panza, Di Carlo, Maggi and Farchi2012). Our results are broadly consistent with these studies, but comparisons are hampered by the wide variation in measures of depressive symptoms and the categorization of depressive symptom scores used. For example, we replicated the finding of a cohort of Australian men (Almeida et al. Reference Almeida, Alfonso, Hankey and Flicker2010) and the Italian Longitudinal Study of Ageing (Scafato et al. Reference Scafato, Galluzzo, Ghirini, Gandin, Rossi, Solfrizzi, Panza, Di Carlo, Maggi and Farchi2012) which both found the risk of mortality was raised at low levels of symptom severity on the Geriatric Depression Scale (GDS). However, as one used the 15-item (Almeida et al. Reference Almeida, Alfonso, Hankey and Flicker2010) and the other a 30-item version of the GDS (Scafato et al. Reference Scafato, Galluzzo, Ghirini, Gandin, Rossi, Solfrizzi, Panza, Di Carlo, Maggi and Farchi2012), and both collapsed symptom scores, the point at which mortality risk became elevated was unclear. Other investigators have found the risk of mortality to become raised in the highest tertile (Everson-Rose et al. Reference Everson-Rose, House and Mero2004), or quintile (Ryan et al. Reference Ryan, Carriere, Ritchie, Stewart, Toulemonde, Dartigues, Tzourio and Ancelin2008) of depressive symptom severity scores. Our findings do, however, replicate those of an individual-participant meta-analysis of the association between psychological distress, across the full range of symptoms severity and mortality (Russ et al. Reference Russ, Stamatakis, Hamer, Starr, Kivimaki and Batty2012).
The mechanism underpinning the association between the depressive symptoms and mortality is not well understood. To date, the most consistent pattern of attenuation of the association between depressive symptoms and all-cause mortality has been observed for physical illness (Wulsin et al. Reference Wulsin, Evans, Vasan, Murabito, Kelly-Hayes and Benjamin2005; Houle, Reference Houle2013), functional impairments (Ganguli et al. Reference Ganguli, Dodge and Mulsant2002; Everson-Rose et al. Reference Everson-Rose, House and Mero2004), and health behaviours (Penninx, Reference Penninx1999; Schulz et al. Reference Schulz, Beach, Ives, Martire, Ariyo and Kop2000; Everson-Rose et al. Reference Everson-Rose, House and Mero2004; Wulsin et al. Reference Wulsin, Evans, Vasan, Murabito, Kelly-Hayes and Benjamin2005). We replicated these findings, with functional impairments explaining 54% and health behaviours 62% of the association between depressive symptoms and mortality. In particular, physical activity and functional impairments alone explained 73% of this association. This pattern of attenuation is either consistent with confounding or mediation. It could be that inactivity and functional impairments increase depressive symptoms and the risk of mortality, suggesting confounding. Alternatively, as engaging in low levels of physical activity has been shown to slow the progression in mobility impairments (Miller et al. Reference Miller, Rejeski, Reboussin, Ten Have and Ettinger2000), these factors could form part of an indirect mechanism which explains the association between depressive symptoms and mortality (Blazer et al. Reference Blazer, Hybels and Pieper2001). A recent analysis of the Americans’ Changing Lives Study provided partial support for a mediational hypothesis showing time-varying changes in physical illness and functional impairments mediated the association between baseline depressive symptoms and mortality (Houle, Reference Houle2013), but changes in physical health conditions which preceded the assessment of depressive symptoms did not. Although randomized trials have shown mixed treatment effects of exercise on depression (Cooney et al. Reference Cooney, Dwan, Greig, Lawlor, Rimer, Waugh, McMurdo and Mead2013), few have investigated whether treatments which are effective in reducing depressive symptoms also improve functional impairment and levels of physical activity. These studies should also assess whether these factors mediate any treatment effect on mortality.
An alternative explanation is a direct effect, where depressive symptoms cause a physiological change which increases the risk of mortality. Depressive symptoms are associated with elevated inflammatory markers, including levels of C-reactive protein, interleukin-6 (IL-6), and tumour necrosis factors (Dinan, Reference Dinan2009). Injection with interferon-alpha (which increases cytokines and cortisol) (Gisslinger et al. Reference Gisslinger, Svoboda, Clodi, Gilly, Ludwig, Havelec and Luger1993) has also been shown to elicit short-term increases in depressive symptoms (Capuron et al. Reference Capuron, Raison, Musselman, Lawson, Nemeroff and Miller2003), and a meta-analysis of 22 trials of antidepressants approved by the United States Food and Drug Administration showed a reduction in depressive symptoms was accompanied by a decrease in inflammatory cytokines after drug therapy (Hannestad et al. Reference Hannestad, DellaGioia and Bloch2011). However, the use of antidepressants has also been associated with elevated C-reactive protein levels (Hamer et al. Reference Hamer, Batty, Marmot, Singh-Manoux and Kivimaki2011) and an increased risk for cardiovascular disease independent of co-morbidity (Hamer et al. Reference Hamer, Batty, Seldenrijk and Kivimaki2010), such that the association between depressive symptoms, antidepressants and mortality is unclear. In the present study, adjustment for antidepressant had essentially no effect on risk estimates, suggesting antidepressant use is unlikely to explain the association between mortality and depressive symptoms.
The main strength of this study is that it is with a nationally-representative sample, had a 9-year follow-up, and detailed assessments of covariates. The large number of deaths (n = 2267) allowed reverse causality to be investigated as a sufficient number of deaths remained after those occurring in the first 5 years of follow-up were excluded. The study also has some weaknesses. First, the CES-D although widely used in population-based studies is not without limitations. The scale only assesses symptoms in the past week, and does not provide a clinical diagnosis of major depression, even though there is evidence that screening positive on the eight-item CES-D we used is associated with a diagnosis of major depressive disorder (Turvey et al. Reference Turvey, Wallace and Herzog1999; Steffick & the HRS Health Working Group, Reference Steffick2000). Second, potentially important covariates such as adherence to psychological treatments (DiMatteo et al. Reference DiMatteo, Lepper and Croghan2000), diet and disease severity were not available. While we did not directly measure disease severity, our measures of mobility and functional impairment are indicators of disease severity, as they reflect the impact of multiple co-morbidities on the individual. If these factors were associated with depressive symptoms and mortality risk in a pattern which replicated the threshold we observed, the association may be due to confounding. Third, around 11% of participants had missing data for one or more variables; sensitivity analysis comparing the HRs across complete case and imputed datasets showed no difference, suggesting bias introduced by missing data was minimal. Fourth, as depressive symptoms are typically of a lower severity in people aged 50–60 years than in younger populations (Sutin et al. Reference Sutin, Terracciano, Milaneschi, An, Ferrucci and Zonderman2013), these finding may not generalize to people aged <50 years.
In this large prospective study of men and women aged ⩾50 years, depressive symptoms were associated with an increased risk of mortality, even at low levels of symptom severity. Levels of physical inactivity, cognitive function, functional impairments and physical illnesses fully attenuated this association. A third of older adults had symptoms at a severity associated with an increased risk for mortality, and one in ten scored under validated cut-points for clinically significant depressive symptoms but experienced an increased risk for all-cause mortality, suggesting current cut-points do not identify one in ten people at an increased risk for early death.
Supplementary material
For supplementary material accompanying this paper visit http://dx.doi.org/10.1017/S0033291715000732.
Acknowledgements
The English Longitudinal Study of Ageing was developed by a team of researchers based at the University College London, National Centre for Social Research, and the Institute for Fiscal Studies. The data were collected by the National Centre for Social Research. The funding is provided by the National Institute of Aging in the United States, and a consortium of UK government departments coordinated by the Office for National Statistics. The developers and funders of the English Longitudinal Study of Ageing and the UK Data Archive do not bear any responsibility for the analyses or interpretations presented here. J.W. is supported by the support of The Centre for the Development and Evaluation of Complex Interventions for Public Health Improvement (DECIPHer), a UKCRC Public Health Research Centre of Excellence. Joint funding (MR/KO 232,331/1) from the British Heart Foundation, Cancer Research UK, Economic and Social Research Council, Medical Research Council, the Welsh Government and the Wellcome Trust, under the auspices of the UK Clinical Research Collaboration, is gratefully acknowledged. M.K. is supported by the UK Medical Research Council (K013351), the Academy of Finland, the United States National Institutes of Health (R01HL036310; R01AG034454) and by a professorial fellowship from the Economic and Social Research Council. G.D.B. is a member of the University of Edinburgh Centre for Cognitive Ageing and Cognitive Epidemiology, part of the cross council Lifelong Health and Wellbeing Initiative (G0700704/84698).
Declaration of Interest
None.