1 Introduction
In this paper, we continue the analysis of the evolution of a vortex embedded in a vertically sheared flow in a strongly stratified fluid. The main purpose is to determine the conditions under which the vertical shear can grow sufficiently to lead to the development of the shear instability.
This instability is thought to be an important process for the generation of small scales in stratified flows (Riley & deBruynKops Reference Riley and deBruynKops2003; Laval, McWilliams & Dubrulle Reference Laval, McWilliams and Dubrulle2003; Lindborg Reference Lindborg2006; Brethouwer et al. Reference Brethouwer, Billant, Lindborg and Chomaz2007). In the case of a columnar counter-rotating vortex pair, Deloncle, Billant & Chomaz (Reference Deloncle, Billant and Chomaz2008) and Waite & Smolarkiewicz (Reference Waite and Smolarkiewicz2008) have reported that the vertical shear generated by the zigzag instability can lead to the development of the shear instability. This occurs when the buoyancy Reynolds number  $Re_{b}=ReF_{h}^{2}$ (
 $Re$ is the classical Reynolds number and
 $F_{h}$ the horizontal Froude number) is above a threshold since the minimum Richardson number is inversely proportional to
 $Re_{b}$ (Riley & deBruynKops Reference Riley and deBruynKops2003; Deloncle et al. Reference Deloncle, Billant and Chomaz2008; Augier & Billant Reference Augier and Billant2011). The subsequent destabilization of the Kelvin–Helmholtz billows leads to small-scale turbulence with spectral characteristics similar to those of randomly forced stratified turbulence (Augier, Chomaz & Billant Reference Augier, Chomaz and Billant2012; Waite Reference Waite2013).
However, a counter-rotating vortex pair is a very specific flow. Here, we consider the more generic configuration of a single vortex in an ambient shear flow. Such idealized flow contains two elementary ingredients often at play in stratified flows: a horizontal flow with vertical vorticity embedded in a vertical shear flow. In Bonnici & Billant (Reference Bonnici and Billant2020) (referred to hereinafter as Part  $1$), we have studied such a flow by means of a long-wavelength analysis for
 $k_{z}F_{h}\ll 1$, where
 $k_{z}$ is the dimensionless vertical wavenumber of the sinusoidal shear flow. This analysis provides a complete description of the vortex dynamics: the evolution of the vortex axis and angular velocity as well as secondary flows created as the vortex is bent. From these results, we have shown that the minimum Richardson number cannot go below the critical value
 $1/4$ when
 $k_{z}F_{h}\ll 1$. In the present paper, we will conduct direct numerical simulations (DNS) of this flow for both small and finite
 $k_{z}F_{h}$ and analyse its dynamics in the light of the asymptotic analysis.
The paper is organized as follows. The initial conditions, control parameters and numerical method are described in § 2. An overview of two typical simulations is first given in § 3. Then, the long-wavelength analysis is first briefly summarized in § 4.1 and its predictions for the deformations of the vortex axis are compared to the numerical simulations in § 4.2. We then focus on the evolution of the flow at the vortex centre and the mid-vertical level where the vertical shear is maximum (§ 4.3). Again, the asymptotic analysis is used to rationalize the numerical results. Finally, § 5 concentrates on the evolution of the Richardson number for finite  $k_{z}F_{h}$. Section 6 summarizes and discusses the results.
2 Formulation of the problem
2.1 Initial conditions and governing equations
As in Part  $1$, the initial flow is chosen as
 $$\begin{eqnarray}\boldsymbol{u}(\boldsymbol{x},t=0)=\boldsymbol{U}_{S}+\boldsymbol{u}_{v},\end{eqnarray}$$
where  $\boldsymbol{U}_{S}$ is a sinusoidal shear flow and
 $\boldsymbol{u}_{v}$ a columnar vortex with a Lamb–Oseen profile
 $$\begin{eqnarray}\boldsymbol{U}_{S}=U_{S}\sin (k_{z}z)\boldsymbol{e}_{x},\quad \boldsymbol{u}_{v}=\frac{1-\exp (-r^{2})}{r}\boldsymbol{e}_{\unicode[STIX]{x1D703}},\end{eqnarray}$$
where  $(x,y,z)$ and
 $(r,\unicode[STIX]{x1D703},z)$ are Cartesian and cylindrical coordinates, respectively,
 $(\boldsymbol{e}_{x},\boldsymbol{e}_{y},\boldsymbol{e}_{z})$ and
 $(\boldsymbol{e}_{r},\boldsymbol{e}_{\unicode[STIX]{x1D703}},\boldsymbol{e}_{z})$ are the associated unit vectors. The horizontal and vertical velocities in Cartesian coordinates are denoted
 $\boldsymbol{u}_{h}=(u,v)$ and
 $w$.
In (2.2), the length and time have been non-dimensionalized by the vortex radius  $a_{0}$ and the turnover time
 $2\unicode[STIX]{x03C0}a_{0}^{2}/\unicode[STIX]{x1D6E4}$ of the vortex, where
 $\unicode[STIX]{x1D6E4}$ is the vortex circulation. The shear amplitude
 $U_{S}$ and wavenumber
 $k_{z}$ are therefore non-dimensional:
 $U_{S}=\hat{U} _{S}2\unicode[STIX]{x03C0}a_{0}/\unicode[STIX]{x1D6E4}$,
 $k_{z}=\hat{k}_{z}a_{0}$, where
 $\hat{U} _{S}$ and
 $\hat{k}_{z}$ are the corresponding dimensional quantities. The governing equations are the incompressible Navier–Stokes equations under the Boussinesq approximation (see Part 1). The Reynolds, Froude and Schmidt numbers are defined as
 $$\begin{eqnarray}Re=\frac{\unicode[STIX]{x1D6E4}}{2\unicode[STIX]{x03C0}\unicode[STIX]{x1D708}},\quad F_{h}=\frac{\unicode[STIX]{x1D6E4}}{2\unicode[STIX]{x03C0}a_{0}^{2}N},\quad Sc=\frac{\unicode[STIX]{x1D708}}{\unicode[STIX]{x1D705}},\end{eqnarray}$$
with  $\unicode[STIX]{x1D708}$ the viscosity,
 $\unicode[STIX]{x1D705}$ the diffusivity and
 $N$ the Brunt–Väisälä frequency, which is assumed constant.
2.2 Numerical method
The equations are integrated numerically by means of a pseudo-spectral method with periodic boundary conditions and a fourth-order Runge–Kutta time advancement scheme (Deloncle et al. Reference Deloncle, Billant and Chomaz2008). An elliptic truncation of the top one third of the modes in each direction is applied. The viscous and diffusive terms are integrated exactly. The horizontal size of the computational domain is taken large  $l_{x}=l_{y}=18$ in order to minimize the effect of the periodic boundary conditions. Periodic boundary conditions are indeed responsible for the presence of image vortices located in the virtual boxes adjacent to the computational domain. The strain field due to these image vortices is proportional to
 $\unicode[STIX]{x1D6E4}/(2\unicode[STIX]{x03C0}l_{x}^{2})$ and
 $\unicode[STIX]{x1D6E4}/(2\unicode[STIX]{x03C0}l_{y}^{2})$. Periodic boundary conditions also imply that the net circulation over the domain should be zero (Pradeep & Hussain Reference Pradeep and Hussain2004; Otheguy, Chomaz & Billant Reference Otheguy, Chomaz and Billant2006). Since a single vortex with a non-zero circulation
 $\unicode[STIX]{x1D6E4}$ is simulated here, a small background uniform vertical vorticity
 $-\unicode[STIX]{x1D6E4}/(l_{x}l_{y})$ is therefore artificially present.
Although these two artefacts could be suppressed by implementing the method proposed by Rennich & Lele (Reference Rennich and Lele1997), we have chosen to minimize them by simply taking a large box. Several tests with larger boxes (Bonnici Reference Bonnici2018) have shown that setting  $l_{x}=l_{y}=18$ gives results almost independent of the box size while being not too computationally expensive. The vertical size is set to
 $l_{z}=2\unicode[STIX]{x03C0}/k_{z}$, so that a single wavelength of the shear flow is simulated.
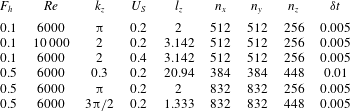
Overview of the physical and numerical parameters of some typical simulations. For all simulations, the horizontal dimensions of the domain are  $l_{x}=l_{y}=18$.

Table 1 lists the parameters of some typical simulations. The number of grid points in the  $x$ and
 $y$ directions have been varied from
 $n_{x}=n_{y}=384$ to
 $n_{x}=n_{y}=832$ depending on the values of the Reynolds and Froude numbers. The number of grid points in the vertical direction ranges from
 $n_{z}=256$ to
 $n_{z}=448$ depending on the values of
 $k_{z}$,
 $Re$ and
 $F_{h}$. Typically, a high resolution is required for the parameters where the shear instability develops because it generates small billows while a moderate resolution is sufficient for the other cases. When
 $k_{z}$ increases, the horizontal and vertical resolutions have to be increased also since the vertical gradients are larger. The accuracy of the results has been checked by increasing the resolution or the domain horizontal sizes in several runs. The time step varies from
 $\unicode[STIX]{x1D6FF}t=0.0025$ to
 $\unicode[STIX]{x1D6FF}t=0.01$. All the numerical simulations have been carried out for
 $Sc=1$. The Froude number has been always kept below unity so as to remain in the strongly stratified regime. The shear amplitude
 $U_{S}$ is also always kept below unity, meaning that the vortex is stronger than the shear flow. The vertical wavenumber has been varied in the range
 $0.1\leqslant k_{z}\leqslant 2\unicode[STIX]{x03C0}$. The Reynolds number has been varied from
 $Re=3000$ to
 $Re=10\,000$.
3 Overview of the dynamics
3.1 Qualitative description
We first begin by a description of two different simulations in order to give an overview of the flow dynamics.
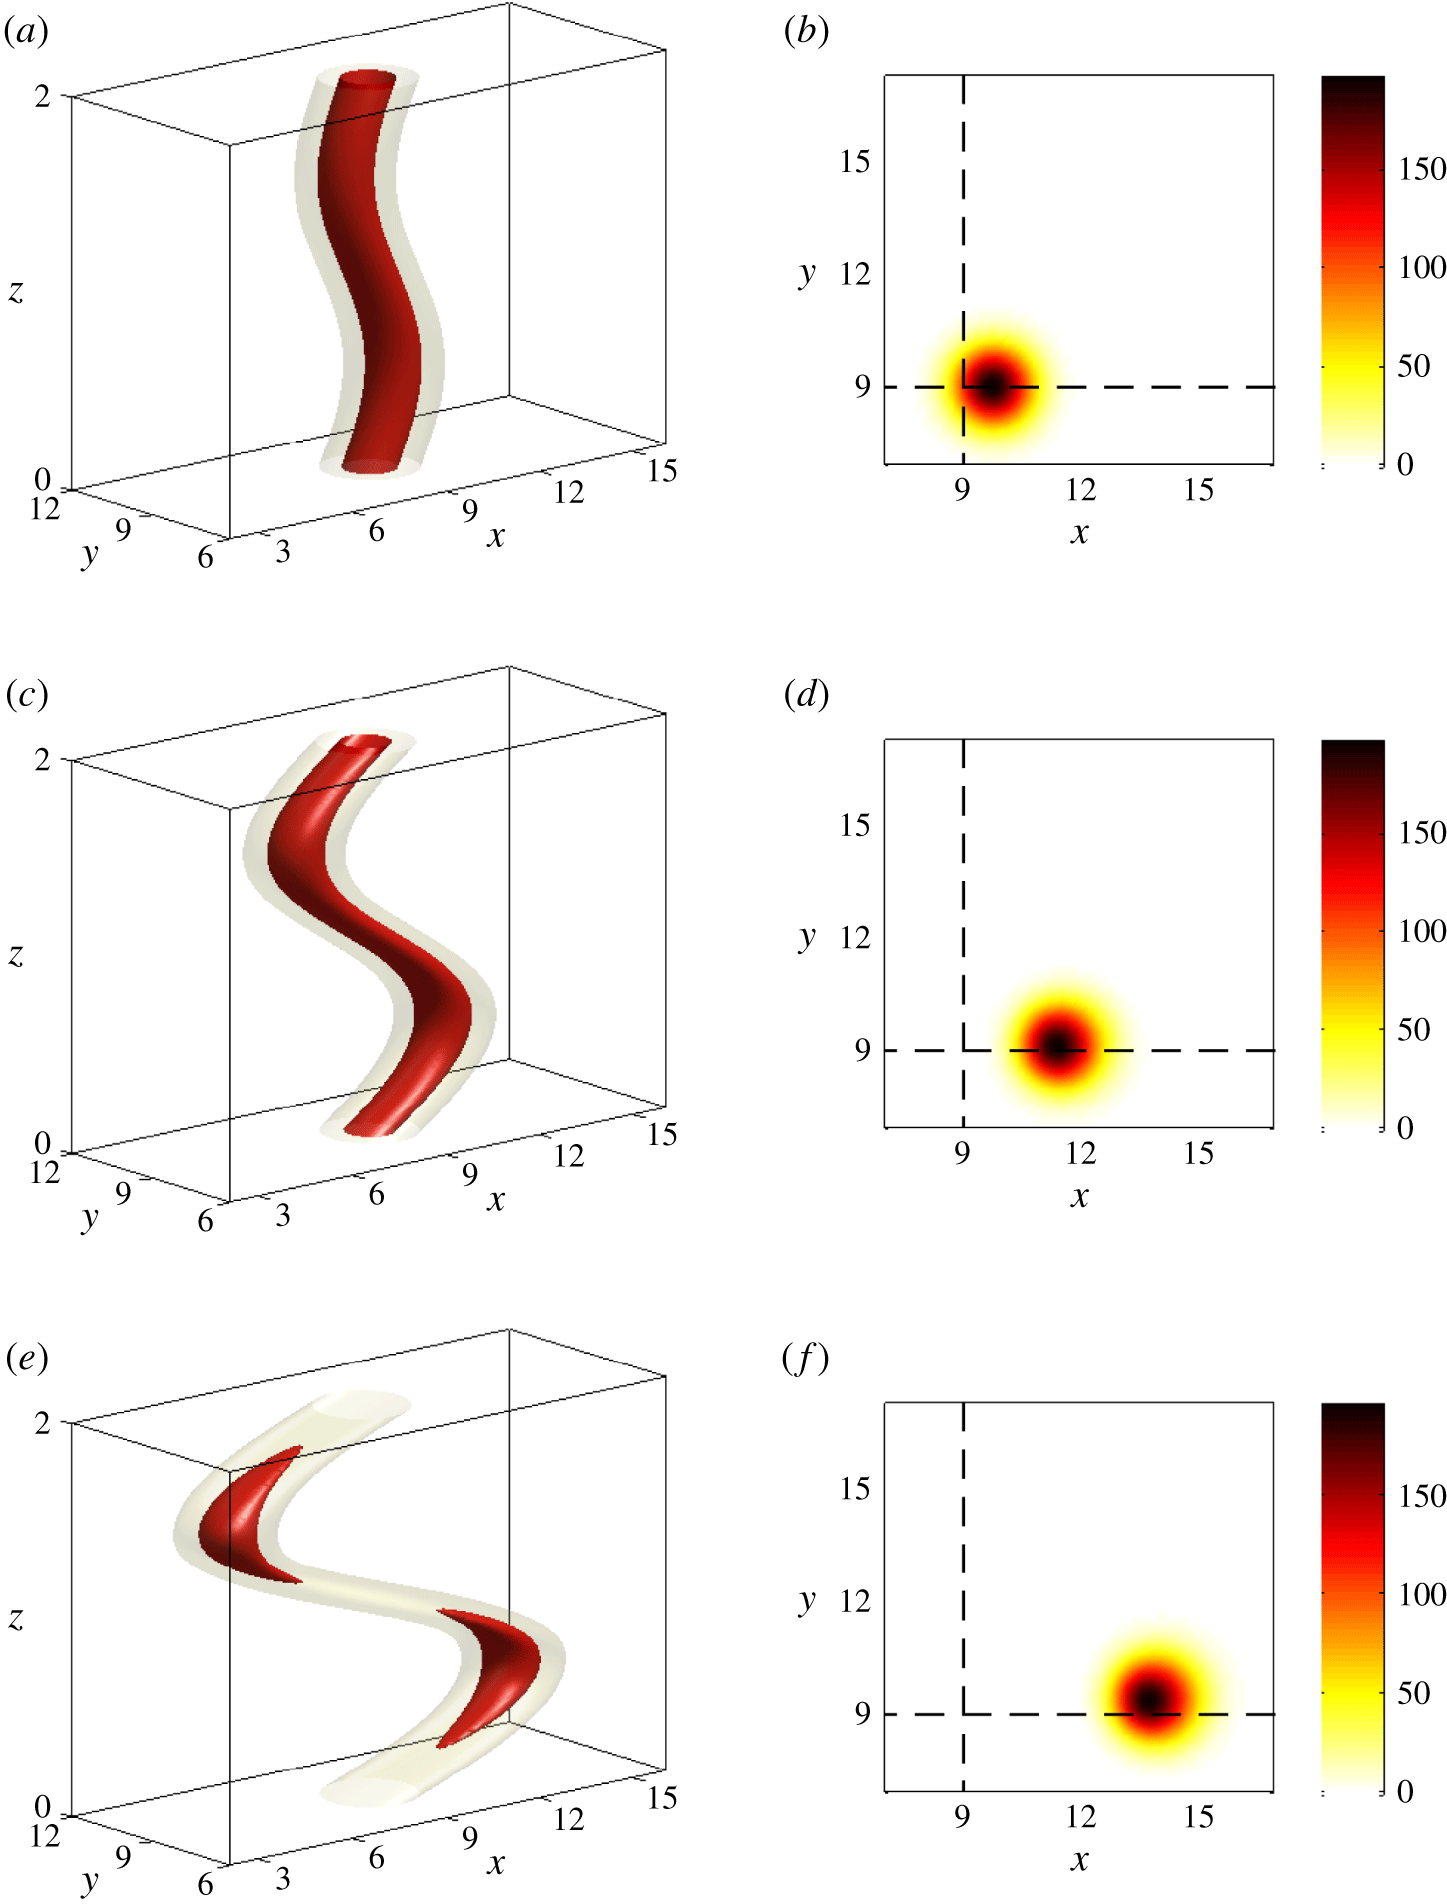
(a,c,e) Three-dimensional contours of the potential vorticity at different times for  $F_{h}=0.1$,
 $k_{z}=\unicode[STIX]{x03C0}$,
 $U_{S}=0.2$ and
 $Re=6000$. (b,d,f) Corresponding horizontal cross-sections in the plane
 $z=l_{z}/4$ where the advection is the most intense. The times shown are (a,b)
 $t=4$, (c,d)
 $t=13$, (e,f)
 $t=26$. In (a,c,e), the isocontours correspond to 20 % (light grey or yellow) and 60 % (dark grey or red) of the initial maximum value.

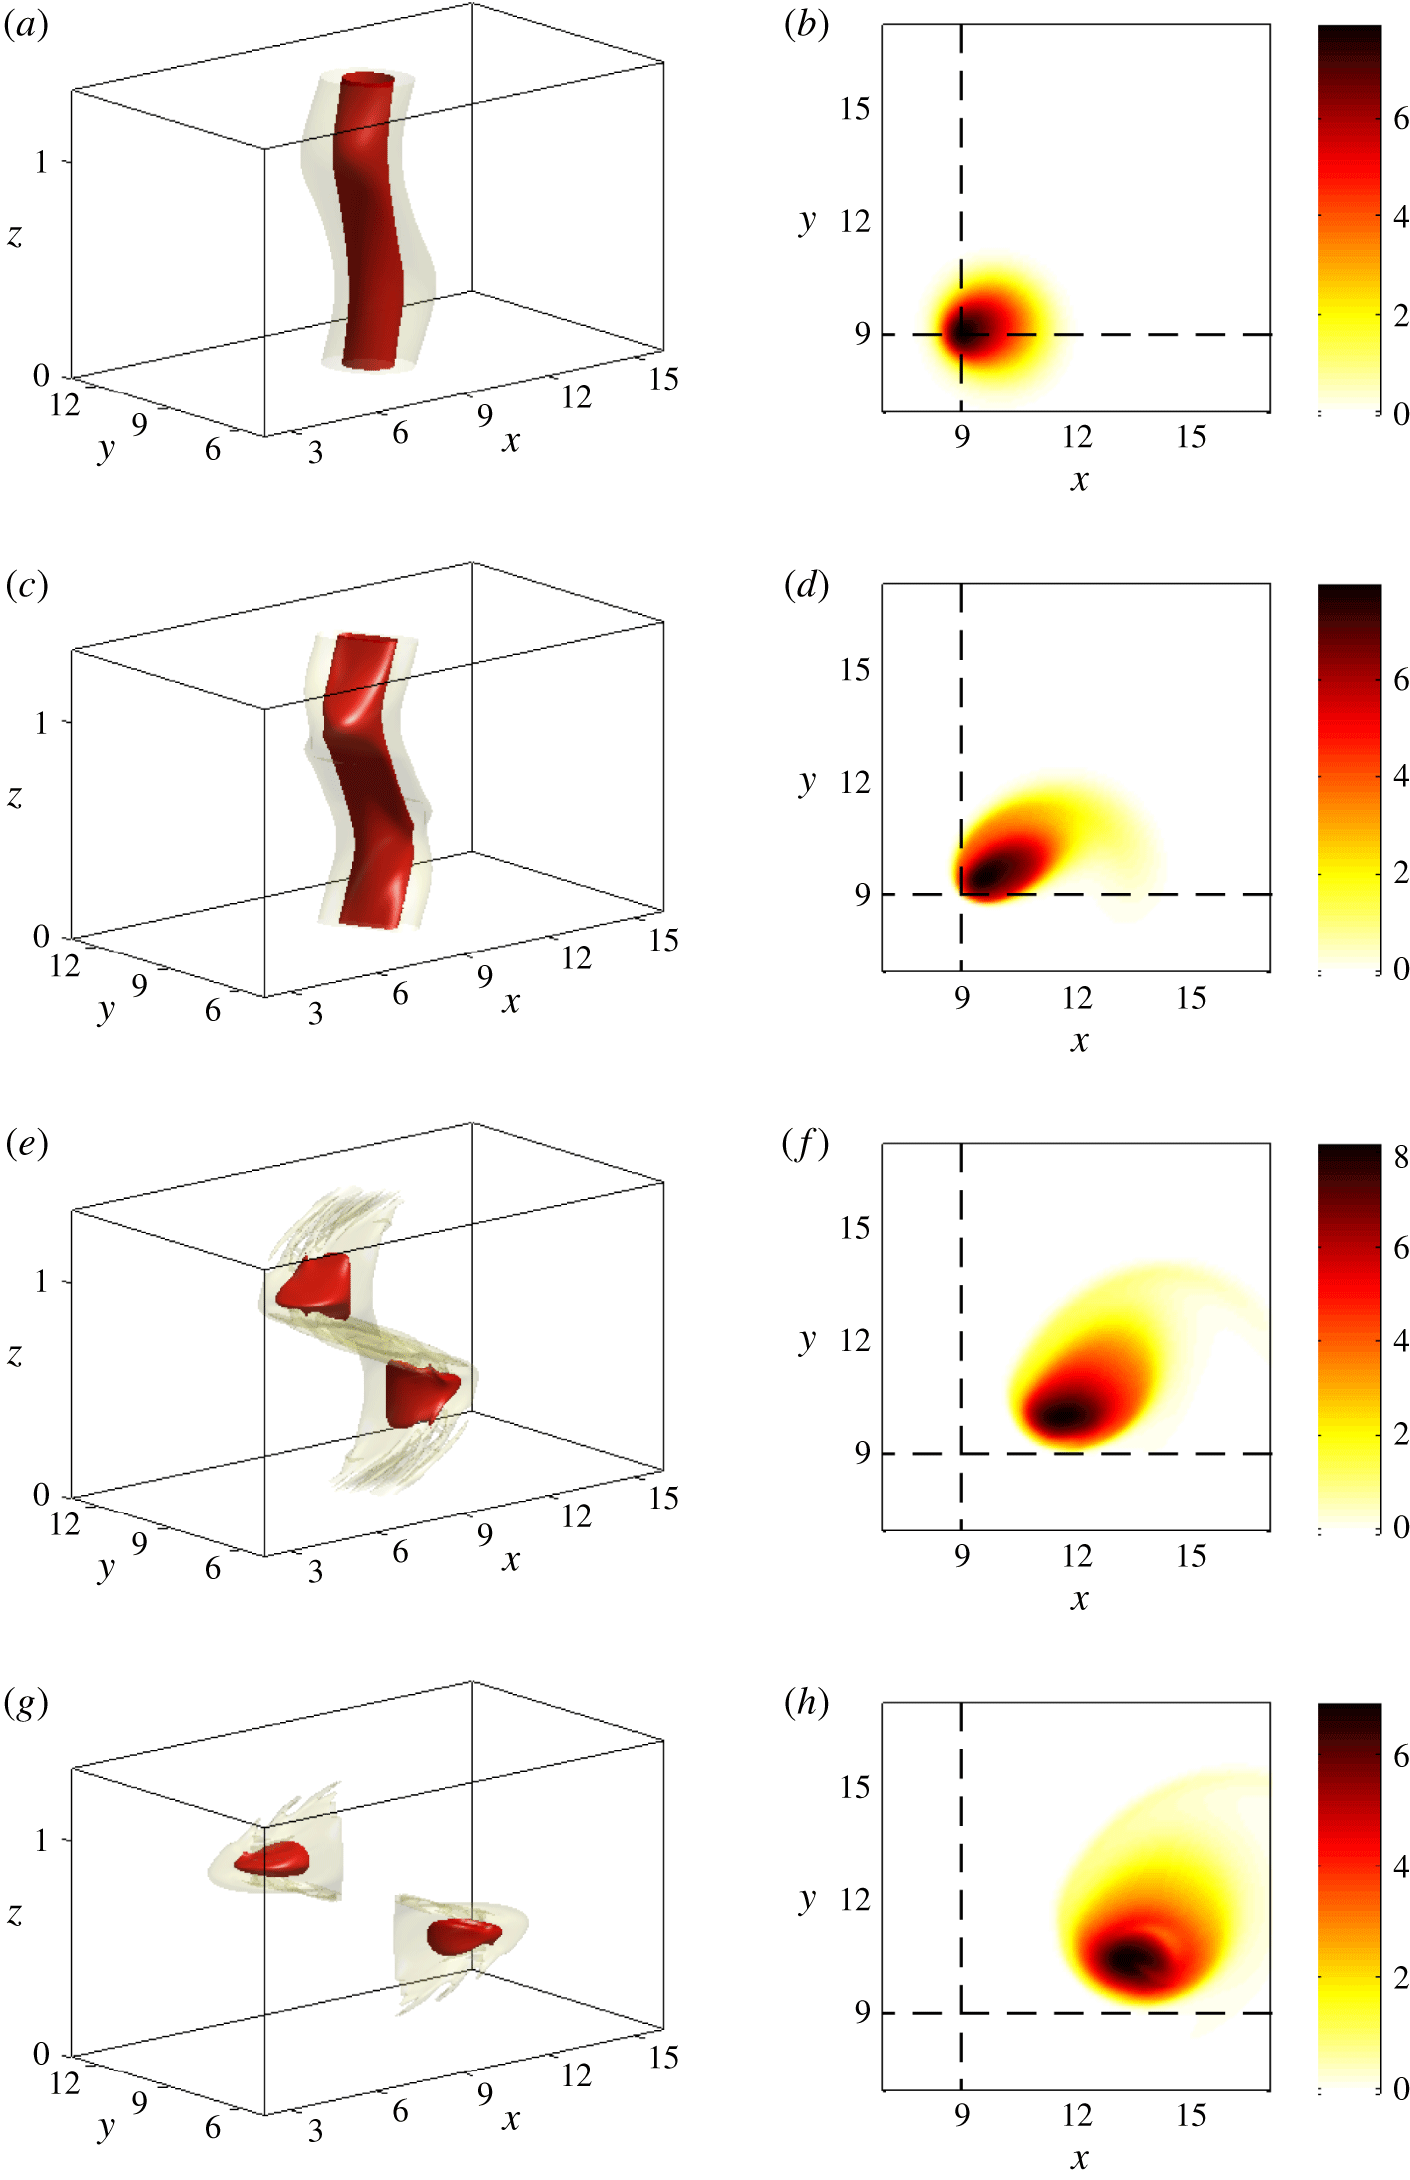
Same as figure 1 except that  $F_{h}=0.5$,
 $k_{z}=3\unicode[STIX]{x03C0}/2$. The times shown are (a,b)
 $t=4$, (c,d)
 $t=13$, (e,f)
 $t=26$, (g,h)
 $t=36$.

Figures 1 and 2 display the potential vorticity  $\unicode[STIX]{x1D6F1}=\unicode[STIX]{x1D74E}\boldsymbol{\cdot }[\unicode[STIX]{x1D735}b+1/F_{h}^{2}\boldsymbol{e}_{\boldsymbol{z}}]$, where
 $\unicode[STIX]{x1D74E}$ is the vorticity and
 $b$ the buoyancy, at different times for
 $k_{z}=\unicode[STIX]{x03C0}$,
 $F_{h}=0.1$ and
 $k_{z}=3\unicode[STIX]{x03C0}/2$,
 $F_{h}=0.5$, respectively, whereas
 $U_{S}$ and
 $Re$ are fixed to
 $U_{S}=0.2$ and
 $Re=6000$. The first column shows three-dimensional contours while the second column represents a corresponding horizontal cross-section at the vertical level
 $z=l_{z}/4$. The vortex is mostly displaced in the direction of the shear flow, but also slightly in the perpendicular direction as seen in the horizontal cross-sections. Hence, the vertical plane containing the vortex axis is actually oblique relative to the
 $(x,z)$ plane. The displacement in the
 $y$ direction is weaker in figure 1 than in figure 2.
A common feature of both simulations is that the potential vorticity decreases faster in the regions of high shear  $z=0,l_{z}/2$ than in the regions of weak shear
 $z=l_{z}/4,3l_{z}/4$ (figures 1e, 2e,g). Thus, the vortex seems to be torn apart into two separate pancake vortices at large times.
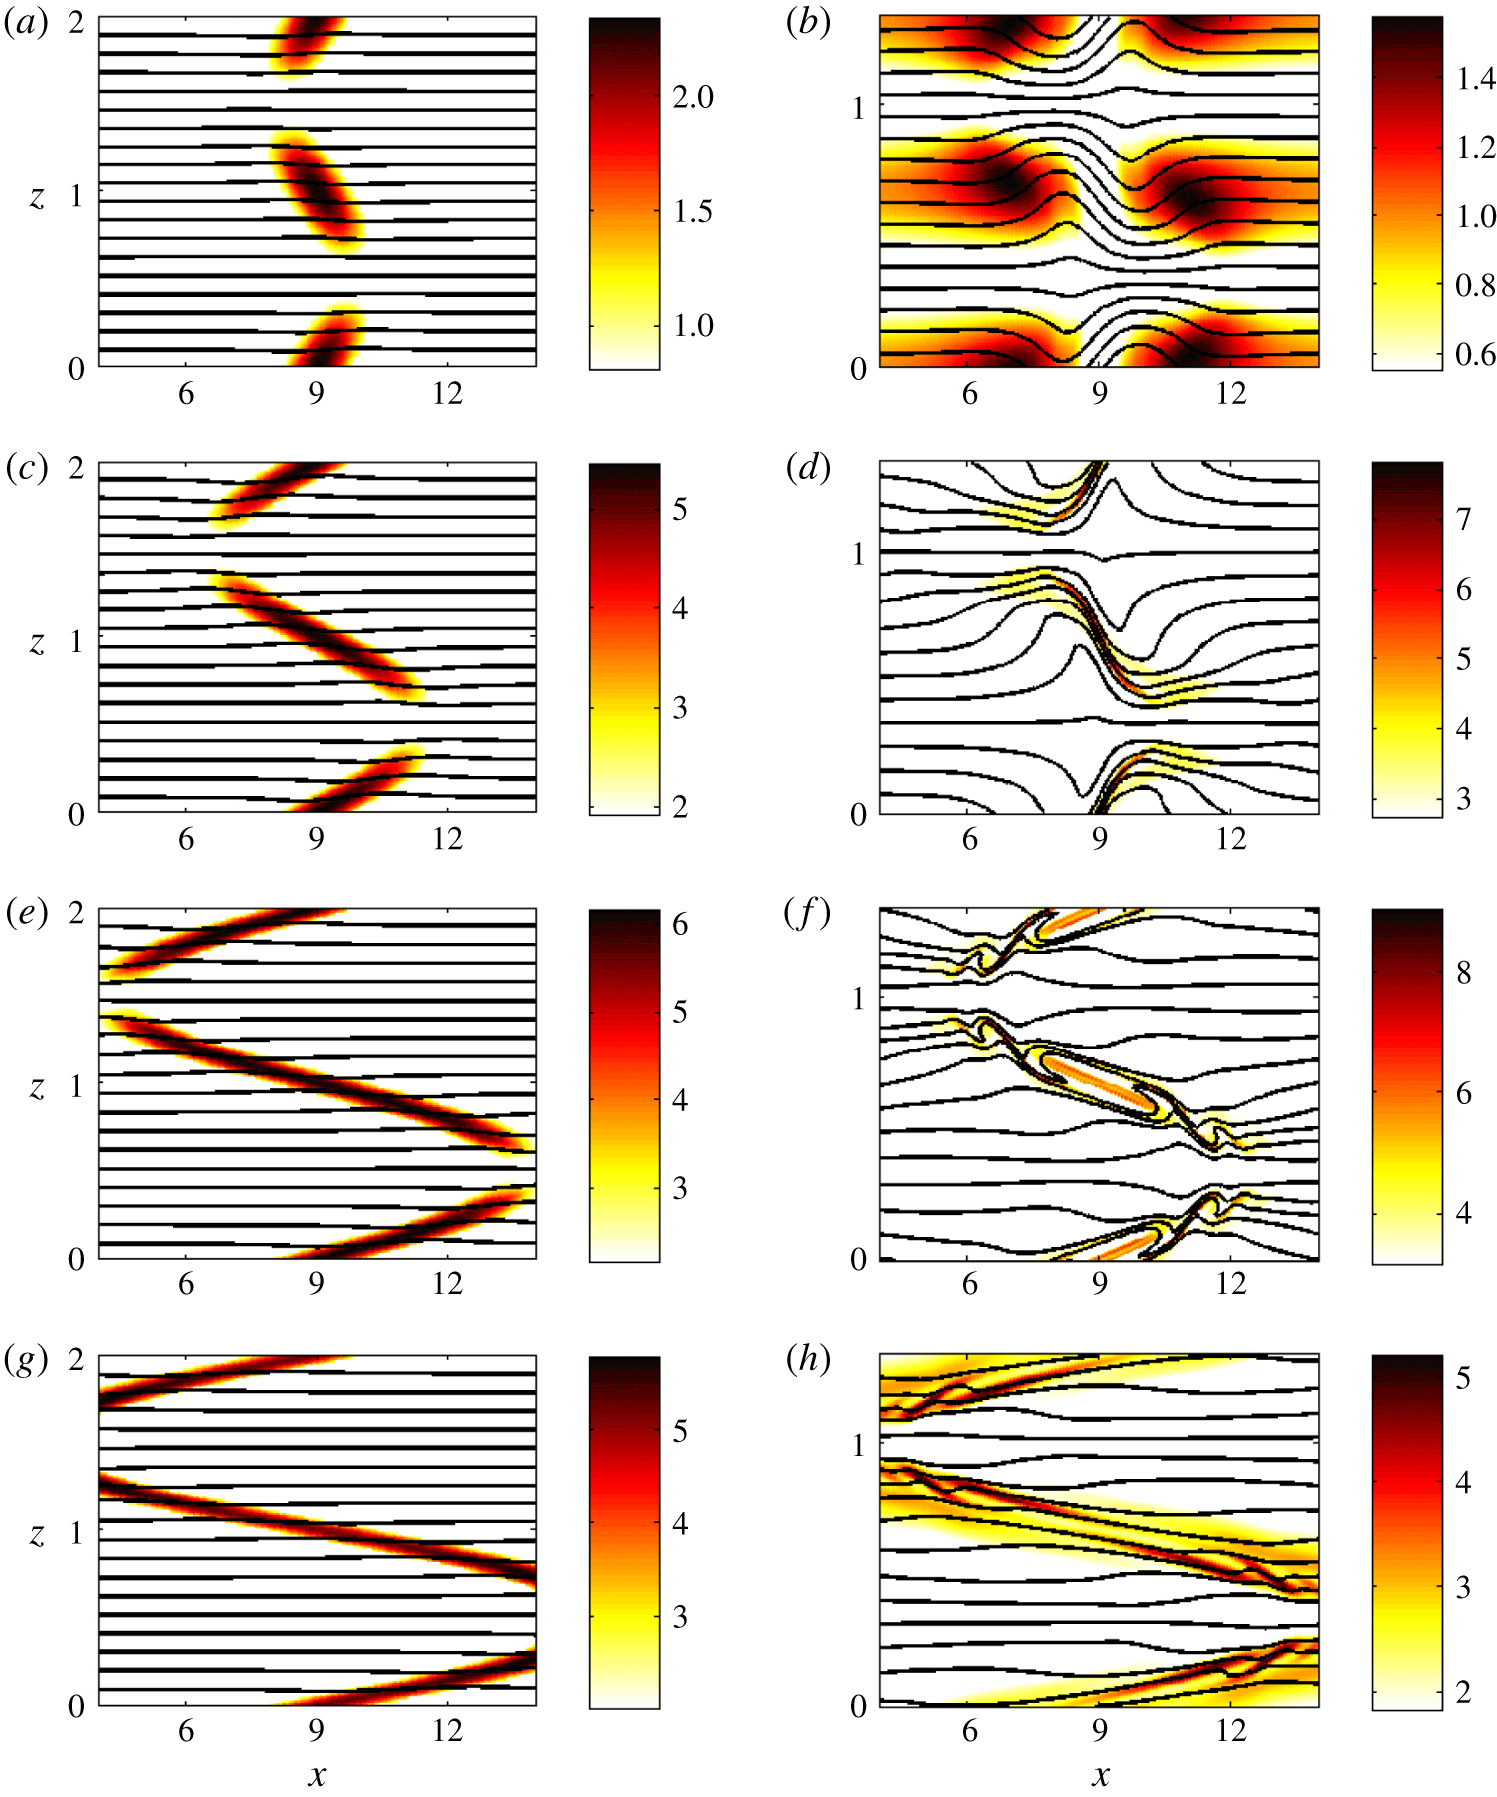
Vertical cross-sections of the shear  $\sqrt{S_{z}}$ (colour) and of the total density
 $\unicode[STIX]{x1D70C}_{t}$ (black contour lines) in the plane
 $y=9$, for
 $F_{h}=0.1$,
 $k_{z}=\unicode[STIX]{x03C0}$ (a,c,e,g) and
 $F_{h}=0.5$,
 $k_{z}=3\unicode[STIX]{x03C0}/2$ (b,d,f,h), for
 $U_{S}=0.2$ and
 $Re=6000$. The times shown are (a,b)
 $t=4$, (c,d)
 $t=13$, (e,f)
 $t=26$, (g,h)
 $t=36$.

Figure 3 displays the corresponding total vertical shear of the horizontal velocity  $\sqrt{S_{z}}=\sqrt{(\unicode[STIX]{x2202}u/\unicode[STIX]{x2202}z)^{2}+(\unicode[STIX]{x2202}v/\unicode[STIX]{x2202}z)^{2}}$ (colour) in the vertical cross-section at
 $y=9$, i.e. passing through the vortex centre at
 $t=0$. The superimposed black lines show the total density
 $\unicode[STIX]{x1D70C}_{t}=-(\unicode[STIX]{x1D70C}_{0}/g)(b+z/F_{h}^{2})$, where
 $\unicode[STIX]{x1D70C}_{0}$ is the reference density and
 $g$ the gravity. For
 $k_{z}=\unicode[STIX]{x03C0}$,
 $F_{h}=0.1$ (figure 3a,c,e,g), the shear is maximum in the vortex core at the point
 $x_{c}=9$,
 $z_{c}=0,l_{z}/2$ (note that these coordinates correspond to those of the computational domain where the vortex centre is initially in the middle
 $x=9$,
 $y=9$). As the vortex is progressively bent,
 $\sqrt{S_{z}}$ grows monotonically with time and becomes rapidly much higher than the maximum ambient shear
 $\max (\sqrt{\bar{S}_{z}})=k_{z}U_{S}\simeq 0.6$ (figure 3a,c,e,g). The iso-density lines remain nearly flat since the stratification is strong for this case.
Figure 4(a) shows that the minimum of the Richardson number (black solid line)
 $$\begin{eqnarray}Ri={\displaystyle \frac{{\displaystyle \frac{1}{F_{h}^{2}}}+{\displaystyle \frac{\unicode[STIX]{x2202}b}{\unicode[STIX]{x2202}z}}}{S_{z}}}\end{eqnarray}$$
decreases with time from  $\min (Ri)=1/(F_{h}k_{z}U_{S})^{2}=253$ at
 $t=0$ down to
 $\min (Ri)=3.7$ at
 $t=22$ and then slowly re-increases. The quantity
 $\min (Ri)$ thus remains well above the critical value
 $1/4$ necessary for the development of the shear instability of a steady parallel inviscid shear flow (Miles Reference Miles1961; Howard Reference Howard1961).
For  $k_{z}=3\unicode[STIX]{x03C0}/2$,
 $F_{h}=0.5$ (figure 3b,d,f,h), the growth of the maximum shear
 $\sqrt{S_{z}}$ is not monotonic. There is a first stage where the shear is very weak within the vortex core (see figure 3b at
 $t=4$), i.e. the response of the vortex tends to cancel the ambient shear. Then, the vortex becomes tilted as for
 $k_{z}=\unicode[STIX]{x03C0}$,
 $F_{h}=0.1$, and the maximum shear is encountered in the vicinity of
 $x_{c}=9$,
 $z_{c}=0,l_{z}/2$ (figure 3d) with values approximately ten times larger than the ambient maximum shear
 $\max (\sqrt{\bar{S}_{z}})\simeq 0.9$. The regions of high shear are remarkably thin. Later on, the flow strongly dissipates in these regions and the shear becomes maximum at points away from
 $(x_{c},z_{c})$ (figure 3f,h). During this evolution, the iso-density lines are strongly deformed in contrast to
 $k_{z}=\unicode[STIX]{x03C0}$,
 $F_{h}=0.1$. Some overturns can even be seen at some locations at
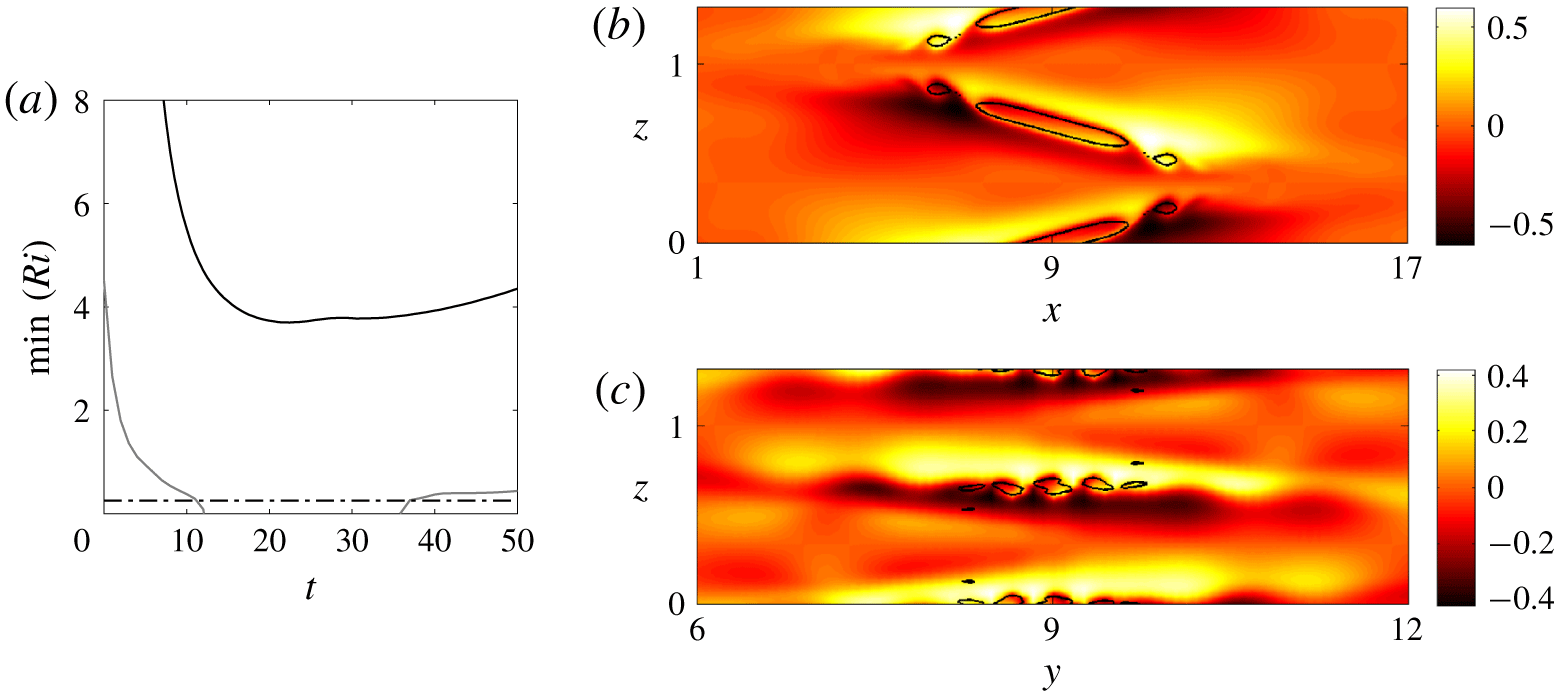
 $t=26$ (figure 3f). As seen in figure 4(a), the minimum Richardson number for this simulation (grey solid line) decreases from
 $\min (Ri)=1/(F_{h}h_{z}U_{S})^{2}=4.5$ at
 $t=0$ to a value below
 $Ri_{c}=0.25$ for
 $11\leqslant t\leqslant 37$. The
 $(y,z)$ cross-section at
 $x=9$ of the buoyancy at
 $t=26$ (figure 4c) confirms the presence of Kelvin–Helmholtz billows near
 $z_{c}=0,l_{z}/2$. In contrast, no billows can be seen in these regions in the corresponding
 $(x,z)$ cross-section at
 $y=9$ (figure 4b). This means that the axes of the Kelvin–Helmholtz billows are mostly oriented in the
 $x$ direction, i.e. they are parallel to the direction of the ambient shear flow. The black contours in figure 4 delineate the regions where
 $Ri<0.25$. In addition to the unstable regions near
 $(x_{c},z_{c})$, there exist also other unstable regions above and below each pancake vortex at
 $z=l_{z}/4$ and
 $z=3l_{z}/4$ as seen in the
 $(x,z)$ cross-section (figure 4b). We can also see some billows and overturns in these regions (figures 4b and 3f) but in this case, their axes are perpendicular to the direction of the ambient shear. When they occur, these unstable regions appear only in a second stage after those near
 $(x_{c},z_{c})$.
(a) Minimum Richardson number as a function of time for  $U_{S}=0.2$,
 $Re=6000$ and
 $F_{h}=0.1$,
 $k_{z}=\unicode[STIX]{x03C0}$ (black solid line) and
 $F_{h}=0.5$,
 $k_{z}=3\unicode[STIX]{x03C0}/2$ (grey solid line) from the DNS. The horizontal black dash-dotted line shows the critical value
 $Ri=0.25$. (b,c) Vertical cross-sections of the buoyancy
 $b$ at
 $t=26$ in the planes
 $y=9$ (b) and
 $x=9$ (c) for
 $F_{h}=0.5$,
 $k_{z}=3\unicode[STIX]{x03C0}/2$,
 $U_{S}=0.2$ and
 $Re=6000$. The black contours represent the lines where
 $Ri=0.25$.

3.2 Time evolution of the vertical shear at the centre
For  $k_{z}=\unicode[STIX]{x03C0}$,
 $F_{h}=0.1$, the Richardson number is always minimum at the centre point
 $(x_{c}=9,y_{c}=9,z_{c}=l_{z}/2)$ and at the symmetric point
 $(x_{c}=9,y_{c}=9,z_{c}=0)$. For
 $k_{z}=3\unicode[STIX]{x03C0}/2$,
 $F_{h}=0.5$, the Kelvin–Helmholtz instability also develops first at these points. It is therefore interesting to investigate the evolution of the vertical shear at these locations.
To this end, we first decompose the flow into a mean flow varying only along the vertical and with time  $\bar{\boldsymbol{u}}(z,t)$ and a complementary flow
 $\boldsymbol{u}^{\ast }$
 $$\begin{eqnarray}\boldsymbol{u}=\bar{\boldsymbol{u}}+\boldsymbol{u}^{\ast },\end{eqnarray}$$
where the overbar denotes the horizontal average over the computational domain, which for any quantity  $q$ is defined as
 $$\begin{eqnarray}\bar{q}=\frac{1}{l_{x}l_{y}}\int _{0}^{l_{y}}\int _{0}^{l_{x}}q(x,y,z,t)\,\text{d}x\,\text{d}y.\end{eqnarray}$$
At  $t=0$, we have
 $\bar{\boldsymbol{u}}=\boldsymbol{U}_{S}$ and
 $\boldsymbol{u}^{\ast }=\boldsymbol{u}_{v}$ so that
 $\bar{\boldsymbol{u}}$ and
 $\boldsymbol{u}^{\ast }$ will be called ‘shear flow’ and ‘vortex flow’, respectively.
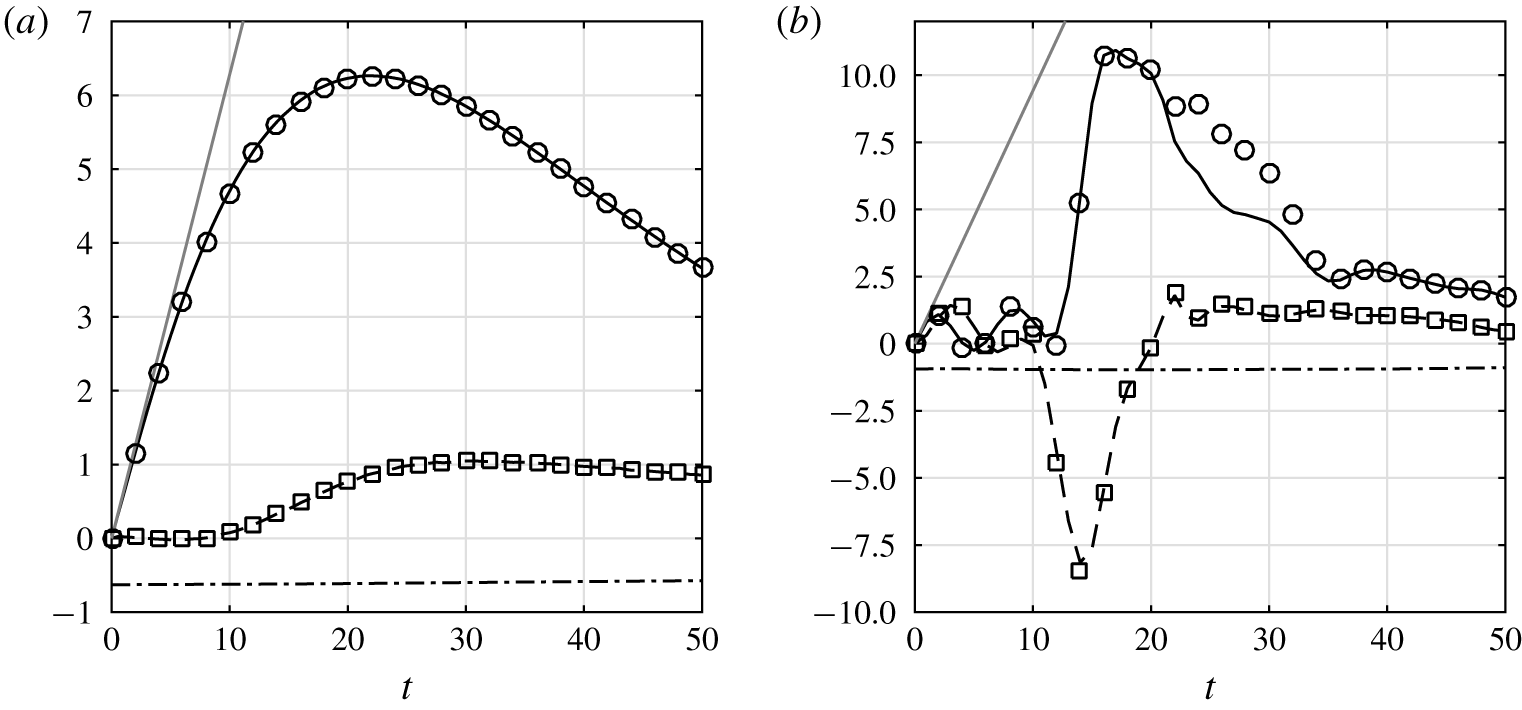
Time evolution of  $\unicode[STIX]{x2202}\bar{u}/\unicode[STIX]{x2202}z$ (black dash-dotted lines),
 $\unicode[STIX]{x2202}u^{\ast }/\unicode[STIX]{x2202}z$ (black dashed lines) and
 $\unicode[STIX]{x2202}v^{\ast }/\unicode[STIX]{x2202}z$ (black solid lines) at the vortex centre
 $x_{c}=9$,
 $y_{c}=9$,
 $z_{c}=l_{z}/2$ for (a)
 $F_{h}=0.1$,
 $k_{z}=\unicode[STIX]{x03C0}$, and (b)
 $F_{h}=0.5$,
 $k_{z}=3\unicode[STIX]{x03C0}/2$ for
 $U_{S}=0.2$ and
 $Re=6000$. The straight grey lines represent the relation
 $k_{z}U_{S}t$. The symbols show the horizontal vorticity components
 $-\unicode[STIX]{x1D714}_{x}^{\ast }$ (circles) and
 $\unicode[STIX]{x1D714}_{y}^{\ast }$ (squares).

Figure 5(a) shows the evolution of the different shear components  $\unicode[STIX]{x2202}\bar{u}/\unicode[STIX]{x2202}z$,
 $\unicode[STIX]{x2202}u^{\ast }/\unicode[STIX]{x2202}z$ and
 $\unicode[STIX]{x2202}v^{\ast }/\unicode[STIX]{x2202}z$ at the centre
 $(x_{c}=9,y_{c}=9,z_{c}=l_{z}/2)$ for
 $F_{h}=0.1$,
 $k_{z}=\unicode[STIX]{x03C0}$,
 $U_{S}=0.2$ and
 $Re=6000$. The quantity
 $\unicode[STIX]{x2202}\bar{v}/\unicode[STIX]{x2202}z$ is always equal to zero at the centre and is not plotted. More generally,
 $\unicode[STIX]{x2202}\bar{v}/\unicode[STIX]{x2202}z$ always remains very small at any vertical position compared to
 $\unicode[STIX]{x2202}\bar{u}/\unicode[STIX]{x2202}z$. We see that the mean shear
 $\unicode[STIX]{x2202}\bar{u}/\unicode[STIX]{x2202}z$ (dash-dotted line) remains almost constant and equal to
 $-k_{z}U_{S}=-0.63$. In contrast, the shear component
 $\unicode[STIX]{x2202}v^{\ast }/\unicode[STIX]{x2202}z$ (solid line) grows first linearly and then saturates at
 $t\simeq 22$ at the value
 $\unicode[STIX]{x2202}v^{\ast }/\unicode[STIX]{x2202}z=6.3$, i.e. ten times the ambient shear
 $|\unicode[STIX]{x2202}\bar{u}/\unicode[STIX]{x2202}z|$. The other component
 $\unicode[STIX]{x2202}u^{\ast }/\unicode[STIX]{x2202}z$ remains very weak up to
 $t=10$ and then increases up to
 $\unicode[STIX]{x2202}u^{\ast }/\unicode[STIX]{x2202}z\simeq 1$ at
 $t=30$. This quantity therefore saturates at a lower value and later than its counterpart
 $\unicode[STIX]{x2202}v^{\ast }/\unicode[STIX]{x2202}z$.
The initial behaviour of the vertical shear of the vortex  $\unicode[STIX]{x2202}u^{\ast }/\unicode[STIX]{x2202}z$ and
 $\unicode[STIX]{x2202}v^{\ast }/\unicode[STIX]{x2202}z$ can be simply understood by considering that the vortex is displaced at the velocity
 $U(z)$ in the
 $x$ direction, i.e.
 $\boldsymbol{u}_{v}(x-Ut,y)$, as assumed by Lilly (Reference Lilly1983). This gives
 $$\begin{eqnarray}\frac{\unicode[STIX]{x2202}\boldsymbol{u}_{v}}{\unicode[STIX]{x2202}z}=-\frac{\text{d}U}{\text{d}z}t\frac{\unicode[STIX]{x2202}\boldsymbol{u}_{v}}{\unicode[STIX]{x2202}x}.\end{eqnarray}$$
Since  $\boldsymbol{u}_{v}=(-\unicode[STIX]{x1D6FA}y,\unicode[STIX]{x1D6FA}x)$, where
 $\unicode[STIX]{x1D6FA}(r)$ is the angular velocity of the vortex, we have
 $\unicode[STIX]{x2202}v_{v}/\unicode[STIX]{x2202}x=\unicode[STIX]{x1D6FA}=1$ and
 $\unicode[STIX]{x2202}u_{v}/\unicode[STIX]{x2202}x=0$ at the centre
 $r=0$. Thus, (3.4) yields
 $$\begin{eqnarray}\frac{\unicode[STIX]{x2202}u_{v}}{\unicode[STIX]{x2202}z}=0,\quad \frac{\unicode[STIX]{x2202}v_{v}}{\unicode[STIX]{x2202}z}=k_{z}U_{S}t,\end{eqnarray}$$
at  $z=l_{z}/2$. The straight grey line in figure 5(a) confirms that
 $\unicode[STIX]{x2202}v^{\ast }/\unicode[STIX]{x2202}z$ increases initially at the rate
 $k_{z}U_{S}t$. This also explains why
 $\unicode[STIX]{x2202}u^{\ast }/\unicode[STIX]{x2202}z$ remains very small initially. The subsequent evolutions will be explained later thanks to the asymptotic analysis performed in Part
 $1$.
In figure 5(a), we have also plotted with symbols the horizontal vorticity components  $-\unicode[STIX]{x1D714}_{x}^{\ast }$ and
 $\unicode[STIX]{x1D714}_{y}^{\ast }$ where
 $\unicode[STIX]{x1D74E}^{\ast }=\unicode[STIX]{x1D735}\times \boldsymbol{u}^{\ast }$. They are nearly superposed to
 $\unicode[STIX]{x2202}v^{\ast }/\unicode[STIX]{x2202}z$ and
 $\unicode[STIX]{x2202}u^{\ast }/\unicode[STIX]{x2202}z$, respectively, because the vertical velocity is very small compared with the horizontal velocity. In other words,
 $\unicode[STIX]{x1D714}_{x}^{\ast }\simeq -\unicode[STIX]{x2202}v^{\ast }/\unicode[STIX]{x2202}z$ and
 $\unicode[STIX]{x1D714}_{y}^{\ast }\simeq \unicode[STIX]{x2202}u^{\ast }/\unicode[STIX]{x2202}z$.
Similarly, figure 5(b) displays the time evolution of  $\unicode[STIX]{x2202}\bar{u}/\unicode[STIX]{x2202}z$,
 $\unicode[STIX]{x2202}u^{\ast }/\unicode[STIX]{x2202}z$ and
 $\unicode[STIX]{x2202}v^{\ast }/\unicode[STIX]{x2202}z$ at the centre point for
 $F_{h}=0.5$ and
 $k_{z}=3\unicode[STIX]{x03C0}/2$, still for
 $U_{S}=0.2$ and
 $Re=6000$. In contrast to the case
 $F_{h}=0.1$,
 $k_{z}=\unicode[STIX]{x03C0}$ (figure 5a),
 $\unicode[STIX]{x2202}v^{\ast }/\unicode[STIX]{x2202}z$ follows the relation (3.5) only at the very beginning
 $t\lesssim 2$. Instead, both shear components
 $\unicode[STIX]{x2202}u^{\ast }/\unicode[STIX]{x2202}z$ and
 $\unicode[STIX]{x2202}v^{\ast }/\unicode[STIX]{x2202}z$ first oscillate with a phase lag and with a period around
 $2\unicode[STIX]{x03C0}$, i.e. the period corresponding to the angular velocity on the vortex axis
 $\unicode[STIX]{x1D6FA}=1$. Because of these oscillations, we can notice that
 $\unicode[STIX]{x2202}v^{\ast }/\unicode[STIX]{x2202}z$ goes back to zero around
 $t\simeq 4{-}5$ while
 $\unicode[STIX]{x2202}u^{\ast }/\unicode[STIX]{x2202}z$ is approximately opposite to
 $\unicode[STIX]{x2202}\bar{u}/\unicode[STIX]{x2202}z$. Thus, the total shear
 $S_{z}$ is weak at the centre as already observed in figure 3(b) at
 $t=4$.
Then,  $\unicode[STIX]{x2202}u^{\ast }/\unicode[STIX]{x2202}z$ and
 $\unicode[STIX]{x2202}v^{\ast }/\unicode[STIX]{x2202}z$ are both abruptly amplified up to an absolute value around
 $10$. Remarkably,
 $\unicode[STIX]{x2202}u^{\ast }/\unicode[STIX]{x2202}z$ becomes now negative and saturates earlier than
 $\unicode[STIX]{x2202}v^{\ast }/\unicode[STIX]{x2202}z$. Later on,
 $|\unicode[STIX]{x2202}u^{\ast }/\unicode[STIX]{x2202}z|$ decreases very quickly while
 $|\unicode[STIX]{x2202}v^{\ast }/\unicode[STIX]{x2202}z|$ decays more slowly. The vorticity components
 $-\unicode[STIX]{x1D714}_{x}^{\ast }$ and
 $\unicode[STIX]{x1D714}_{y}^{\ast }$ have been also plotted in figure 5(b). They are again almost identical to
 $\unicode[STIX]{x2202}v^{\ast }/\unicode[STIX]{x2202}z$ and
 $\unicode[STIX]{x2202}u^{\ast }/\unicode[STIX]{x2202}z$ except
 $-\unicode[STIX]{x1D714}_{x}^{\ast }$ for
 $21\leqslant t\leqslant 35$. This corresponds to the time interval when the Kelvin–Helmholtz billows exist. They produce a finite vertical velocity
 $w^{\ast }$, making the term
 $\unicode[STIX]{x2202}w^{\ast }/\unicode[STIX]{x2202}y$ in
 $\unicode[STIX]{x1D714}_{x}^{\ast }$ no longer negligible. In contrast, the term
 $\unicode[STIX]{x2202}w^{\ast }/\unicode[STIX]{x2202}x$ is still negligible in
 $\unicode[STIX]{x1D714}_{y}^{\ast }$, most probably because the axes of the Kelvin–Helmholtz billows are aligned with the
 $x$ direction.
3.3 Global energy and enstrophy evolutions
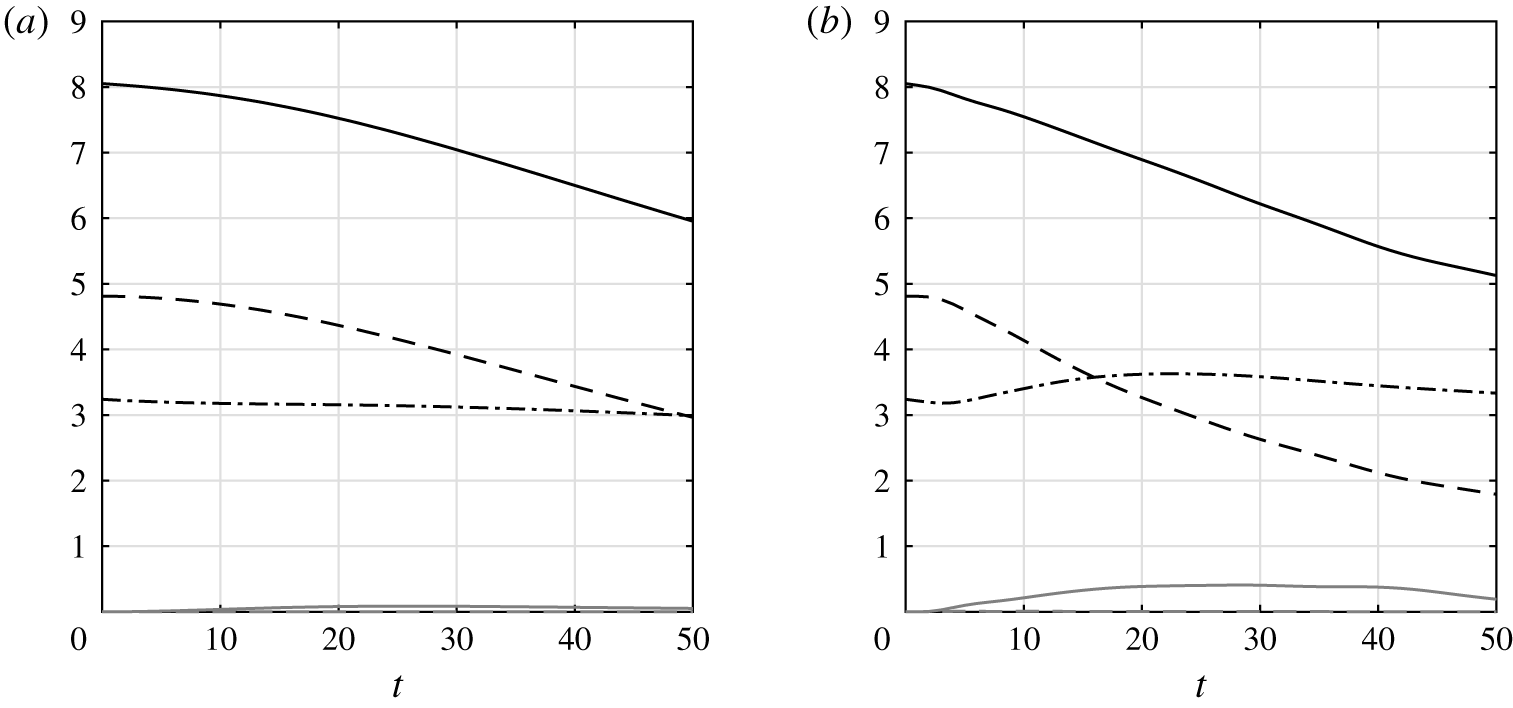
Time evolutions of the global kinetic energy  $\bar{E}_{k}+E_{kh}^{\ast }+E_{kz}^{\ast }$ (black solid line), the mean flow kinetic energy
 $\bar{E}_{k}$ (black dash-dotted line), the vortex horizontal kinetic energy
 $E_{kh}^{\ast }$ (black dashed line), the vortex vertical kinetic energy
 $E_{kz}^{\ast }$ (grey dashed line) and the potential energy
 $E_{p}$ (grey solid line) for (a)
 $F_{h}=0.1$,
 $k_{z}=\unicode[STIX]{x03C0}$ and (b)
 $F_{h}=0.5$,
 $k_{z}=3\unicode[STIX]{x03C0}/2$ for
 $U_{S}=0.2$,
 $Re=6000$.

Figure 6 presents the evolutions of the energies integrated over the whole computational domain for the two simulations for  $k_{z}=\unicode[STIX]{x03C0}$,
 $F_{h}=0.1$, and
 $k_{z}=3\unicode[STIX]{x03C0}/2$,
 $F_{h}=0.5$, previously described. The kinetic energies have been decomposed into a mean part and a vortex part using the decomposition (3.2)
 $$\begin{eqnarray}\bar{E}_{k}=\frac{1}{l_{z}}\int _{V}\frac{\bar{\boldsymbol{u}}^{2}}{2}\text{d}V,\quad E_{kh}^{\ast }=\frac{1}{l_{z}}\int _{V}\frac{{\boldsymbol{u}_{h}^{\ast }}^{2}}{2}\text{d}V,\quad E_{kz}^{\ast }=\frac{1}{l_{z}}\int _{V}\frac{{w^{\ast }}^{2}}{2}\text{d}V,\end{eqnarray}$$
where  $E_{kh}^{\ast }$ and
 $E_{kz}^{\ast }$ are the horizontal and vertical kinetic energies of the vortex part. The integral over the computational domain
 $V$ is divided by
 $l_{z}$ in order to enable the comparisons between simulations carried out with distinct vertical wavelengths (Note that we do not divide by
 $V$ in order to be able to compare simulations with different horizontal domain sizes). Similarly, the global potential energy per vertical length unit is
 $$\begin{eqnarray}E_{p}=\frac{1}{l_{z}}\int _{V}\frac{F_{h}^{2}b^{2}}{2}\text{d}V.\end{eqnarray}$$
The kinetic energy of the mean flow  $\bar{E}_{k}$ (black dash-dotted lines) remains approximately constant even if it increases slightly at the beginning for
 $k_{z}=3\unicode[STIX]{x03C0}/2$,
 $F_{h}=0.5$ (figure 6b). In contrast, the horizontal kinetic energy of the vortex
 $E_{kh}^{\ast }$ (black dashed lines) decreases regularly following an approximately linear trend. The vertical kinetic energy
 $E_{kz}^{\ast }$ (grey dashed lines) and the potential energy
 $E_{p}$ (grey solid lines) remain always very weak compared with the horizontal kinetic energy.
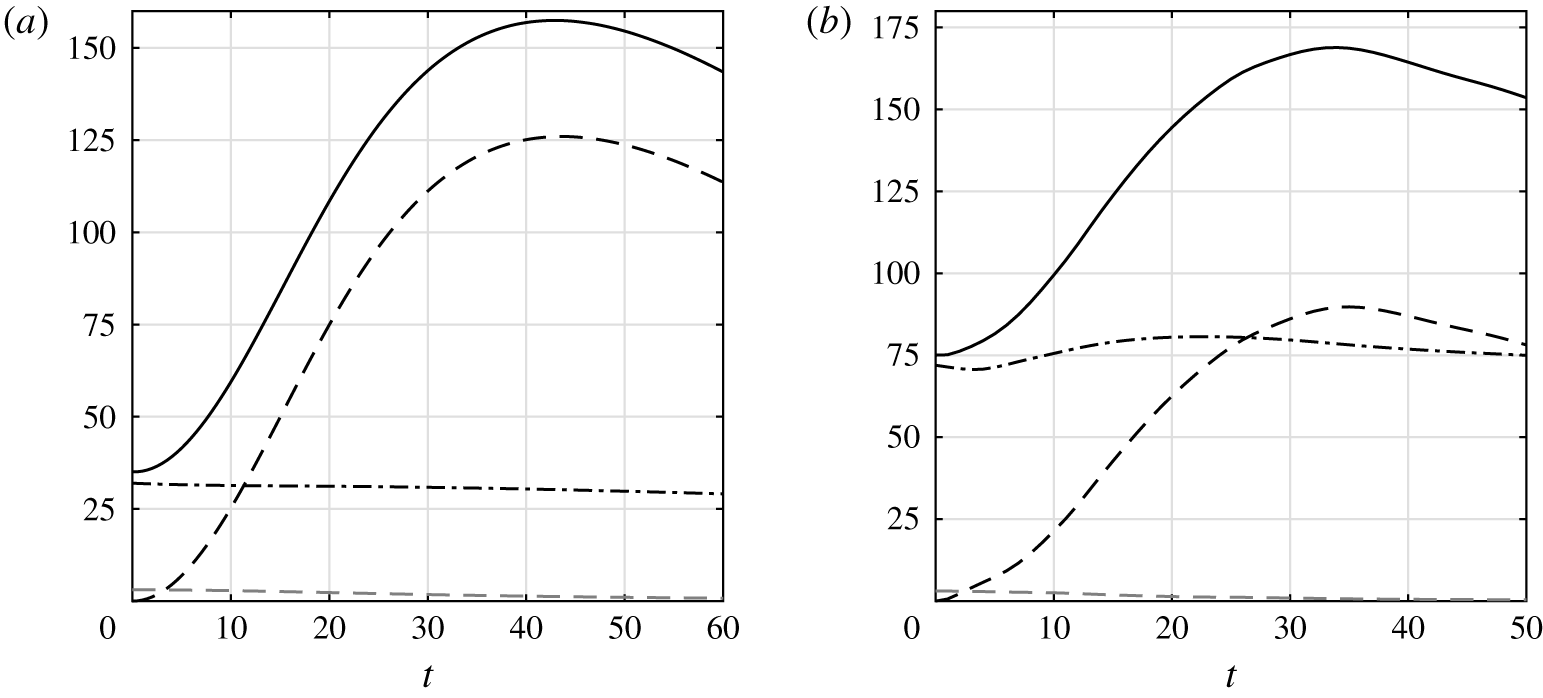
Time evolutions of the global total enstrophy  $\bar{Z}+Z_{h}^{\ast }+Z_{z}^{\ast }$ (black solid line), the mean flow enstrophy
 $\bar{Z}$ (black dash-dotted line), the vortex horizontal enstrophy
 $Z_{h}^{\ast }$ (black dashed line) and the vortex vertical enstrophy
 $Z_{z}^{\ast }$ (grey dashed line) for (a)
 $F_{h}=0.1$,
 $k_{z}=\unicode[STIX]{x03C0}$ and (b)
 $F_{h}=0.5$,
 $k_{z}=3\unicode[STIX]{x03C0}/2$ for
 $U_{S}=0.2$,
 $Re=6000$.

Likewise, figure 7 displays the evolutions of the global enstrophies per vertical length unit, decomposed using (3.2)
 $$\begin{eqnarray}\bar{Z}=\frac{1}{l_{z}}\int _{V}\frac{\bar{\unicode[STIX]{x1D74E}}^{2}}{2}\text{d}V,\quad Z_{h}^{\ast }=\frac{1}{l_{z}}\int _{V}\frac{{\unicode[STIX]{x1D74E}_{h}^{\ast }}^{2}}{2}\text{d}V,\quad Z_{z}^{\ast }=\frac{1}{l_{z}}\int _{V}\frac{{\unicode[STIX]{x1D701}^{\ast }}^{2}}{2}\text{d}V,\end{eqnarray}$$
where  $\bar{\unicode[STIX]{x1D74E}}$ is the vorticity of the shear flow and
 $\unicode[STIX]{x1D74E}_{h}^{\ast }$ and
 $\unicode[STIX]{x1D701}^{\ast }$ the horizontal and vertical vorticities of the vortex part. The global horizontal enstrophy of the vortex
 $Z_{h}^{\ast }$ (black dashed lines) increases and then decreases while its vertical counterpart
 $Z_{z}^{\ast }$ (grey dashed lines) continuously decays. Remarkably, the growth of
 $Z_{h}^{\ast }$ is much more pronounced for
 $k_{z}=\unicode[STIX]{x03C0}$,
 $F_{h}=0.1$ than for
 $k_{z}=3\unicode[STIX]{x03C0}/2$,
 $F_{h}=0.5$ although the vertical wavenumber
 $k_{z}$ is higher in this second case. The enstrophy of the mean shear
 $\bar{Z}$ remains approximately constant like the mean kinetic energy
 $\bar{E}_{k}$. Since the mean enstrophy
 $\bar{Z}$ for
 $k_{z}=3\unicode[STIX]{x03C0}/2$ is more than twice the one for
 $k_{z}=\unicode[STIX]{x03C0}$, the maximum of the total enstrophy (solid lines) is comparable in the two simulations even if
 $\max (Z_{h}^{\ast })$ is lower for
 $k_{z}=3\unicode[STIX]{x03C0}/2$.
4 Comparison with the long-wavelength asymptotic analysis
4.1 Reminder
In Part  $1$, we have performed a long-wavelength asymptotic analysis for
 $k_{z}F_{h}\ll 1$, i.e. for small vertical Froude number
 $F_{v}=k_{z}F_{h}=\unicode[STIX]{x1D6E4}/(a_{0}l_{z}N)$. Leading-order viscous effects have been also taken into account. This analysis has provided evolution equations for the position of the vortex centre at each level
 $z$
 $$\begin{eqnarray}\displaystyle & \displaystyle \unicode[STIX]{x0394}x=U(z)t+\unicode[STIX]{x1D6FF}x(z,t), & \displaystyle\end{eqnarray}$$
 $$\begin{eqnarray}\displaystyle & \displaystyle \unicode[STIX]{x0394}y=\unicode[STIX]{x1D6FF}y(z,t), & \displaystyle\end{eqnarray}$$
where
 $$\begin{eqnarray}\displaystyle & \displaystyle \frac{\unicode[STIX]{x2202}\unicode[STIX]{x1D6FF}x}{\unicode[STIX]{x2202}t}=\left[\frac{{\mathcal{A}}(z,t)}{2}\frac{\unicode[STIX]{x2202}^{2}\unicode[STIX]{x1D6FF}y}{\unicode[STIX]{x2202}z^{2}}-\left(\unicode[STIX]{x1D717}(z,t)+\frac{\unicode[STIX]{x2202}{\mathcal{C}}_{w}}{\unicode[STIX]{x2202}t}(z,t)\right)\frac{\text{d}^{2}U}{\text{d}z^{2}}\right]F_{h}^{2}, & \displaystyle\end{eqnarray}$$
 $$\begin{eqnarray}\displaystyle & \displaystyle \frac{\unicode[STIX]{x2202}\unicode[STIX]{x1D6FF}y}{\unicode[STIX]{x2202}t}=-\left[\frac{\unicode[STIX]{x2202}}{\unicode[STIX]{x2202}z}\left(\frac{{\mathcal{A}}(z,t)}{2}t\frac{\text{d}U}{\text{d}z}\right)+\frac{{\mathcal{A}}(z,t)}{2}\frac{\unicode[STIX]{x2202}^{2}\unicode[STIX]{x1D6FF}x}{\unicode[STIX]{x2202}z^{2}}+\frac{\unicode[STIX]{x2202}{\mathcal{S}}_{w}}{\unicode[STIX]{x2202}t}(z,t)\frac{\text{d}^{2}U}{\text{d}z^{2}}\right]F_{h}^{2}, & \displaystyle\end{eqnarray}$$
where  ${\mathcal{C}}_{w}$ and
 ${\mathcal{S}}_{w}$ are the effects of internal waves excited at
 $t=0$ and that decay quickly afterwards. The parameters
 ${\mathcal{A}}$ and
 $\unicode[STIX]{x1D717}$ correspond to the self-induction of the vortex and an advection correction, respectively. The expressions of all these parameters are given in Part
 $1$.
An approximation for the solution of (4.3)–(4.4) has been found in Part  $1$ in the form
 $$\begin{eqnarray}\displaystyle & \displaystyle \unicode[STIX]{x1D6FF}x=-F_{h}^{2}\left[{\mathcal{C}}_{w}(z,t)+\int _{0}^{t}\unicode[STIX]{x1D717}(z,\unicode[STIX]{x1D710})\,\text{d}\unicode[STIX]{x1D710}\right]\frac{\text{d}^{2}U}{\text{d}z^{2}}, & \displaystyle\end{eqnarray}$$
 $$\begin{eqnarray}\displaystyle & \displaystyle \unicode[STIX]{x1D6FF}y=-F_{h}^{2}\left[{\mathcal{S}}_{w}(z,t)\frac{\text{d}^{2}U}{\text{d}z^{2}}+\int _{0}^{t}\frac{\unicode[STIX]{x2202}}{\unicode[STIX]{x2202}z}\left(\frac{{\mathcal{A}}(z,\unicode[STIX]{x1D710})}{2}\frac{\text{d}U}{\text{d}z}\right)\unicode[STIX]{x1D710}\,\text{d}\unicode[STIX]{x1D710}\right]. & \displaystyle\end{eqnarray}$$
In addition, the asymptotic analysis has shown that the angular velocity of the vortex evolves according to
 $$\begin{eqnarray}\frac{\unicode[STIX]{x2202}\unicode[STIX]{x1D6FA}}{\unicode[STIX]{x2202}t}=\left[-F_{h}^{2}t\unicode[STIX]{x1D6FA}^{3}+\frac{t^{2}}{2Re\tilde{r}}\frac{\unicode[STIX]{x2202}\unicode[STIX]{x1D701}_{0}}{\unicode[STIX]{x2202}\tilde{r}}\right]\left(\frac{\text{d}U}{\text{d}z}\right)^{2},\end{eqnarray}$$
where  $\unicode[STIX]{x1D701}_{0}=(1/\tilde{r})\unicode[STIX]{x2202}\tilde{r}^{2}\unicode[STIX]{x1D6FA}/\unicode[STIX]{x2202}\tilde{r}$ is the vertical vorticity and
 $\tilde{r}$ is the local radius with respect to the centre of the vortex at the level
 $z$:
 $\tilde{r}^{2}=(x-U(z)t-\unicode[STIX]{x1D6FF}x)^{2}+(y-\unicode[STIX]{x1D6FF}y)^{2}$. The first term on the right-hand side of (4.7) ensures the conservation of potential vorticity while the second term describes the leading viscous effect. This effect is proportional to
 $t^{2}$ because the vertical shear grows like
 $t\,\text{d}U/\text{d}z$ at leading order. Internal waves have been neglected in (4.7) since their effects have been shown to be very weak. In Part
 $1$, the equation (4.7) has been solved asymptotically. In particular, an analytic expression for the angular velocity on the vortex axis has been obtained
 $$\begin{eqnarray}\unicode[STIX]{x1D6FA}(\tilde{r}=0,z,t)=\frac{1}{\sqrt{(1+2\unicode[STIX]{x1D6FE}T^{3}/3)^{2}+T^{2}}},\end{eqnarray}$$
where  $T=F_{h}t|\text{d}U/\text{d}z|$ and
 $\unicode[STIX]{x1D6FE}(z)=1/(ReF_{h}^{3}|\text{d}U/\text{d}z|)$. This expression is in very good agreement with the exact result obtained by numerical integration of (4.7). It will be therefore used in the following.
In addition, the asymptotic analysis has provided the horizontal velocity at order  $O[(k_{z}F_{h})^{2}]$ and the vertical velocity and buoyancy at leading order. They allowed us to predict the evolution of the vertical shear of the horizontal velocity, the vertical buoyancy gradient and the Richardson number at the vortex centre at
 $z=l_{z}/2$. These predictions will be compared with the DNS in § 4.3. Before, we begin by presenting in the next section a comparison between the location of the vortex centre observed in the DNS and the asymptotic predictions (4.1)–(4.2).
4.2 Deformations of the vortex axis
In order to estimate the position of the vortex centre in the numerical simulations, we have used two methods: one based on the potential vorticity  $\unicode[STIX]{x1D6F1}$ and the other on the vertical vorticity
 $\unicode[STIX]{x1D701}$. In each case, the displacements of the vortex centre have been estimated from vorticity centroids
 $$\begin{eqnarray}\unicode[STIX]{x0394}x_{c}^{\unicode[STIX]{x1D6F1}}(z,t)=\frac{\langle x\unicode[STIX]{x1D6F1}\rangle _{h}}{\langle \unicode[STIX]{x1D6F1}\rangle _{h}},\quad \unicode[STIX]{x0394}y_{c}^{\unicode[STIX]{x1D6F1}}(z,t)=\frac{\langle y\unicode[STIX]{x1D6F1}\rangle _{h}}{\langle \unicode[STIX]{x1D6F1}\rangle _{h}},\end{eqnarray}$$
or
 $$\begin{eqnarray}\unicode[STIX]{x0394}x_{c}^{\unicode[STIX]{x1D701}}(z,t)=\frac{\langle x\unicode[STIX]{x1D701}\rangle _{h}}{\langle \unicode[STIX]{x1D701}\rangle _{h}},\quad \unicode[STIX]{x0394}y_{c}^{\unicode[STIX]{x1D701}}(z,t)=\frac{\langle y\unicode[STIX]{x1D701}\rangle _{h}}{\langle \unicode[STIX]{x1D701}\rangle _{h}},\end{eqnarray}$$
where the brackets denote
 $$\begin{eqnarray}\langle \unicode[STIX]{x1D711}\rangle _{h}=\int _{\unicode[STIX]{x1D711}>\unicode[STIX]{x1D711}_{c}}\unicode[STIX]{x1D711}\,\text{d}x\,\text{d}y.\end{eqnarray}$$
The horizontal integration is carried out only in the regions where the vorticity is larger than a critical value  $\unicode[STIX]{x1D6F1}_{c}$,
 $\unicode[STIX]{x1D701}_{c}$. In this way, we exclude the small background vorticity due to the fact that the total vorticity is zero owing to the use of periodic boundary conditions. The values
 $\unicode[STIX]{x1D6F1}_{c}=0.05\max _{t=0}(\unicode[STIX]{x1D6F1})$ and
 $\unicode[STIX]{x1D701}_{c}=0.05\max _{t=0}(\unicode[STIX]{x1D701})$ have been chosen as they provide results almost independent of the size of the computational domain and the particular values of the thresholds.
The tracking method based on the potential vorticity seems more natural since it is a transported quantity in the inviscid limit. However, we shall see that the method based on the vertical vorticity will enable a closer comparison to the asymptotic results. This is because the condition used to normalize the streamfunction at first order  $\unicode[STIX]{x1D713}_{1}$ in the asymptotic analysis:
 $\langle x\unicode[STIX]{x1D6FB}_{h}^{2}\unicode[STIX]{x1D713}_{1}\rangle _{h}=0$,
 $\langle y\unicode[STIX]{x1D6FB}_{h}^{2}\unicode[STIX]{x1D713}_{1}\rangle _{h}=0$, implies
 $$\begin{eqnarray}\unicode[STIX]{x0394}x_{c}^{\unicode[STIX]{x1D701}}=\frac{\langle x\unicode[STIX]{x1D701}\rangle _{h}}{\langle \unicode[STIX]{x1D701}\rangle _{h}}=\frac{\langle x[\unicode[STIX]{x1D701}_{0}+(k_{z}F_{h})^{2}\unicode[STIX]{x1D6FB}_{h}^{2}\unicode[STIX]{x1D713}_{1}+\cdots \,]\rangle _{h}}{\langle \unicode[STIX]{x1D701}_{0}+(k_{z}F_{h})^{2}\unicode[STIX]{x1D6FB}_{h}^{2}\unicode[STIX]{x1D713}_{1}+\cdots \,\rangle _{h}}=\frac{\langle x\unicode[STIX]{x1D701}_{0}(\tilde{r})\rangle _{h}}{\langle \unicode[STIX]{x1D701}_{0}\rangle _{h}}=\unicode[STIX]{x0394}x,\end{eqnarray}$$
and, similarly  $\unicode[STIX]{x0394}y_{c}^{\unicode[STIX]{x1D701}}=\unicode[STIX]{x0394}y$, where
 $(\unicode[STIX]{x0394}x,\unicode[STIX]{x0394}y)$ are the asymptotic displacements (4.1)–(4.2) and
 $\unicode[STIX]{x1D701}_{0}$ is the leading-order vertical vorticity.
In the next sections, we compare the asymptotic and numerical results for different parameters.
4.2.1 In-depth analysis of a simulation
(a,b) Comparison between the vertical vorticity centroids  $\unicode[STIX]{x0394}x_{c}^{\unicode[STIX]{x1D701}}$ and
 $\unicode[STIX]{x0394}y_{c}^{\unicode[STIX]{x1D701}}$ (grey open circles), the potential vorticity centroids
 $\unicode[STIX]{x0394}x_{c}^{\unicode[STIX]{x1D6F1}}$ and
 $\unicode[STIX]{x0394}y_{c}^{\unicode[STIX]{x1D6F1}}$ (grey crosses) and the asymptotic predictions for the displacements
 $\unicode[STIX]{x0394}x$ and
 $\unicode[STIX]{x1D6FF}y$ (black solid lines) in the plane
 $z=l_{z}/4$. (c) Displays a close-up view of the initial evolution of
 $\unicode[STIX]{x0394}y_{c}^{\unicode[STIX]{x1D701}}$ (grey open circles),
 $\unicode[STIX]{x0394}y_{c}^{\unicode[STIX]{x1D6F1}}$ (grey crosses) and
 $\unicode[STIX]{x1D6FF}y$ (black solid line). The asymptotic prediction in the absence of internal waves, i.e. by setting
 ${\mathcal{C}}_{w}={\mathcal{S}}_{w}=0$ in (4.5)–(4.6) has been also reported (black dashed line). The short-time asymptotic prediction for
 $\unicode[STIX]{x1D6FF}y$ has been plotted as well (grey solid line). The parameters are
 $F_{h}=0.5$,
 $k_{z}=0.3$,
 $U_{S}=0.2$ and
 $Re=6000$.

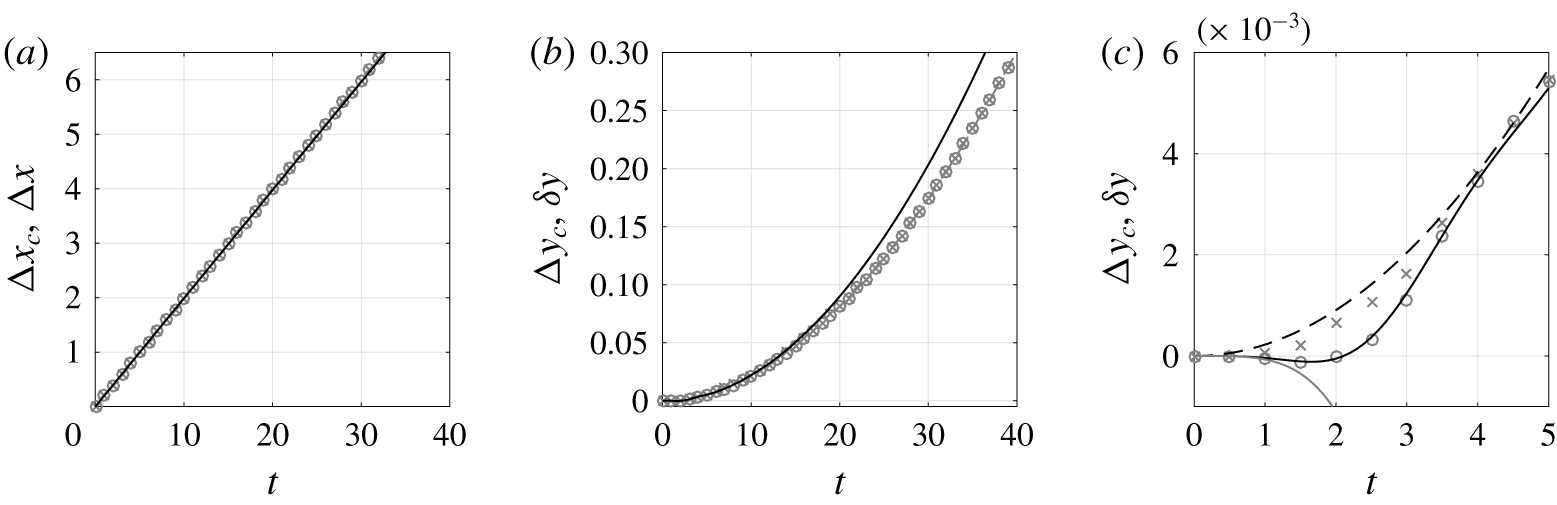
Figure 8 compares the total displacements  $\unicode[STIX]{x0394}x=U_{S}t+\unicode[STIX]{x1D6FF}x$ and
 $\unicode[STIX]{x1D6FF}y$ as predicted by the asymptotics to the positions
 $\unicode[STIX]{x0394}x_{c}$ and
 $\unicode[STIX]{x0394}y_{c}$ of the vortex estimated from the vertical vorticity and potential vorticity centroids at the level
 $z=l_{z}/4$ for
 $F_{h}=0.5$,
 $k_{z}=0.3$,
 $U_{S}=0.2$ and
 $Re=6000$. The agreement is excellent at all times for
 $\unicode[STIX]{x0394}x$ and up to
 $t\simeq 15$ for
 $\unicode[STIX]{x1D6FF}y$. The dominant displacement is in the
 $x$ direction (figure 8a) and given by
 $U_{S}t$ while the deviations
 $\unicode[STIX]{x1D6FF}x$ and
 $\unicode[STIX]{x1D6FF}y$ are much smaller.
The displacement of the vortex estimated from the vertical vorticity,  $(\unicode[STIX]{x0394}x_{c}^{\unicode[STIX]{x1D701}},\unicode[STIX]{x0394}y_{c}^{\unicode[STIX]{x1D701}})$, and from the potential vorticity,
 $(\unicode[STIX]{x0394}x_{c}^{\unicode[STIX]{x1D6F1}},\unicode[STIX]{x0394}y_{c}^{\unicode[STIX]{x1D6F1}})$, are almost equal. However, if we focus on the initial evolution of
 $\unicode[STIX]{x0394}y_{c}^{\unicode[STIX]{x1D701}}$ and
 $\unicode[STIX]{x0394}y_{c}^{\unicode[STIX]{x1D6F1}}$ (figure 8c), we see that they are actually different for
 $t\leqslant 4$. The displacement
 $\unicode[STIX]{x0394}y_{c}^{\unicode[STIX]{x1D701}}$ (open circles) is first slightly negative for
 $t\leqslant 2$ in excellent agreement with the asymptotic prediction
 $\unicode[STIX]{x1D6FF}y$ (black solid line). In contrast, the
 $y$ displacement estimated from the potential vorticity
 $\unicode[STIX]{x0394}y_{c}^{\unicode[STIX]{x1D6F1}}$ (crosses) increases monotonically. As explained above, the estimation of the vortex centre from the vertical vorticity is in much better agreement with the asymptotics than the estimation from the potential vorticity because the normalization condition used in the asymptotic analysis is based on the vertical vorticity.
Nevertheless, if the effects of the internal waves are neglected in (4.5)–(4.6) (i.e.  ${\mathcal{C}}_{w}={\mathcal{S}}_{w}=0$), the asymptotic prediction (black dashed line) is then close to
 $\unicode[STIX]{x0394}y_{c}^{\unicode[STIX]{x1D6F1}}$. This confirms that internal waves play a key role at the start-up of the flow evolution. Because of these waves, the initial evolution of
 $\unicode[STIX]{x1D6FF}y$ at
 $z=l_{z}/4$ is of the form
 $\unicode[STIX]{x1D6FF}y=k_{z}^{2}U_{S}\unicode[STIX]{x1D70E}t^{4}$, where
 $\unicode[STIX]{x1D70E}=-3.826\times 10^{-3}$ is a constant (Part 1), as shown by the grey solid line in figure 8(c). In contrast, when internal waves are neglected,
 $\unicode[STIX]{x1D6FF}y$ evolves initially as
 $\unicode[STIX]{x1D6FF}y\propto t^{2}$ (black dashed line).
(a,b) Comparison between the vertical vorticity centroids  $\unicode[STIX]{x0394}x_{c}^{\unicode[STIX]{x1D701}}$ (a) and
 $\unicode[STIX]{x0394}y_{c}^{\unicode[STIX]{x1D701}}$ (b) (grey dashed lines with open circles) and the asymptotic predictions for the displacements
 $\unicode[STIX]{x0394}x$ and
 $\unicode[STIX]{x1D6FF}y$ (black solid lines) as a function of
 $z$ at different times
 $t=6$, 12, 18, 24, 30, 36 (increasing amplitudes). The dotted lines represent the exact solution obtained by numerical integration of (4.3)–(4.4). The parameters are
 $F_{h}=0.5$,
 $k_{z}=0.3$,
 $U_{S}=0.2$ and
 $Re=6000$.

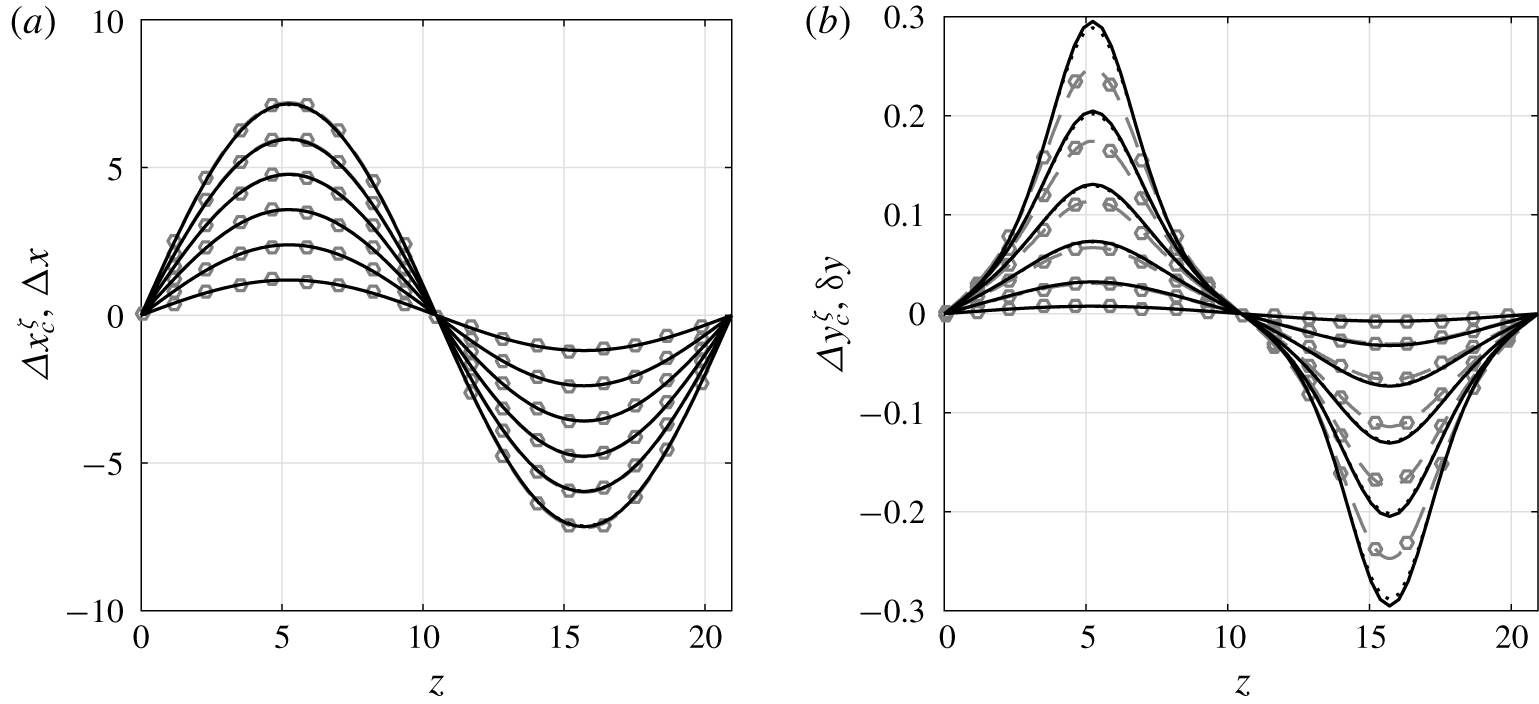
Figure 9 shows the vertical profiles of the  $x$ and
 $y$ displacements at different times. As can be seen in figure 9(a), the agreement between the vertical vorticity centroid
 $\unicode[STIX]{x0394}x_{c}^{\unicode[STIX]{x1D701}}$ measured in the simulations (grey dashed lines with open circles) and the asymptotic prediction
 $\unicode[STIX]{x0394}x$ (black solid lines) is excellent along all the vertical. It follows very well the sinusoidal profile
 $\unicode[STIX]{x0394}x=U_{s}t\sin (k_{z}z)$ since the correction
 $\unicode[STIX]{x1D6FF}x$ is much smaller. There is also a good agreement between the numerics and the asymptotics for the
 $y$-displacement (figure 9b) although some departures appear around the extrema for large time, as was already seen in figure 8(b). It is also clearly visible that the
 $y$-displacement departs from a sinusoidal shape as time increases. This non-sinusoidal profile comes from the vertical variations of the parameter
 ${\mathcal{A}}$ (in the second term of (4.6)) induced by the modulation of the angular velocity of the vortex along the vertical. We have also plotted in figure 9 the exact asymptotic displacements obtained by numerical integration of (4.3)–(4.4) (dotted lines). However, these curves are only visible around the maxima of
 $\unicode[STIX]{x1D6FF}y$ at the latest time shown (figure 9b) because they are almost identical to the approximation (4.5)–(4.6).
Horizontal cross-sections in the plane  $z=l_{z}/2$ of (a–c) the vertical velocity calculated asymptotically and (d–f) in the DNS for
 $F_{h}=0.5$,
 $k_{z}=0.3$,
 $U_{S}=0.2$ and
 $Re=6000$ at
 $t=2$ (a,d),
 $t=6$ (b,e) and
 $t=18$ (c,f).

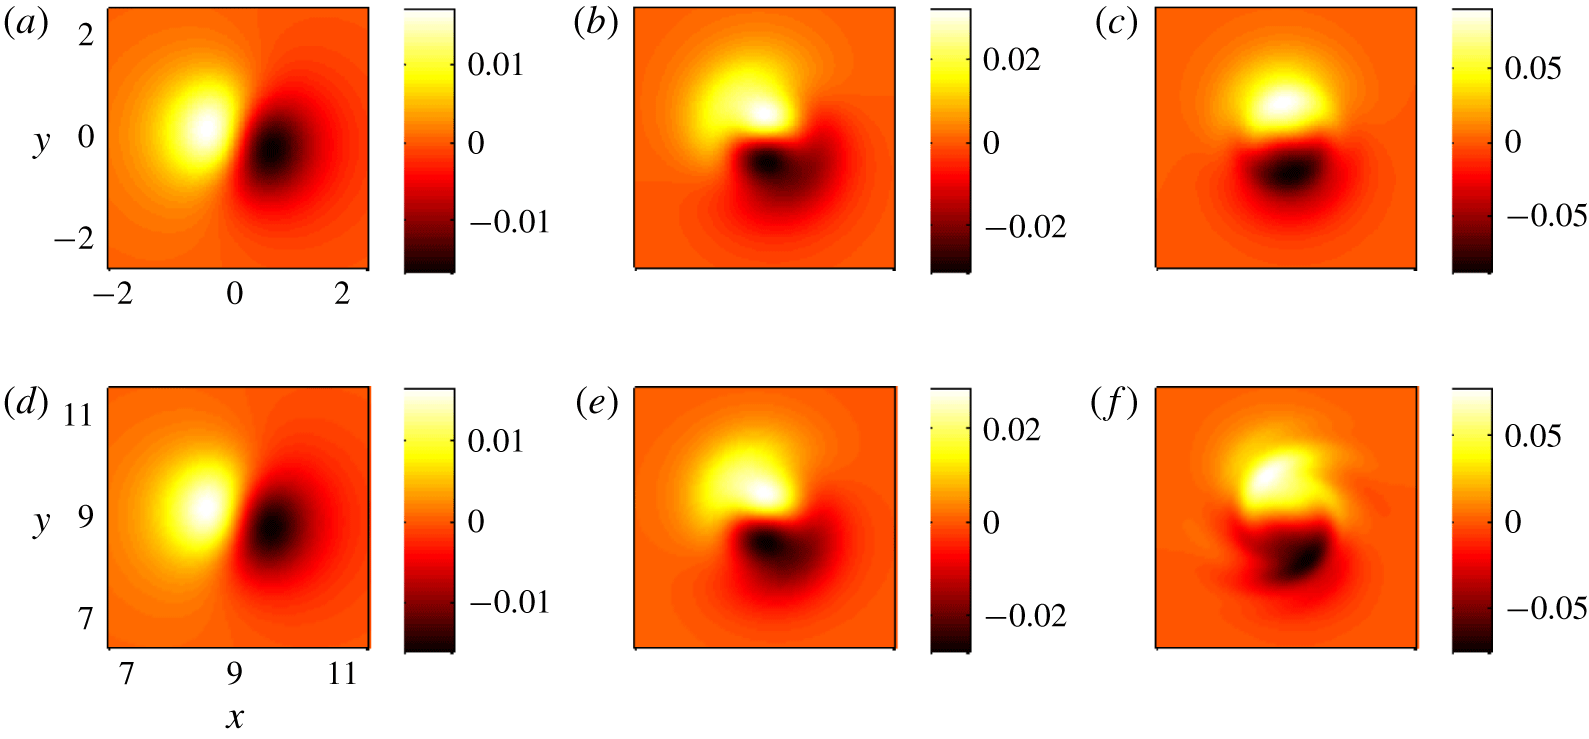
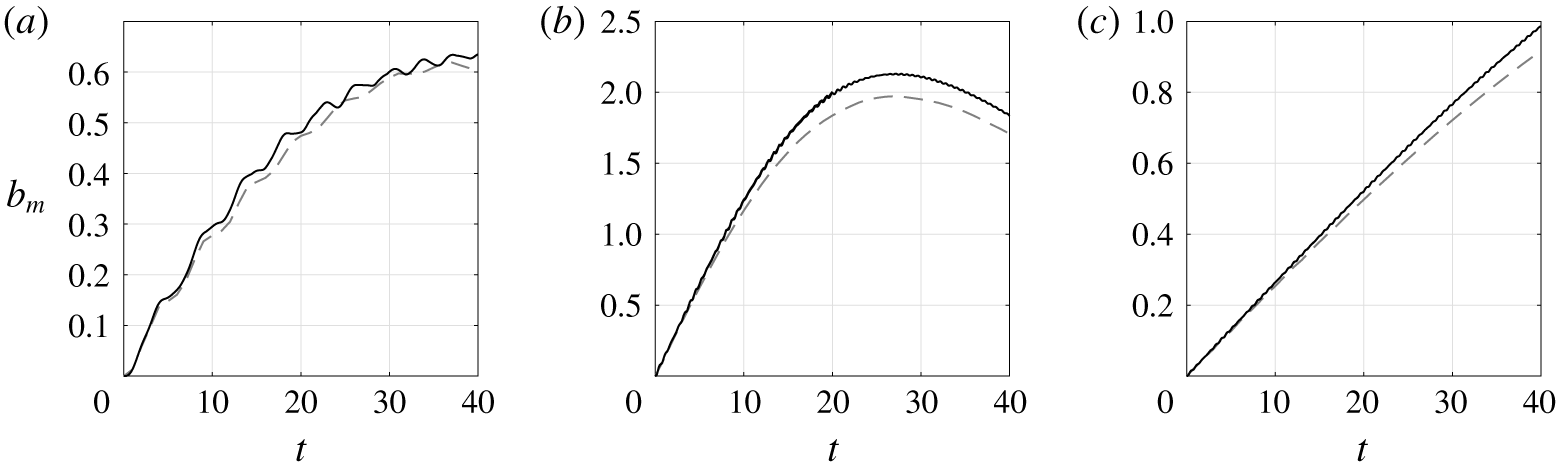
We have also compared the vertical velocity field predicted by the asymptotics against its numerical counterpart. Figure 10 displays horizontal cross-sections of  $w$ in the plane
 $z=l_{z}/2$ where it is maximum. A very good qualitative and quantitative agreement is observed even at
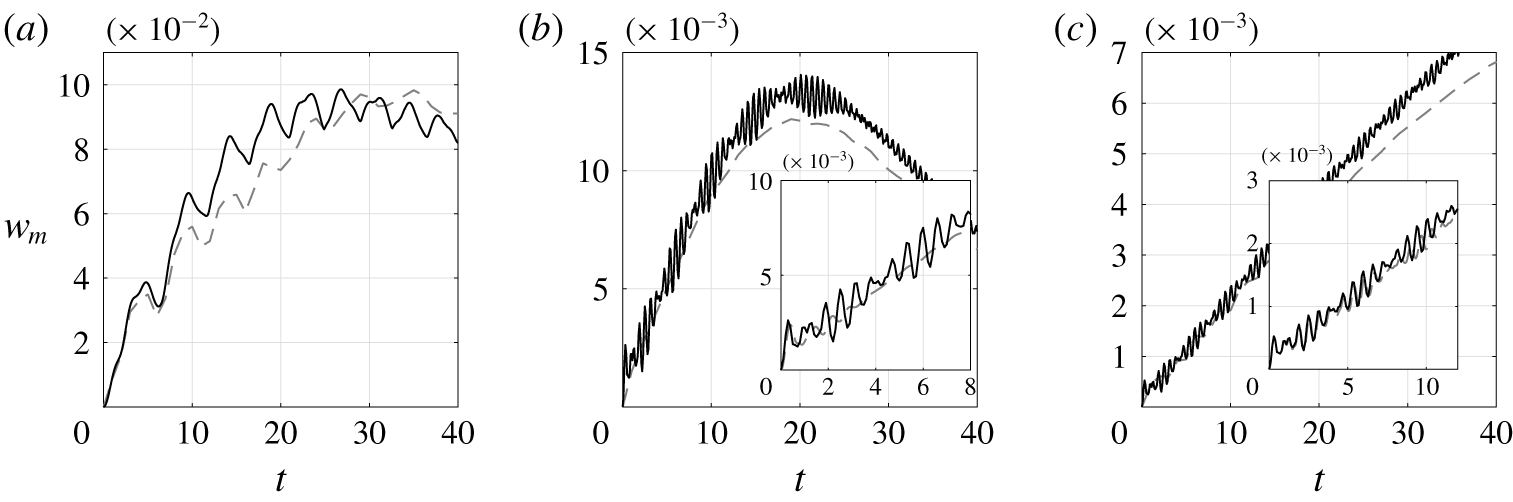
 $t=18$ (figure 10c,f) apart from the existence of small wave-like disturbances in the DNS that are absent in the asymptotics. The close agreement between the asymptotic and numerical results can be further seen in the temporal variations of the maximum values of
 $w$ and
 $b$ (figures 11a and 12a). The asymptotic and numerical results begin to slightly depart from each other as late as
 $t\simeq 10$. The maximum values of
 $w$ and
 $b$ increase initially linearly and then saturate with oscillations superimposed. These oscillations are due to the internal waves excited at
 $t=0$. Two periods
 $T=2\unicode[STIX]{x03C0}F_{h}=\unicode[STIX]{x03C0}$ and
 $T=2\unicode[STIX]{x03C0}/\unicode[STIX]{x1D6FA}(r=0)=2\unicode[STIX]{x03C0}$ are mixed, explaining why the oscillations look somewhat irregular, especially for
 $w_{m}$ (figure 11a).
Similar agreements have been observed for different values of  $U_{S}$ and
 $Re$. In the next subsection, we investigate the effects of varying the Froude number and the wavenumber.
Evolution of the maximum velocity  $w_{m}$ in the plane
 $z=l_{z}/2$ in the DNS (grey dashed lines) and from the asymptotic predictions (black solid lines) for
 $Re=6000$,
 $U_{S}=0.2$ for (a)
 $F_{h}=0.5$,
 $k_{z}=0.3$, (b)
 $F_{h}=0.1$,
 $k_{z}=1.5$, (c)
 $F_{h}=0.1$,
 $k_{z}=0.3$. The insets in (b,c) display a close-up view of the initial evolution.

Evolution of the maximum buoyancy  $b_{m}$ in the plane
 $z=l_{z}/2$ in the DNS (grey dashed lines) and from the asymptotic predictions (black solid lines) for
 $Re=6000$,
 $U_{S}=0.2$ for (a)
 $F_{h}=0.5$,
 $k_{z}=0.3$, (b)
 $F_{h}=0.1$,
 $k_{z}=1.5$, (c)
 $F_{h}=0.1$,
 $k_{z}=0.3$.

4.2.2 Effects of  $F_{h}$ and $k_{z}$


Figures 11(b,c) and 12(b,c) show the evolution of the maximum vertical velocity and buoyancy for a lower Froude number  $F_{h}=0.1$ and two different wavenumbers. In the first case (figures 11b and 12b), the wavenumber has been increased to
 $k_{z}=1.5$ so that the product
 $k_{z}F_{h}=0.15$ is the same as before while, in the second case (figures 11c and 12c), the wavenumber is still
 $k_{z}=0.3$. The agreement is good for both wavenumbers confirming that the relevant small parameter is
 $k_{z}F_{h}$ and not
 $k_{z}$. However, we can notice that the oscillations of the maximum buoyancy are strongly reduced when
 $F_{h}=0.1$ (figure 12b,c) compared to
 $F_{h}=0.5$ (figure 12a). This is because the amplitude of the internal waves in the buoyancy scales as the Froude number. In contrast, oscillations are still visible in the evolution of the maximum asymptotic vertical velocity for
 $F_{h}=0.1$ (figure 11b,c) since the amplitude of the internal waves in this field does not vanish in the limit of small Froude number. However, no oscillations are present at large time in the DNS (dashed lines) for
 $F_{h}=0.1$ unlike for
 $F_{h}=0.5$ (figure 11). Nevertheless, the mean evolution of
 $w_{m}$ in the DNS is close to the one predicted by the asymptotics for
 $F_{h}=0.1$. The insets in figure 11(b,c) show a close-up view of the initial evolution of
 $w_{m}$ for
 $F_{h}=0.1$. We can see that the oscillations are quickly damped in the DNS for
 $k_{z}=1.5$ (figure 11b) and disappear for
 $t\gtrsim 3$. For
 $k_{z}=0.3$ (figure 11c), they persist for a longer time and start to decay only after
 $t\sim 10$. For
 $t<10$ the agreement between the asymptotics and the numerics is excellent.
The reason for these discrepancies is the following. As already mentioned, the asymptotic problem has been solved in Part 1 for long wavelengths by assuming  $k_{z}F_{h}\ll 1$. The reason why
 $k_{z}F_{h}$ is the appropriate parameter is that the buoyancy length scale is the natural vertical length scale of vortical motions in strongly stratified inviscid flows (Billant & Chomaz Reference Billant and Chomaz2001). However, this self-similarity does not apply to the internal waves that are generated at the start-up of the motion because they evolve on the fast time scale
 $1/F_{h}$ and not on the turnover time scale of the vortex. For this reason, the asymptotic calculation of the internal waves component performed in Part 1 is actually correct only when
 $k_{z}$ is small but not if
 $k_{z}$ is of order unity and
 $F_{h}$ small. For finite
 $k_{z}$, the internal waves could be computed only numerically. However, the inset in figure 11(b) shows that only few oscillation cycles are present at the beginning. This is because the internal waves quickly propagate away from the vortex core. Indeed, their radial group velocity, which is proportional to
 $k_{z}^{2}/F_{h}$, is large for
 $k_{z}=O(1)$ and
 $F_{h}\ll 1$. In contrast, when
 $k_{z}$ is small and
 $F_{h}$ finite, the radial group velocity is small, meaning that the internal waves remain a long time in the vortex core, i.e. are almost purely standing waves as found in the asymptotic analysis. This is the reason why the oscillation cycles are seen for a longer time for
 $k_{z}=0.3$ (inset in figure 11c) than for
 $k_{z}=1.5$ (inset in figure 11b).
Since finite  $k_{z}$ will be mostly considered in the following, we have chosen to completely neglect the internal waves for these reasons.
4.3 Evolution of the vertical shear and the Richardson number
We now investigate the evolution of the flow at the vortex centre and at the level  $z=l_{z}/2$ where the ambient shear is maximum. As seen in § 3, this is the location (together with the symmetric point
 $z=0$) where the Richardson number reaches its minimum or where the Kelvin–Helmholtz instability first appears.
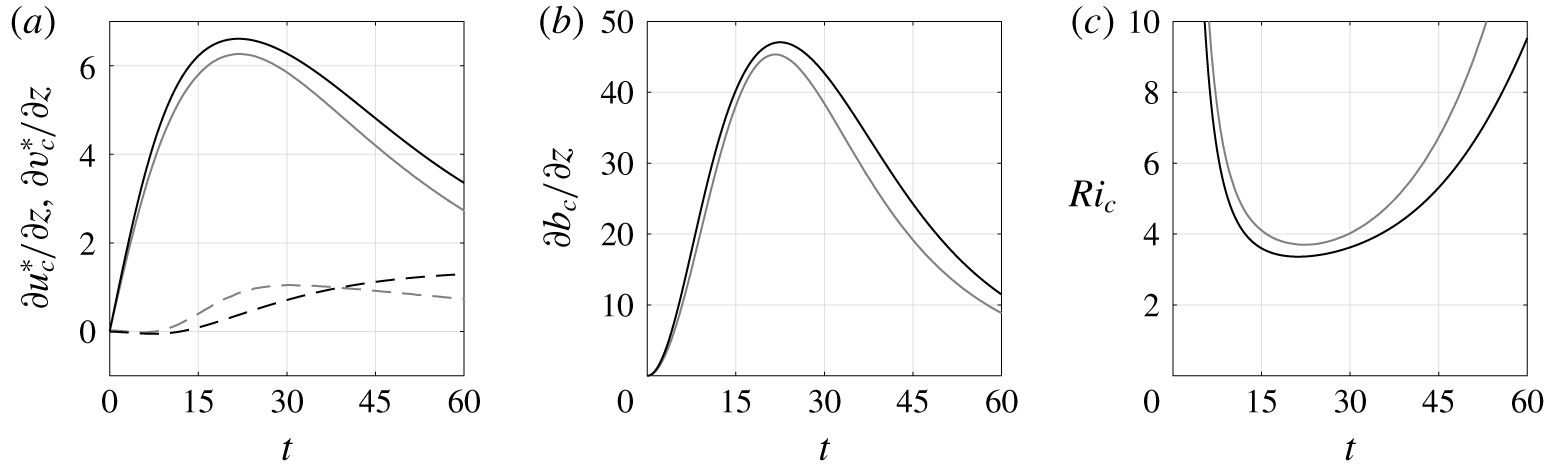
Evolution of (a)  $\unicode[STIX]{x2202}u^{\ast }/\unicode[STIX]{x2202}z$ (dashed line),
 $\unicode[STIX]{x2202}v^{\ast }/\unicode[STIX]{x2202}z$ (solid line), (b)
 $\unicode[STIX]{x2202}b/\unicode[STIX]{x2202}z$ and (c)
 $Ri$ at
 $\tilde{r}=0$,
 $z=l_{z}/2$ from the DNS (grey lines) and predicted from the asymptotics (black lines). The parameters are
 $F_{h}=0.1$,
 $k_{z}=\unicode[STIX]{x03C0}$,
 $U_{S}=0.2$,
 $Re=6000$.

Figure 13(a,b) compares  $\unicode[STIX]{x2202}u^{\ast }/\unicode[STIX]{x2202}z$,
 $\unicode[STIX]{x2202}v^{\ast }/\unicode[STIX]{x2202}z$ and
 $\unicode[STIX]{x2202}b/\unicode[STIX]{x2202}z$ at the vortex centre at
 $z=l_{z}/2$ observed in the DNS for
 $F_{h}=0.1$,
 $k_{z}=\unicode[STIX]{x03C0}$,
 $U_{S}=0.2$ and
 $Re=6000$ (grey lines) to their asymptotic counterparts derived in Part 1 (black lines). Apart from
 $\unicode[STIX]{x2202}u_{c}^{\ast }/\unicode[STIX]{x2202}z$, the agreement is very good over the entire time range investigated. Since
 $\unicode[STIX]{x2202}v_{c}^{\ast }/\unicode[STIX]{x2202}z$ and
 $\unicode[STIX]{x2202}b_{c}/\unicode[STIX]{x2202}z$ depend only on the quantity
 $t\unicode[STIX]{x1D6FA}_{c}$ at leading order in
 $k_{z}F_{h}$ (where
 $\unicode[STIX]{x1D6FA}_{c}$ is the angular velocity at
 $\tilde{r}=0,z=l_{z}/2$), this agreement is an indirect confirmation of the relation (4.8) for the angular velocity at the vortex centre. The magnitude of
 $\unicode[STIX]{x2202}u_{c}^{\ast }/\unicode[STIX]{x2202}z$ is much lower than for
 $\unicode[STIX]{x2202}v_{c}^{\ast }/\unicode[STIX]{x2202}z$. The beginning of its evolution is well predicted by the asymptotics until
 $t\simeq 5-10$ but not later. Several checks led us to the conclusion that this discrepancy is not due to an error in our calculations but is most probably due to higher-order effects, not considered in the asymptotic analysis, that become quickly dominant over the leading order when
 $k_{z}F_{h}U_{S}t>1$. This is because the asymptotic expansion is not uniformly asymptotic in time since the long-wavelength assumption is expected to be no longer valid when
 $k_{z}F_{h}U_{S}t>1$ because vertical gradients grow like
 $k_{z}U_{S}t$. Nevertheless, figure 13(a,b) shows that the asymptotics for
 $\unicode[STIX]{x2202}v_{c}^{\ast }/\unicode[STIX]{x2202}z$ and
 $\unicode[STIX]{x2202}b_{c}/\unicode[STIX]{x2202}z$ remain in good agreement even when
 $t=60$, i.e.
 $k_{z}F_{h}U_{S}t\sim 4$. Despite this discrepancy on
 $\unicode[STIX]{x2202}u_{c}^{\ast }/\unicode[STIX]{x2202}z$, figure 13(c) shows that the asymptotic Richardson number
 $Ri_{c}$ is in good agreement with the one computed from the DNS since
 $\unicode[STIX]{x2202}u_{c}^{\ast }/\unicode[STIX]{x2202}z$ is one order smaller in
 $(k_{z}F_{h})^{2}$ than
 $\unicode[STIX]{x2202}v_{c}^{\ast }/\unicode[STIX]{x2202}z$ and
 $\unicode[STIX]{x2202}b_{c}/\unicode[STIX]{x2202}z$.
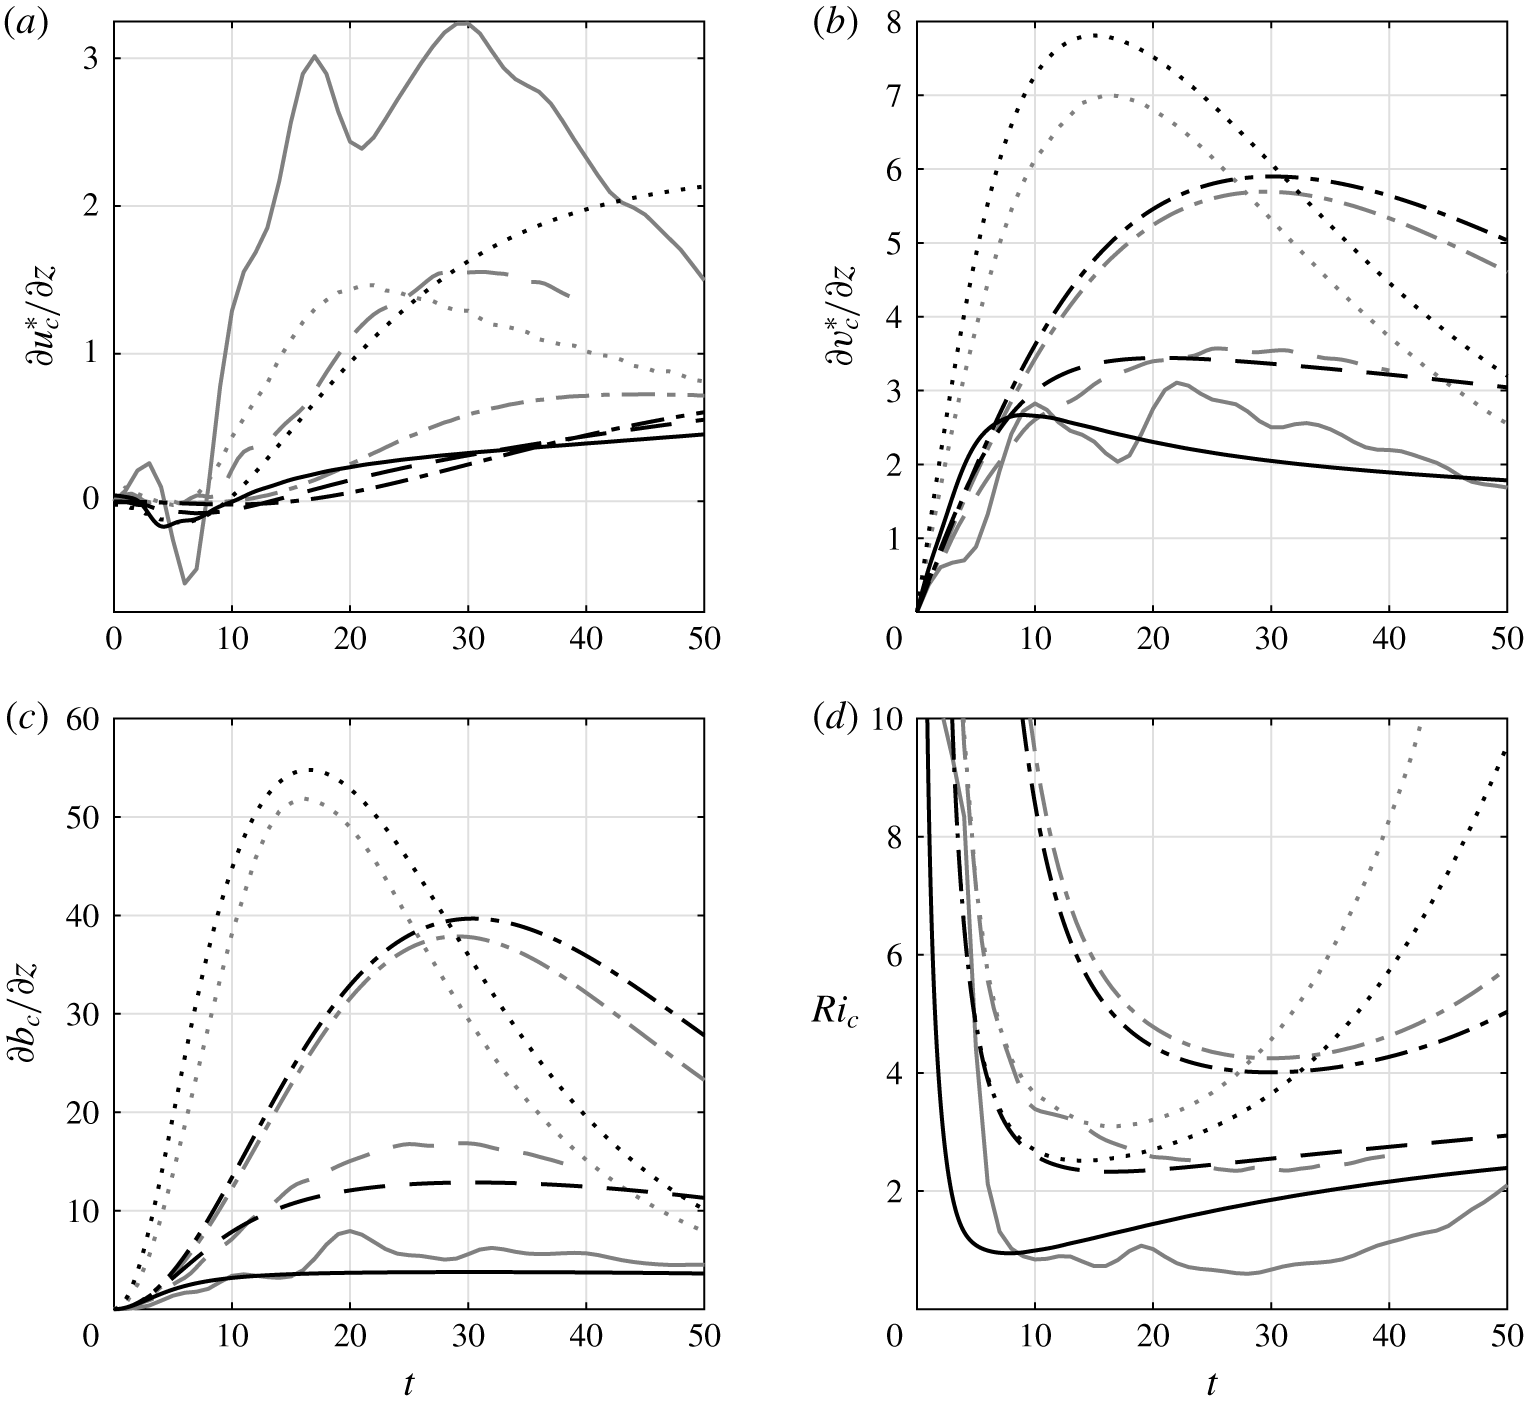
Evolution of (a)  $\unicode[STIX]{x2202}u^{\ast }/\unicode[STIX]{x2202}z$, (b)
 $\unicode[STIX]{x2202}v^{\ast }/\unicode[STIX]{x2202}z$, (c)
 $\unicode[STIX]{x2202}b/\unicode[STIX]{x2202}z$ and (d)
 $Ri$ at
 $\tilde{r}=0$,
 $z=l_{z}/2$, for
 $U_{S}=0.2$,
 $Re=6000$, for (
 $F_{h}=0.1$,
 $k_{z}=2$) (dash-dotted lines), (
 $F_{h}=0.25$,
 $k_{z}=2$) (dashed lines), (
 $F_{h}=0.5$,
 $k_{z}=2$) (solid lines) and (
 $F_{h}=0.1$,
 $k_{z}=5$) (dotted lines) from the DNS (grey lines) and predicted by the asymptotics (black lines).

The main assumption of the long-wavelength asymptotic analysis, i.e.  $k_{z}F_{h}\ll 1$, is reasonably well satisfied for the parameters of figure 13 since
 $k_{z}F_{h}=0.31$. Figure 14 further compares the evolutions of
 $\unicode[STIX]{x2202}u_{c}^{\ast }/\unicode[STIX]{x2202}z$,
 $\unicode[STIX]{x2202}v_{c}^{\ast }/\unicode[STIX]{x2202}z$,
 $\unicode[STIX]{x2202}b_{c}/\unicode[STIX]{x2202}z$ and
 $Ri_{c}$ when
 $F_{h}$ or
 $k_{z}$ are increased. Surprisingly, the agreement between the asymptotics and numerics for
 $\unicode[STIX]{x2202}v_{c}^{\ast }/\unicode[STIX]{x2202}z$ and
 $\unicode[STIX]{x2202}b_{c}/\unicode[STIX]{x2202}z$ remains satisfactory even if
 $k_{z}F_{h}$ has been increased up to unity. Regarding
 $\unicode[STIX]{x2202}u_{c}^{\ast }/\unicode[STIX]{x2202}z$ (figure 14a), a large discrepancy is always observed like in figure 13(a). When
 $F_{h}$ is increased from
 $F_{h}=0.1$ (dashed-dotted lines) to
 $F_{h}=0.5$ (solid lines), keeping the wavenumber constant
 $k_{z}=2$,
 $\unicode[STIX]{x2202}v_{c}^{\ast }/\unicode[STIX]{x2202}z$ and
 $\unicode[STIX]{x2202}b_{c}/\unicode[STIX]{x2202}z$ decrease (figure 14b,c) while
 $\unicode[STIX]{x2202}u_{c}^{\ast }/\unicode[STIX]{x2202}z$ increases (figure 14a). The maxima of
 $\unicode[STIX]{x2202}u_{c}^{\ast }/\unicode[STIX]{x2202}z$ and
 $\unicode[STIX]{x2202}v_{c}^{\ast }/\unicode[STIX]{x2202}z$ become even of the same magnitude for
 $F_{h}=0.5$, in sharp contrast to what was observed in figure 13. Large oscillations are present in the DNS for
 $F_{h}=0.5$ (figure 14). We have checked that they are not due to the internal waves that have been neglected in the asymptotics. They seem rather related to some vortex waves since
 $\unicode[STIX]{x2202}u_{c}^{\ast }/\unicode[STIX]{x2202}z$ and
 $\unicode[STIX]{x2202}v_{c}^{\ast }/\unicode[STIX]{x2202}z$ oscillate out of phase, as also observed in figure 5(b).
In contrast, when  $k_{z}$ is increased from
 $k_{z}=2$ (dashed-dotted lines in figure 14) to
 $k_{z}=5$ (dotted lines) keeping the Froude number constant
 $F_{h}=0.1$, the vertical shear and the buoyancy vertical gradient saturate earlier and at higher levels.
The minimum of the Richardson number decreases as  $k_{z}$ or
 $F_{h}$ increases (figure 14d). The asymptotic and numerical Richardson numbers remain in rough agreement even for
 $F_{h}=0.5$ (solid lines) despite the large increase of
 $\unicode[STIX]{x2202}u_{c}^{\ast }/\unicode[STIX]{x2202}z$ as
 $F_{h}$ increases. In particular, the minimum values are
 $\min (Ri_{c})\simeq 0.95$ and
 $\min (Ri_{c})\simeq 0.6$, respectively. The minimum of the asymptotic Richardson number is lower than the bound
 $\min (Ri_{c})>3.43$ derived in Part 1 for
 $k_{z}F_{h}\ll 1$ since
 $k_{z}F_{h}=O(1)$. We can notice that the beginning of the evolution of the Richardson number for
 $(F_{h}=0.25,k_{z}=2)$ (dashed lines) is similar to the one for
 $(F_{h}=0.1,k_{z}=5)$ (dotted lines) (figure 14d) since
 $k_{z}F_{h}=0.5$ in both cases. The subsequent evolutions differ because the buoyancy Reynolds numbers are different:
 $Re_{b}=1500$ and
 $Re_{b}=60$, respectively.
Similar agreements have been observed for other values of  $U_{S}$ and
 $Re$.
5 Evolution of the Richardson number for finite $k_{z}F_{h}$

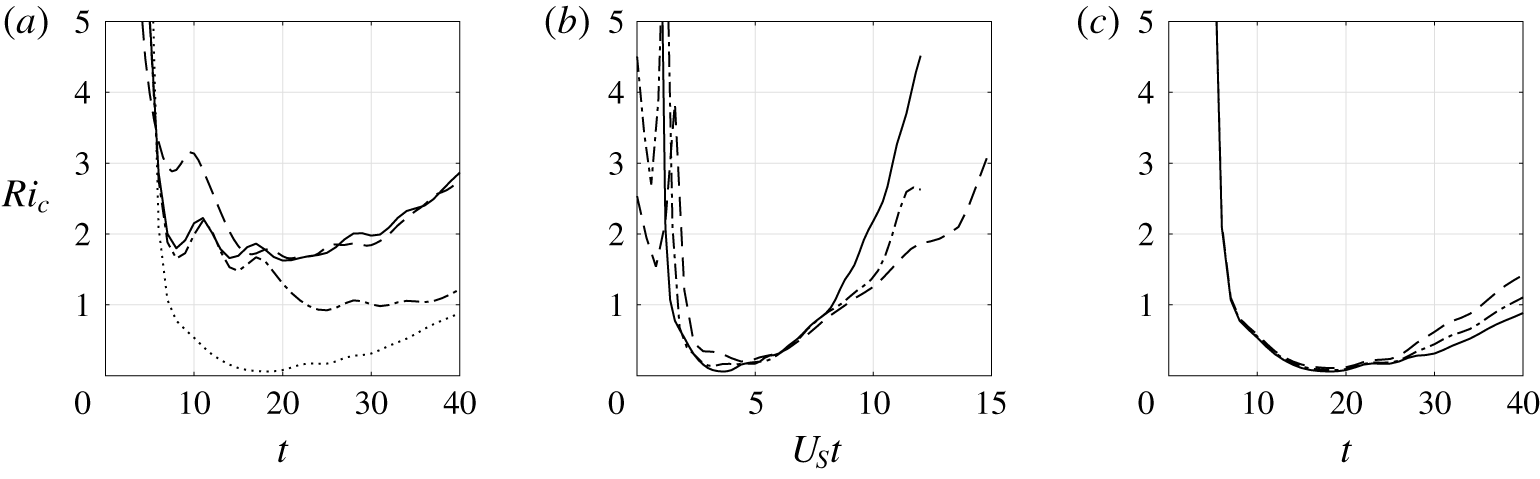
In this section, we now study the regime of finite  $k_{z}F_{h}$ mainly based on the DNS since the long-wavelength analysis is a priori no longer expected to be valid. Figure 15(a) displays the evolution of the Richardson number in the DNS at the vortex centre at
 $z=l_{z}/2$ for four particular combinations of the parameters
 $(k_{z},F_{h},Re)$. It is interesting to compare two curves at a time. First, the solid and dashed lines correspond to different Froude numbers
 $F_{h}=0.5$ and
 $F_{h}=0.25$, respectively, but with the same values of the rescaled wavenumber
 $k_{z}F_{h}=\unicode[STIX]{x03C0}/4$ and of the buoyancy Reynolds number
 $ReF_{h}^{2}=375$. These two curves superpose quite well apart from the oscillations. Similarly, the dashed and dashed dotted lines share the same values of
 $k_{z}F_{h}=\unicode[STIX]{x03C0}/4$ and of Reynolds number
 $Re=6000$ but have a different buoyancy Reynolds number. In this case, the evolutions of
 $Ri_{c}$ differ. Finally, the dashed and dotted lines have the same wavenumber
 $k_{z}=\unicode[STIX]{x03C0}$ and Reynolds number
 $Re=6000$ but different Froude numbers. In this case also, the evolution of
 $Ri_{c}$ differs widely as already seen before in figure 14. Altogether, this demonstrates that
 $Ri_{c}$ depends mainly on
 $(k_{z},F_{h},Re)$ only through the two parameters
 $k_{z}F_{h}$ and
 $ReF_{h}^{2}$. The same conclusion can be drawn from other sets of parameters.
Similarly, figure 15(b) shows the evolution of  $Ri_{c}$ for different values of
 $U_{S}$ for
 $k_{z}=\unicode[STIX]{x03C0}$,
 $F_{h}=0.5$,
 $Re=6000$. The time has been rescaled by
 $U_{S}$ in this case. The different curves are very close to each other, indicating that
 $U_{S}$ has only a weak effect on the Richardson number. Finally, figure 15(c) shows that the Reynolds number has only a small influence on the evolution of
 $Ri_{c}$ when it is sufficiently large and when the other parameters are kept constant.
Evolution of the Richardson number at the vortex centre at  $z=l_{z}/2$ for
 $U_{S}=0.2$ and for (a)
 $k_{z}=\unicode[STIX]{x03C0}/2$,
 $F_{h}=0.5$,
 $Re=1500$ (solid line),
 $k_{z}=\unicode[STIX]{x03C0}/2$,
 $F_{h}=0.5$,
 $Re=6000$ (dash-dotted line),
 $k_{z}=\unicode[STIX]{x03C0}$,
 $F_{h}=0.25$,
 $Re=6000$ (dashed line),
 $k_{z}=\unicode[STIX]{x03C0}$,
 $F_{h}=0.5$,
 $Re=6000$ (dotted line). (b)
 $Ri_{c}$ as a function of
 $U_{S}t$ for
 $Re=6000$,
 $k_{z}=\unicode[STIX]{x03C0}$,
 $F_{h}=0.5$ and
 $U_{S}=0.2$ (solid line),
 $U_{S}=0.3$ (dash-dotted line) and
 $U_{S}=0.4$ (dashed line). (c)
 $Ri_{c}$ as a function of
 $t$ for
 $k_{z}=\unicode[STIX]{x03C0}$,
 $F_{h}=0.5$,
 $U_{S}=0.2$ and
 $Re=6000$ (solid line),
 $Re=5000$ (dash-dotted line) and
 $Re=4000$ (dashed line).

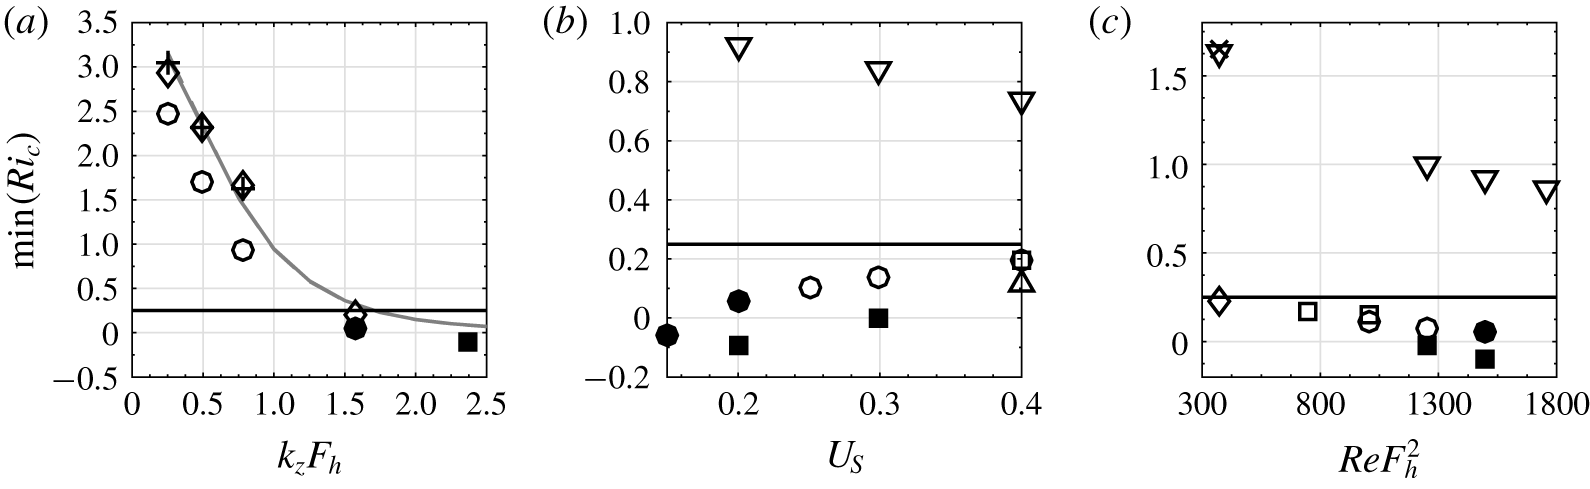
Minimum Richardson number in numerical simulations (symbols) at the vortex centre at  $z=l_{z}/2$ as a function of (a)
 $k_{z}F_{h}$, (b)
 $U_{S}$ and (c)
 $ReF_{h}^{2}$. The different symbols/lines correspond to (a):
 $F_{h}=0.5$,
 $Re=6000$ (circles),
 $F_{h}=0.25$,
 $Re=6000$ (diamonds),
 $F_{h}=0.5$,
 $Re=1500$ (plus sign) for
 $U_{S}=0.2$; (b):
 $F_{h}k_{z}=\unicode[STIX]{x03C0}/4$ (downward triangle),
 $F_{h}k_{z}=\unicode[STIX]{x03C0}/2$ (circles),
 $F_{h}k_{z}=3\unicode[STIX]{x03C0}/4$ (squares) and
 $F_{h}k_{z}=\unicode[STIX]{x03C0}$ (upward triangle) for
 $F_{h}=0.5$,
 $Re=6000$; (c):
 $F_{h}k_{z}=\unicode[STIX]{x03C0}/4$,
 $F_{h}=0.5$ (downward triangle),
 $F_{h}k_{z}=\unicode[STIX]{x03C0}/4$,
 $F_{h}=0.25$ (cross),
 $F_{h}k_{z}=\unicode[STIX]{x03C0}/2$,
 $F_{h}=0.5$ (circles),
 $F_{h}k_{z}=\unicode[STIX]{x03C0}/2$,
 $F_{h}=0.25$ (diamonds) and
 $F_{h}k_{z}=3\unicode[STIX]{x03C0}/4$,
 $F_{h}=0.5$ (squares) for
 $U_{S}=0.2$. Filled and empty symbols correspond to runs where the shear instability develops or not, respectively. The grey lines in (a) represent the asymptotic predictions for
 $F_{h}=0.5$ (solid line) and
 $F_{h}=0.25$ (dashed line) for
 $Re=6000$,
 $U_{S}=0.2$ (they are indistinguishable). The horizontal solid lines indicate the threshold
 $\min (Ri_{c})=1/4$.

The minimum value of the Richardson number  $\min (Ri_{c})$ reached in most of the DNS is further summarized in figure 16 as a function of the three main parameters:
 $k_{z}F_{h}$,
 $U_{S}$ and
 $ReF_{h}^{2}$. A filled symbol is used when the shear instability is observed and an open symbol, otherwise. When the shear instability develops, the minimum Richardson number is then generally negative owing to the overturnings induced by the instability. However, this negative value has no particular meaning except the fact that it is below the threshold
 $1/4$. As seen in figure 16(a),
 $\min (Ri_{c})$ decreases with
 $k_{z}F_{h}$ and goes below
 $1/4$ when
 $k_{z}F_{h}\gtrsim 1.6$ for both
 $F_{h}=0.25$ (diamonds) and
 $F_{h}=0.5$ (circles) for
 $Re=6000$. However, the shear instability has been observed only for
 $F_{h}=0.5$. For
 $F_{h}=0.25$, the minimum Richardson number is just below
 $1/4$:
 $\min (Ri_{c})=0.2$ for the highest wavenumber that has been investigated
 $k_{z}F_{h}=1.6$. It is likely that the shear instability would be also triggered for
 $F_{h}=0.25$ if a larger value of
 $k_{z}F_{h}$ were investigated. As shown previously, the differences between the minimum Richardson number for
 $F_{h}=0.25$ and
 $F_{h}=0.5$ are due to the difference in buoyancy Reynolds number
 $Re_{b}=ReF_{h}^{2}$. Indeed, the symbols plus, corresponding also to
 $F_{h}=0.5$ but with the lower Reynolds number
 $Re=1500$, are almost superposed on those for
 $F_{h}=0.25$,
 $Re=6000$ which have the same buoyancy Reynolds number. Remarkably, the dependence of
 $\min (Ri_{c})$ with
 $k_{z}F_{h}$ is well reproduced by the asymptotics (lines) even if the time evolution of
 $Ri_{c}$ differs in the numerics and the asymptotics for
 $k_{z}F_{h}=O(1)$ (figure 14). In particular, the asymptotic minimum Richardson number goes below
 $1/4$ when
 $k_{z}F_{h}\gtrsim 1.7$ almost independently of
 $F_{h}$,
 $U_{S}$ and for a wide range of
 $Re$.
Figure 16(b) shows that  $\min (Ri_{c})$ increases slightly with
 $U_{S}$ for
 $k_{z}F_{h}=\unicode[STIX]{x03C0}/2$ and
 $k_{z}F_{h}=3\unicode[STIX]{x03C0}/4$ but decreases when
 $k_{z}F_{h}=\unicode[STIX]{x03C0}/4$ for
 $F_{h}=0.5$ and
 $Re=6000$. For
 $k_{z}F_{h}=\unicode[STIX]{x03C0}/2$ and
 $F_{h}k_{z}=3\unicode[STIX]{x03C0}/4$,
 $\min (Ri_{c})$ is always below
 $1/4$ but the shear instability develops only if
 $\min (Ri_{c})$ is sufficiently smaller than this threshold. It has been observed for
 $U_{S}=0.2$ for both
 $k_{z}F_{h}=\unicode[STIX]{x03C0}/2$ and
 $k_{z}F_{h}=3\unicode[STIX]{x03C0}/4$. In contrast, for
 $U_{S}=0.3$, the shear instability occurs when
 $k_{z}F_{h}=3\unicode[STIX]{x03C0}/4$ but not for
 $k_{z}F_{h}=\unicode[STIX]{x03C0}/2$ while for
 $U_{S}=0.4$, no instability has been observed for both wavenumbers. An additional simulation for
 $U_{S}=0.4$,
 $F_{h}=0.5$ at higher
 $k_{z}F_{h}$:
 $k_{z}F_{h}=\unicode[STIX]{x03C0}$, still does not exhibit the shear instability even if
 $\min (Ri_{c})$ is well below
 $1/4$:
 $\min (Ri_{c})=0.11$. The development of the shear instability could be less favoured as
 $U_{S}$ increases because the time interval
 $\unicode[STIX]{x0394}t$ during which
 $\min (Ri_{c})$ is below
 $1/4$ becomes shorter. Indeed, figure 15(b) shows that the evolution of
 $Ri_{c}$ is almost independent of
 $U_{S}$ when represented as a function of
 $U_{S}t$, implying that
 $\unicode[STIX]{x0394}t$ decreases with
 $U_{S}$. Thus, the shear instability has less time to develop for large
 $U_{S}$ if its growth rate is assumed to be independent of
 $U_{S}$.
The minimum Richardson number also decreases slightly as the buoyancy Reynolds number increases (figure 16c). Hence, the shear instability develops only for sufficiently high Reynolds number: when  $ReF_{h}^{2}\geqslant 1500$ for
 $k_{z}F_{h}=\unicode[STIX]{x03C0}/2$ and when
 $ReFh^{2}\geqslant 1250$ for
 $k_{z}F_{h}=3\unicode[STIX]{x03C0}/4$. In addition to the slight decrease of
 $\min (Ri_{c})$ as the buoyancy Reynolds number increases, the lower viscous damping should also favour the growth of the shear instability.
6 Conclusion
We have performed direct numerical simulations of the evolution of an initially columnar vortex in an ambient shear flow in a strongly stratified fluid. The numerical results have been compared to the asymptotic analysis carried out in Part  $1$.
The DNS show that the vortex is progressively bent in the direction of the shear flow but is also deviating in the orthogonal direction. The decay of its potential vorticity is enhanced in the regions of high shear. For  $k_{z}F_{h}\gtrsim 1.6$ and sufficiently high buoyancy Reynolds number
 $ReF_{h}^{2}$, the Kelvin–Helmholtz instability is first triggered in the centre of the vortex at the vertical levels where the ambient vertical shear is maximum, i.e.
 $z=0,l_{z}/2$. For the other parameters for which the shear instability does not develop, the Richardson number reaches its minimum at the same locations. We have therefore concentrated our efforts on a comparison of the evolution of the flow at this location to the predictions of the long-wavelength asymptotic analysis performed for
 $k_{z}F_{h}\ll 1$ in Part
 $1$.
For sufficiently small  $k_{z}F_{h}$, the long-wavelength asymptotic analysis turns out to predict accurately the deformations of the vortex axis, as well as the evolution of the vertical shear of the vortex in the spanwise direction
 $\unicode[STIX]{x2202}v_{c}^{\ast }/\unicode[STIX]{x2202}z$ and of the vertical gradient of the buoyancy
 $\unicode[STIX]{x2202}b_{c}/\unicode[STIX]{x2202}z$ at the vortex centre at
 $z=l_{z}/2$. The prediction for the streamwise shear of the vortex
 $\unicode[STIX]{x2202}u_{c}^{\ast }/\unicode[STIX]{x2202}z$ is not accurate but this is not dramatic since it is one order smaller in
 $(k_{z}F_{h})^{2}$ than
 $\unicode[STIX]{x2202}v_{c}^{\ast }/\unicode[STIX]{x2202}z$ and
 $\unicode[STIX]{x2202}b_{c}/\unicode[STIX]{x2202}z$. Hence, the Richardson number at the vortex centre and
 $z=l_{z}/2$ based on these asymptotic expressions is in good agreement with the DNS provided that
 $k_{z}F_{h}$ is small.
From the numerical simulations, we have found that the minimum Richardson number in the centre of the vortex at  $z=l_{z}/2$ goes below
 $1/4$ only when
 $k_{z}F_{h}$ is finite:
 $k_{z}F_{h}\gtrsim 1.6$. Remarkably, this threshold agrees with that predicted by the asymptotics
 $k_{z}F_{h}\gtrsim 1.7$ even if it is beyond its range of validity (
 $k_{z}F_{h}\ll 1$). Nevertheless, the shear instability develops only if the minimum Richardson number is sufficiently smaller than
 $1/4$. In addition, the buoyancy Reynolds number has to be sufficiently large. Decreasing the velocity of the shear flow tends also to favour the shear instability.
In summary, the conditions for the development of the Kelvin–Helmholtz instability when a two-dimensional vortex is subjected to an external stratified shear flow depend mostly on the intensity of the vortex itself  $\unicode[STIX]{x1D6E4}/(2\unicode[STIX]{x03C0}a_{0}^{2})$ and little on the dimensional amplitude
 $\hat{U} _{S}$ of the shear flow. Indeed, the minimum Richardson number of the shear flow
 $Ri_{s}=N^{2}/(\hat{k}_{z}\hat{U} _{S})^{2}$ can be arbitrarily large. In this sense, the ambient shear flow can be seen as only a catalyst. Nevertheless, the dimensional wavenumber
 $\hat{k}_{z}$ of the shear flow has to satisfy the condition
 $\hat{k}_{z}a_{0}F_{h}\gtrsim O(1)$. This condition ensures that the typical order of magnitude of the Richardson number when the vortex will be bent over the vertical length scale
 $2\unicode[STIX]{x03C0}/\hat{k}_{z}$, i.e.
 $Ri\sim N^{2}/(\hat{k}_{z}\unicode[STIX]{x1D6E4}/(2\unicode[STIX]{x03C0}a_{0}^{2}))^{2}=1/(\hat{k}_{z}a_{0}F_{h})^{2}$, will be lower than unity.
We can try to extrapolate these results to stratified turbulence forced two-dimensionally in the horizontal plane (Waite & Bartello Reference Waite and Bartello2004; Lindborg Reference Lindborg2006; Brethouwer et al. Reference Brethouwer, Billant, Lindborg and Chomaz2007; Augier et al. Reference Augier, Billant, Negretti and Chomaz2014; Augier, Billant & Chomaz Reference Augier, Billant and Chomaz2015). Indeed, in this case, columnar structures are continuously generated by the forcing within a pre-existing turbulence with a layered structure. Such structure is likely to contain shear flows with the same vertical length scale. Since the vertical length scale of the layers typically scales as the buoyancy length scale  $L_{v}\sim F_{h}L_{h}$, we should have
 $2\unicode[STIX]{x03C0}L_{h}/L_{v}F_{h}\sim O(1)$, i.e. the condition
 $k_{z}F_{h}\gtrsim O(1)$ should be met. Therefore, as soon as they are generated by the forcing, columnar structures may be destabilized into small scales by the shear instability. It is worth pointing out that this process may occur even if the magnitudes of the shear flow components are small since we have seen that the dynamics in the case of a single vortex depends weakly on
 $U_{S}$. This also suggests that the so-called shear modes often present in numerical simulations of stratified turbulence (Lindborg Reference Lindborg2006; Augier et al. Reference Augier, Billant and Chomaz2015) may have an important effect even if they are weak.
In the future, it would be interesting to consider the additional effect of a Coriolis force in order to better understand the effect of an ambient shear flow on cyclones and more generally on geophysical vortices.
Acknowledgements
We thank D. Guy and V. Toai for technical assistance, and I. Delbende, F. Godeferd, S. Le Dizès, L. Oruba, R. Plougonven and the referees for helpful comments. This work was granted access to the HPC resources of IDRIS under the allocation 2016-A0062A07419 attributed by GENCI (Grand Equipement National de Calcul Intensif).
Declaration of interests
The authors report no conflict of interest.