Introduction
The order Rodentia is the largest and most varied among mammals. It has recently been divided into five suborders according to features of the skull (Carleton & Musser, Reference Carleton, Musser, Wilson and Reeder2005): Sciuromorpha Brandt, 1855; Castorimorpha Wood, 1955; Myomorpha Brandt, 1855; Anomaluromorpha Bugge, 1974; and Hystricomorpha Brandt, 1855. All suborders comprise species with marked differences regarding their habitats and lifestyles (diurnal, crepuscular, or nocturnal). This variety suggests that a broad gamut of retinal adaptations has evolved within these suborders. That is one of many reasons why rodents were favored in several studies of comparative visual neurobiology (Silveira et al., Reference Silveira, Picanço-Diniz and Oswaldo-Cruz1989; Jacobs, Reference Jacobs1993; Szél et al., Reference Szél, Rohlich, Caffe and van Veen1996; Ahnelt & Kolb, Reference Ahnelt and Kolb2000). Many rodents have two different cone visual pigments, one being more sensitive to short wavelengths and having its maximum absorbance in the ultraviolet (UV) or violet regions of the spectrum (termed for convenience S-opsin), and the other being more sensitive to middle and long wavelengths and having its maximum absorbance in the green or yellow regions of the spectrum (termed for convenience L-opsin). Behavioral tests have shown that these rodents are endowed with dichromatic color vision (review by Jacobs, Reference Jacobs1993). Other rodents have only cones with a single L-opsin and are monochromats (review by Ahnelt & Kolb, Reference Ahnelt and Kolb2000; Peichl, Reference Peichl2005). These rodents, which are predominantly nocturnal, have lost their functional S-opsin, and this has been related to the dispensability of color vision in low-light conditions (Peichl, Reference Peichl2005; Carvalho et al., Reference Carvalho, Cowing, Wilkie, Bowmaker and Hunt2006). However, it is noteworthy that most nocturnal mammals have retained two core types, perhaps to provide color vision when they happen to be out at dawn and dusk.
The identify and distribution of photoreceptors have been studied in several rodents, using both classical morphological methods and immunocytochemistry to identify visual pigments. These studies included Myomorpha such as mouse, rat, pocket gopher, and African giant rat (Jacobs et al., Reference Jacobs, Neitz and Deegan1991, Reference Jacobs, Fenwick and Williams2001, Reference Jacobs, Williams and Fenwick2004; Szél & Rohlich, Reference Szél and Rohlich1992; Deegan & Jacobs, Reference Deegan and Jacobs1993; Rohlich et al., Reference Rohlich, van Veen and Szél1994; Szél et al., Reference Szél, Csorba, Caffe, Szél, Rohlich and van Veen1994; Calderone & Jacobs, Reference Calderone and Jacobs1995; Peichl & Moutairou, Reference Peichl and Moutairou1998; Lyubarsky et al., Reference Lyubarsky, Falsini, Pennesi, Valentini and Pugh1999; Applebury et al., Reference Applebury, Antoch, Baxter, Chun, Falk, Farhangfar, Kage, Krzystolik, Lyass and Robbins2000; Glösmann & Ahnelt, Reference Glösmann and Ahnelt2002; Lukáts et al., Reference Lukáts, Dkhissi-Benyahya, Szepessy, Rohlich, Vigh, Bennett, Cooper and Szél2002; Haverkamp et al., Reference Haverkamp, Wässle, Duebel, Kuner, Augustine, Feng and Euler2005; Williams et al., Reference Williams, Calderone and Jacobs2005); Sciuromorpha such as the ground squirrel and flying squirrel (Jacobs & Yolton, Reference Jacobs and Yolton1969, Reference Jacobs and Yolton1971; Long & Fisher, Reference Long and Fisher1983; Ahnelt, Reference Ahnelt1985; Szél & Rohlich, Reference Szél and Rohlich1988; Szél et al., Reference Szél, von Schantz, Rohlich, Farber and van Veen1993; Kryger et al., Reference Kryger, Galli-Resta, Jacobs and Reese1998; Carvalho et al., Reference Carvalho, Cowing, Wilkie, Bowmaker and Hunt2006); and Hystricomorpha such as guinea pig (Jacobs & Deegan, Reference Jacobs and Deegan1994; Peichl & González-Soriano, Reference Peichl and González-Soriano1994; Parry & Bowmaker, Reference Parry and Bowmaker2002), degu (Jacobs et al., Reference Jacobs, Calderone, Fenwick, Krogh and Williams2003), African mole-rats (Peichl et al., Reference Peichl, Nĕmec and Burda2004), and cururo (Peichl et al., Reference Peichl, Chavez, Ocampo, Mena, Bozinovic and Palacios2005).
An interesting feature found in some myomorphs and hystricomorphs is the colocalization of S- and L-opsins in individual cones which are then commonly termed dual-pigment cones (Szél et al., Reference Szél, Lukáts, Fekete, Szepessy and Rohlich2000; Lukáts et al., Reference Lukáts, Dkhissi-Benyahya, Szepessy, Rohlich, Vigh, Bennett, Cooper and Szél2002, Reference Lukáts, Szabo, Rohlich, Vigh and Szél2005; Peichl et al., Reference Peichl, Nĕmec and Burda2004; Haverkamp et al., Reference Haverkamp, Wässle, Duebel, Kuner, Augustine, Feng and Euler2005). For example, the majority of cones in the mouse retina are dual-pigment cones (Glösmann & Ahnelt, Reference Glösmann and Ahnelt1998; Applebury et al., Reference Applebury, Antoch, Baxter, Chun, Falk, Farhangfar, Kage, Krzystolik, Lyass and Robbins2000; Haverkamp et al., Reference Haverkamp, Wässle, Duebel, Kuner, Augustine, Feng and Euler2005).
In the present work, we used immunocytochemistry with cone opsin–specific antibodies to study the retinal topography and mosaic regularity of cone photoreceptors of the agouti (Dasyprocta aguti), a hystricomorph rodent of large body size displaying a predominantly diurnal, visually guided behavior. The agouti’s visual system has been the subject of several studies concerning eye optics (Oswaldo-Cruz et al., Reference Oswaldo-Cruz, Picanço-Diniz and Silveira1985), horizontal cell morphology and density (de Lima et al., Reference de Lima, Ahnelt, Carvalho, Silveira, Rocha, Saito and Silveira2005), ganglion cell morphology and density (Silveira et al., Reference Silveira, Picanço-Diniz and Oswaldo-Cruz1989; Gomes et al., Reference Gomes, Yamada and Silveira1998), and visual cortex morphology and physiology (Picanço-Diniz et al., Reference Picanço-Diniz, Oliveira, Silveira and Oswaldo-Cruz1989, Reference Picanço-Diniz, Silveira, de Carvalho and Oswaldo-Cruz1991, Reference Picanço-Diniz, Silveira, Oswaldo-Cruz and Lent1992; Costa et al., Reference Costa, do Nascimento, Picanço-Diniz, da Silva Filho and Quaresma1996; Elston et al., Reference Elston, Elston, Aurelio-Freire, Leal, Dias, Pereira, Silveira and Picanço-Diniz2006). Part of the present results have previously been presented in abstract form (de Lima et al., Reference de Lima, Rocha, Hokoc and Ahnelt2001).
Materials and methods
Animals and tissue preparation
The eyes were obtained from eight adult orange-rumped agoutis, Dasyprocta aguti, which were available from the animal breeding facility of the Universidade Federal do Pará (Belém, Brazil) and cared for in accordance with the guidelines of the NIH Guide for Care and Use of Laboratory Animals. The agoutis were euthanized with a 50 mg/kg lethal intraperitoneal injection of sodium thiopental (Thionembutal; Abbott, São Paulo, Brazil), and the eyes were enucleated immediately after death. The dorsoventral and nasotemporal axes of the eye were recorded for later orientation of the retina. The cornea and lens were removed. For whole mounts, the retinas were dissected out from the eyecups and fixed by immersion for 3 h in 4% paraformaldehyde in 0.1 M phosphate buffer (PB), pH 7.4. The retinas were then maintained in phosphate-buffered saline (PBS). For vertical 20-μm-thick sections, selected areas were sectioned on a cryostat (Jung CM 3000; Leica, Nussloch, Germany). For serial semithin sections (1 μm), tissue blocks were dehydrated and embedded in Spurr’s epoxy resin. Different antibodies were used on consecutive sections to probe for coexpression of different opsins in individual cones (Lukáts et al., Reference Lukáts, Dkhissi-Benyahya, Szepessy, Rohlich, Vigh, Bennett, Cooper and Szél2002).
Some whole-mounted retinas had the pigment epithelium firmly attached to the neural retina preventing the visualization of immunopositive cells. To overcome this problem, before immunocytochemistry the pigment was bleached for 1 h using 10% H2O2 in PBS with one drop of 27% ammonia per 10 ml (Hemmi & Grünert, Reference Hemmi and Grünert1999).
Antibodies
Spectral cone types were identified by immunocytochemistry. The primary antibodies were two rabbit polyclonal antibodies, JH492 against L-cone opsin and JH455 against S-cone opsin (kindly provided by Jeremy Nathans, Johns Hopkins University School of Medicine, Baltimore, MD). For double labeling, we also used the goat polyclonal antibody sc-14363 against S-cone opsin (Santa Cruz Biotechnology, Santa Cruz, CA). Rod opsin was detected by the mouse monoclonal antibody rho4D2 (kindly provided by Robert Molday, University of British Columbia, Vancouver, Canada).
Antisera JH492 and JH455 have been characterized by Wang et al. (Reference Wang, Macke, Merbs, Zack, Klaunberg, Bennett, Gearhart and Nathans1992). They are directed against the last 38 amino acids (C-terminal) of the human red pigment and the last 42 amino acids (C-terminal) of the human blue pigment, respectively, and have been shown to specifically label the L- and S-opsins in a wide range of mammalian species including rodents. A full description of their characteristics and staining properties has recently been given (Schiviz et al., Reference Schiviz, Ruf, Kuebber-Heiss, Schubert and Ahnelt2008). Antiserum sc-14363 is directed against a 20–amino acid peptide at the N-terminus of the human blue opsin (for a full characterization, see Schiviz et al., Reference Schiviz, Ruf, Kuebber-Heiss, Schubert and Ahnelt2008). It has also been shown to specifically label the S-opsin in a range of mammals. Antibody rho4D2 is directed against the N-terminal region of bovine rod opsin (for characterization, see Hicks & Molday, Reference Hicks and Molday1986). It has been shown to specifically label the rod opsin in a wide range of mammals including rodents (Kryger et al., Reference Kryger, Galli-Resta, Jacobs and Reese1998; Peichl et al., Reference Peichl, Nĕmec and Burda2004, Reference Peichl, Chavez, Ocampo, Mena, Bozinovic and Palacios2005).
Immunocytochemistry
Rod opsin was labeled in vertical frozen sections on the slide. Sections were preincubated for 1 h in 10% normal donkey serum (NDS) and 0.25% Triton X-100 in PB to block nonspecific binding sites. Then, they were incubated overnight in the primary antibody rho4D2, diluted 1:500 in PB with 3% NDS and 0.5% Triton X-100, rinsed three times in PBS for 10 min each, and incubated in Cy5-conjugated donkey anti-mouse immunoglobulin G (IgG) antiserum for 1 h.
For cone opsin labeling, whole retinas were processed free floating and preincubated for 1 h in 10% normal goat serum and 0.25% Triton X-100 in PBS to block nonspecific binding sites. Then, they were incubated in the primary antiserum (JH455 or JH492, respectively), diluted 1:10,000 in 0.25% Triton X-100 in PBS during 2 days, rinsed three times in PBS for 10 min each, and incubated in secondary biotinylated goat anti-rabbit IgG (1:200; Vector Laboratories), diluted in 0.25% Triton X-100 in PBS overnight. Subsequently, they were rinsed in PBS and incubated in avidin–biotin–peroxidase complex for 60 min (ABC solution, 1:250 in PBS; Vector Laboratories). Finally, the staining was revealed in a medium containing Vector SG (peroxidase substrate kit, SK 4700; Vector Laboratories) as the chromogen. The reaction was monitored using a binocular microscope and interrupted when labeled cone outer segments were observed. After the reaction had been interrupted, the retina was rinsed in PBS and mounted with the receptor layer faceup on a clean glass slide in 70% glycerol in 0.1 M PB.
Double labeling for L- and S-cone opsins was performed by incubating the retina in a mixture of antisera JH492 (diluted 1:2000) and sc-14363 (diluted 1:500). In this case, visualization was by incubation with a mixture of Cy5-conjugated donkey anti-goat IgG and Alexa 488–conjugated donkey anti-rabbit IgG.
Controls for antibody specificity
Albeit all opsin antibodies used here have produced specific labeling in a wide range of mammals, we considered their specificity for agouti opsins. For all of them, label was restricted to photoreceptors. The rod opsin antibody rho4D2 labeled outer segments strongly and other parts of the photoreceptor faintly. This is the typical rho4D2 labeling pattern observed in the rods of all studied species, strongly suggesting that in agouti the labeling is also rod-specific. The labeling with all cone opsin antibodies was restricted to the outer segments, suggesting selective binding to the opsins. JH492 and JH455 showed mutually exclusive labeling of photoreceptor subpopulations (Fig. 3), demonstrating that they recognize different opsins. This suggests specificity also for the agouti L- and S-cone opsins, respectively. The same mutual exclusivity holds for the labeling of JH492 versus sc-14363 (Fig. 4). Double immunofluorescence labeling with JH455 and sc-14363 (not illustrated) showed complete colocalization of the two labels, demonstrating that both antisera recognize the same S-opsin. The nonoverlapping labeling of the L- and S-opsin–specific antisera further showed that the secondary antibodies did not display species cross-reactivity. Omission of the primary antibodies from the immunostaining protocol resulted in no labeling, showing that the secondary antibodies did not unspecifically label any photoreceptor proteins.
Topographic analysis of photoreceptor densities
Cone topography was studied in retinal whole mounts applying the systematic random method of counting (Weibel, Reference Weibel1969). Cones in ABC-reacted retinas were observed using a triocular microscope (Eclipse E600; Nikon, Tokyo, Japan), ×100 oil immersion objective, ×1000 final magnification, and phase contrast. They were counted in sample fields of 96 × 96 μm, spaced at 1-mm intervals across the whole retina. Additional sample fields with a denser spacing were analyzed in the visual streak and in a dorsoventral stripe, perpendicular to the visual streak, crossing the optic disk. The counts were converted to cones per square millimeters and entered on maps of the whole-mounted retinas. Then, isodensity contours were drawn and converted into color-coded isodensity maps using DeltaGraph 4.0 software (DeltaPoint, Monterey, CA). The total cone population was estimated by integration of the isodensity areas.
Additional cone density counts were made on a retina labeled for L- and S-cones by double immunofluorescence. At several retinal positions, fluorescence micrographs were taken with a ×40 objective on a Zeiss Axioplan 2 microscope equipped with epifluorescence using a CCD camera and the AxioVision LE software (Carl Zeiss Vision, Oberkochen, Germany). The same positions were also photographed with differential interference contrast (DIC) optics to capture all photoreceptors. Images were adjusted for brightness and contrast with Adobe PhotoShop and printed. The densities of spectral cone types and of all photoreceptors were counted in these prints. Local comparison of total photoreceptor density and cone density then yielded rod densities and rod:cone ratios.
Cone mosaic spatial regularity analysis
Using the optic disk as a landmark, cone mosaics were sampled at 1-mm intervals along the dorsoventral axis in retinas immunolabeled for S- and L-opsins, respectively. Using a ×40 oil immersion objective, images from 22 fields for S-cones (500 × 500 μm) and 22 fields for L-cones (250 × 250 μm) were digitized with a high-resolution digital camera (Coolpix 4500; Nikon) mounted on the Eclipse E600 microscope. Cone inner segments were identified in the digitized images, and their Cartesian coordinates were determined using the Scion Image software (http://www.scioncorp.com, Scion Corporation, Frederick, MD).
The cone mosaics were analyzed using a homemade density recovery profile (DRP) software to compute the packing factor (PF). The PF is an adimensional parameter used as an indirect measure of the mosaic regularity, ranging from 0 for a Poisson distribution such as an ideal random mosaic to 1 for a hexagonal distribution like a crystalline mosaic (Rodieck, Reference Rodieck1991; Kouyama & Marshak, Reference Kouyama and Marshak1997; Martin & Grünert, Reference Martin and Grünert1999; Martin et al., Reference Martin, Grünert, Chan and Bumsted2000; Cornish et al., Reference Cornish, Hendrickson and Provis2004). An autocorrelogram radius of 25 μm (for L-cone fields) or 50 μm (for S-cone fields) together with a bin width of 5 μm (for L-cone fields) or 10 μm (for S-cone fields) were chosen to yield a reliability factor (K) of approximately 6, which allowed a direct comparison between mosaics with different areas and densities (Rodieck, Reference Rodieck1991; Martin et al., Reference Martin, Grünert, Chan and Bumsted2000; Cornish et al., Reference Cornish, Hendrickson and Provis2004).
Results
Rod photoreceptors
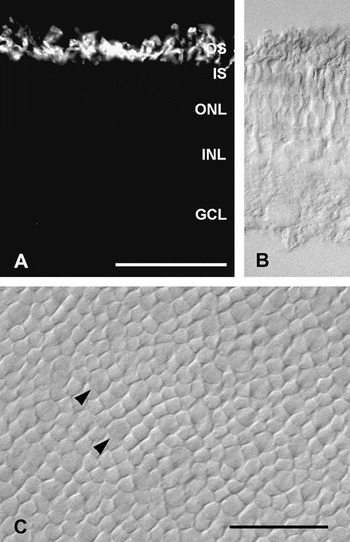
Rods were identified by immunoreacting vertical cryostat sections with an antibody against mammalian rod opsin. Fig. 1A shows strong and selective labeling of photoreceptor outer segments, demonstrating the presence of a substantial rod population. As typical with this antibody, rod somata in the outer nuclear layer (ONL) also were faintly immunoreactive, but this is not visible with the exposure time used in Fig. 1A. Rod somata were located in the inner part of the ONL, their common position in mammals. Fig. 1B shows part of the same section by DIC optics to reveal all retinal layers. The ONL has only two to three tiers of nuclei indicating a low photoreceptor density.
Agouti photoreceptors. (A) Rod opsin immunofluorescence on a transverse cryosection a showing specific labeling of a dense population of rod outer segments. Due to removal of the retinal pigment epithelium, structural preservation of the rod outer segments is suboptimal. (B) DIC image of part of the same frame to show the retinal layering and location of the rod opsin label. (C) DIC image of the photoreceptor layer in dorsal mid-periphery of a flat-mounted, unstained retina at higher magnification. The focus is at the level of the inner segments, which are slightly larger in cones (two marked by arrow heads) than in rods. For details, see text. Layer labels in A apply to A and B: OS and IS, photoreceptor outer and inner segments; INL, inner nuclear layer; GCL, ganglion cell layer. Scale bars = 50 μm in A also applies to B; 25 μm in C.

Photoreceptor densities were assessed at 13 positions along a dorsoventral transect of a retinal flat mount by focusing on the rod and cone inner segments with DIC optics at high magnification (Fig. 1C). In mid-peripheral and peripheral retinal regions, cone inner segments were visibly larger than rod inner segments (Fig. 1C, Fig. 2); in the central retinal region, the difference was not as obvious. The flat mount had been labeled for L- and S-cone opsins by double immunofluorescence (see below), and cone density was determined at the same locations as total photoreceptor density. Subtraction then yielded rod densities. Our limited sampling showed a rod density range of 47,000–64,000/mm2, with highest densities in central retina close to the cone visual streak (see below) and lowest densities in the far periphery of the retina.
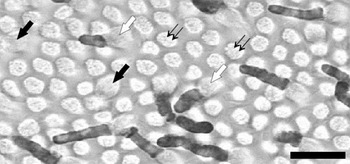
Flat view of the photoreceptor layer in a whole-mounted agouti retina immunolabeled with antiserum JH492 for L-cones. The field is located 8 mm ventral to the optic disk. The label is restricted to the cone outer segments, but the inner segments are also in focus. White and black thick arrows point to labeled L- and unlabeled S-cones, respectively (see Fig. 3). Black thin arrows indicate examples of the dominant rod population. Scale bar = 25 μm.

The rod density of the agouti is lower than that in most nocturnal mammals (see Discussion), and this is accompanied by larger rod inner segment diameters of about 4.6 μm in peripheral and about 3.6 μm in central retina (cf. Fig. 1C). Also, rod outer segments in the agouti were not as slender and elongated as typically found in nocturnal rodents (Fig. 1A).
Cone photoreceptors
With the antibodies to the L- and S-cone opsins, two distinct populations of cones were identified in the agouti retina, expressing the L- and S-opsins, respectively. Opsin immunoreactivity was restricted to cone outer segments, and no labeling was observed in the inner segments, cell bodies, or cone axon and pedicles.
Fig. 2 shows a high-magnification micrograph from the ventral region of a flat-mounted agouti retina at 8-mm distance from the optic disk. The retina was reacted with antiserum JH492/ABC to reveal the L-cones. At this eccentricity, it was possible to visually differentiate cones from the dominant population of rods by their inner segment sizes (white and black thick arrows) which are larger than those of the rods (thin black arrows). The retina shows labeled L-cone outer segments throughout the photoreceptor array (white thick arrows) among unlabeled S-cones (black thick arrows) (see Fig. 3).
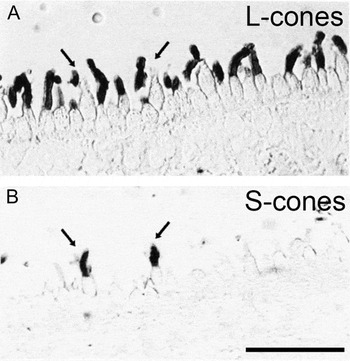
Micrographs of sequential semithin (1 μm) vertical sections labeled with JH492 for L-opsin (A) and JH455 for S-opsin (B). The arrows show that the outer segments of cones labeled by JH455 were not labeled by JH492 in the adjacent section. Scale bar = 25 μm applies for both photomicrographs.

Search for cone pigment colocalization
In order to investigate if the agouti retina contained individual cones coexpressing both L- and S-opsins, we used the antibodies in serial semithin sections. Fig. 3 shows two consecutive 1-μm-thick sections from ventral retina at approximately 4 mm distance from the optic disk. In Fig. 3A, a large number of cone outer segments were labeled by antiserum JH492 and thus identified as L-cones. In the adjacent section (Fig. 3B), antiserum JH455 revealed a minority of cone outer segments containing the S-opsin. The sections are so thin that individual cones can be identified in both sections, and outer segments labeled by JH455 were negative for JH492 (arrows). Samples from the visual streak and dorsal regions were investigated similarly, and no colocalization of the two labels was found in any cone outer segment.
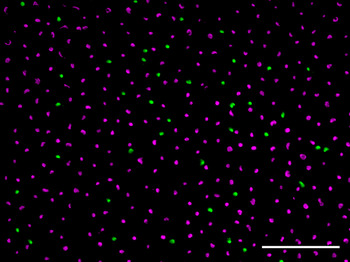
The absence of opsin coexpression was confirmed in a flat-mounted retina that was double-labeled for L-opsin (antiserum JH492) and S-opsin (antiserum sc-14363). This allowed assessing larger numbers of cones than seen in the vertical sections. Across the retina, all cones exclusively expressed either the L- or the S-opsin (Fig. 4). On the other hand, double immunofluorescence labeling with the two S-opsin–specific antisera JH455 and sc-14363 showed complete colocalization of the labels (not illustrated), confirming the specificity of these antisera.
(Color online) Micrograph from a flat-mounted retina double immunofluorescence labeled for L-cone opsin (magenta) and S-cone opsin (green). The focus is at the level of the cone outer segments. None of the cones are double-labeled (which would appear white); there is no coexpression of the two opsins in any cones. In this field located in dorsal mid-peripheral retina, L-cone density is 8200/mm2 and S-cone density 1200/mm2 (i.e., 13% S-cones). Total photoreceptor density in this field is 64,600/mm2, as assessed from the corresponding DIC image (not shown). Hence, with the cone density of 9400/mm2, there are about 55,000 rods/mm2, and cones constitute 14.5% of the photoreceptors. Scale bar = 50 μm.

Cone topography and rod:cone ratio
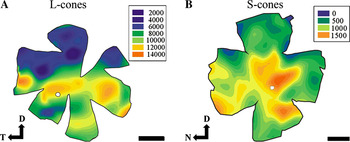
Fig. 5 shows isodensity maps of the L- and S-cones obtained from ABC-reacted retinas of two animals. The L-cones formed a horizontally oriented visual streak about 2–3 mm dorsal of the optic disk, where the density peak was about 12,000–14,000/mm2 (Fig. 5A). L-cone density declined toward dorsal and ventral periphery, being higher in ventral than in dorsal retina. The S-cones had an approximately 10-fold lower density than the L-cones and did not form a visual streak (Fig. 5B). The S-cone density peaked at about 1500/mm2 in central retina and decreased progressively toward dorsal periphery, whereas it stayed high over most of ventral retina.
Topographic distribution of L- and S-cones in agouti retina. Each map outlines the flat-mounted retina with its flattening radial cuts. Approximately two thirds of the retina are dorsal from the optic disk (white circles). Note the slightly different scaling of the maps. The cone topographies are represented as color-coded isodensity areas, the insets give the respective cone densities per square millimeters. (A) L-cone density reaches a peak about 2–3 mm dorsal to the optic disk, forming a horizontally oriented visual streak. Ventral to the visual streak, there are overall higher L-cone densities than dorsal to it. The density topography of L-cones grossly follows the ganglion cell topography for the agouti (Silveira et al., Reference Silveira, Picanço-Diniz and Oswaldo-Cruz1989). (B) S-cone densities are about 10-fold lower than L-cone densities, and the topography does not form a visual streak but has a density peak in temporal central retina. D, dorsal; N, nasal; T, temporal. Scale bars = 5 mm.

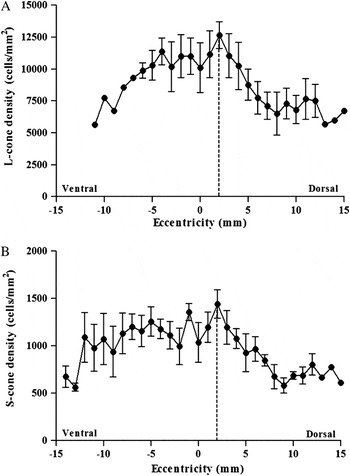
The detailed L- and S-cone density changes along the dorsoventral axis of the retina are shown in Fig. 6. The peak density of L-cones (14,000/mm2) was located 2–3 mm dorsal to the optic disk, matching the position of the visual streak as seen in Fig. 5 (dashed line). Dorsal to the visual streak, L-cone density decreased from 12,000/mm2 to less than 6000/mm2 at the periphery. In ventral retina, the density remained around 10,000/mm2 until 5 mm distance from the optic disk, after which an accentuated density decline to about 5000/mm2 occurred toward the extreme ventral periphery. The S-cones showed a marked dorsoventral asymmetry. Their peak density (1500/mm2) coincided with the visual streak established by the L-cones. From this position to the dorsal periphery, the density decreased to 500/mm2. On the other hand, in ventral retina S-cone density remained nearly constant with an average of 1100/mm2 until the far periphery.
L- and S-cone densities along a dorsoventral transect through the retina crossing the visual streak. Eccentricities give distances from the optic disk. (A) L-cones have a density peak in the visual streak, 2–3 mm dorsal to the optic disk (dashed line), and their density remains high over most of ventral retina. In spite of the similarity between L-cone and ganglion cell distribution, the peak is much less steep for L-cones than observed in the ganglion cell distribution (Silveira et al., Reference Silveira, Picanço-Diniz and Oswaldo-Cruz1989). (B) S-cone density rises gradually from dorsal periphery to the location of the visual streak. In ventral retina, S-cone density drops more gradually toward the periphery.

By integrating the cone densities in the maps of Fig. 5, we estimated the total number of cones in the agouti retina to be about 3.6 million. L- and S-cones amounted to 3.38 million (92% of the cones) and 0.26 million (8% of the cones), respectively. Direct comparison of L- and S-cone densities at some positions across the double-labeled retina (see Fig. 4) showed S-cone proportions to vary locally between 4.5 and 13% of the cones. Local comparison of total photoreceptor density (see above) and cone density showed that cones constituted 17–19% of the photoreceptors in the visual streak and in ventral retina and 10–14% in the regions dorsal to the visual streak. Hence, rod:cone ratios ranged between about 4:1 and about 9:1 across the agouti retina.
Regularity of the cone arrays
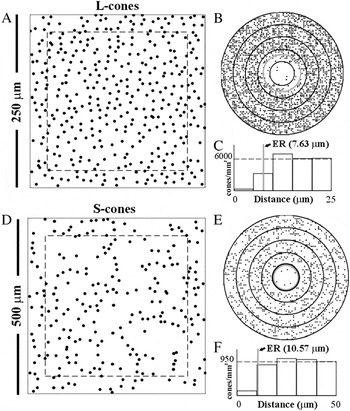
Fig. 7 shows a DRP analysis for representative mosaics of the two cone subpopulations. Figs. 7A and 7D show, respectively, the L-cone mosaic (cell density about 6000 cones/mm2) and the S-cone mosaic (cell density about 1000 cones/mm2). Both fields were located in central retina, 1 mm ventral to the optic disk, but were obtained from different retinas. Filled circles represent the position of each cone center. Cone diameter was not considered in our analysis. Only cells located inside the dashed squares were used in DRP to avoid boundary effects on the analysis. The counted region was at a distance from the field border that corresponds to 10% of its side length. This maximized the number of cells examined and provided the best reliable values for the DRP analyses. Figs. 7B and 7E show the spatial autocorrelograms of the L- and S-cone mosaics depicted in Figs. 7A and 7D, respectively. Superimposed on each autocorrelogram is the effective radius (ER, gray circle), a measure of the intercell distance obtained by the DRP algorithm (Rodieck, Reference Rodieck1991). Each spatial autocorrelogram was subdivided into several concentric annuli of same width (5 μm for L-cones and 10 μm for S-cones). The cell density in each annulus is measured and plotted as a histogram (Fig. 7C and 7F). The histograms show that the tendency to find neighboring cones of same type oscillates around the cell population’s mean density (dashed line). In each histogram, the vertical gray bar is the cone type ER. Visual inspection of the mosaics indicates that there are more gaps in the S-cone mosaic than in the L-cone mosaic, suggesting a lower degree of packing and a lower degree of regularity of the S- than the L-cones. This is confirmed by the higher PF of the L-cone mosaic (0.3), suggesting a more ordered array than for the S-cones (0.087).
Regularity of the L- and S-cone mosaics. (A) Spatial distribution of L-cones obtained in central retina. (B, C) Spatial autocorrelogram and DRP histogram for the mosaic in A. (D) Spatial distribution of S-cones obtained in central retina. (E, F) Spatial autocorrelogram and DRP histogram for the mosaic in D. The L-cone mosaic had a PF of 0.3, while the S-cone mosaic had a PF of 0.087. The dashed rectangle in A and D represents the area analyzed. Filled circles represent the position of each cone center. In each histogram, the dashed line represents the cone mosaic’s mean density. In each spatial autocorrelogram and histogram, the ER (a measure of the intercell distance) is shown as a gray circle or gray vertical line, respectively.

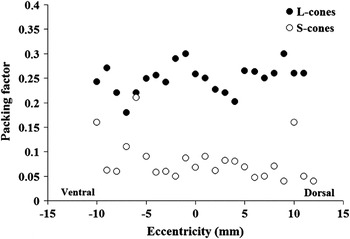
Fig. 8 shows the PF values obtained in several fields located along a dorsoventral axis crossing the visual streak. At all eccentricities, the PF values of the L-cone mosaics (filled circles) were higher than those of the S-cone mosaics (open circles). The average PF of the S-cone mosaics was low, 0.08 ± 0.04, whereas the L-cone mosaics showed PF values between 0.15 and 0.3 (average 0.25 ± 0.03). Along this vertical axis, the PF was independent of the cell densities for both cone types, which—at a larger scale—establish the visual streak and dorsoventral asymmetries.
PF of several L- (filled circles) and S-cone arrays (open circles) located along a dorsoventral axis that crosses the visual streak. Results obtained from two retinas, one labeled for S- and the other for L-cones. At all retinal eccentricities, the L-cones show higher PFs than the S-cones.

Discussion
The agouti is a large (40–60 cm) diurnal rodent commonly found in the Amazon rain forest (Grzimek, Reference Grzimek1968). In previous studies, some aspects of the agouti’s visual system have been assessed. Silveira et al. (Reference Silveira, Picanço-Diniz and Oswaldo-Cruz1989) evaluated the distribution of retinal ganglion cells and found a well-developed visual streak, a nasotemporal band of high ganglion cell density located about 2–3 mm dorsal to the optic disk, and a dorsoventral asymmetry in ganglion cell topography. A recent paper described the retinal topography of A-type horizontal cells using immunocytochemistry (de Lima et al., Reference de Lima, Ahnelt, Carvalho, Silveira, Rocha, Saito and Silveira2005). Interestingly, the density of this cell type that exclusively connects to cones also showed a dorsoventral asymmetry with respect to dendritic field size. The A-type horizontal cells had maximal densities along the visual streak, indicating a possible correlation with the cone topographies. The V17 cortical representation of the contralateral visual field was studied by multiunit recording, and the authors found a magnified representation of the horizontal meridian which corresponds to the visual streak however with an overrepresentation of the visual axis projection in the visual streak temporal end (Picanço-Diniz et al., Reference Picanço-Diniz, Oliveira, Silveira and Oswaldo-Cruz1989, Reference Picanço-Diniz, Silveira, de Carvalho and Oswaldo-Cruz1991, Reference Picanço-Diniz, Silveira, Oswaldo-Cruz and Lent1992). Here we have studied the agouti’s photoreceptors, the input stage to its visual system.
Agouti’s photoreceptors
Our data show that the agouti retina contains rod and cone photoreceptors and thus conforms to the general mammalian pattern of a “duplex” retina (reviews: Ahnelt & Kolb, Reference Ahnelt and Kolb2000; Peichl, Reference Peichl2005). Rod densities are in the range of 47,000–64,000/mm2 and thus much lower than the rod densities in nocturnal rodents (e.g., 440,000/mm2 in mouse; Jeon et al., Reference Jeon, Strettoi and Masland1998). Rod opsin immunoreactivity confirmed that the agouti rod opsin is similar to those of other mammals. Conversely, the agouti has a relatively high average cone proportion of about 8%, locally reaching 17%, whereas many nocturnal rodents have cone proportions below 3% (reviews: Ahnelt & Kolb, Reference Ahnelt and Kolb2000; Peichl, Reference Peichl2005). Both properties, a low rod density and a substantial cone proportion, are characteristic adaptations to diurnal vision and thus advantageous for the diurnal lifestyle of the agouti. Diurnal light levels are also favorable for color vision.
Opsin antibodies label two spectral cone types in the agouti retina
Immunocytochemistry for cone opsins showed the presence of two spectral cone types putatively identified as L- and S-cones. The antisera used here have been shown to specifically label the respective cone opsins in a wide range of mammalian species including hystricomorph rodents (Kryger et al., Reference Kryger, Galli-Resta, Jacobs and Reese1998; Peichl & Moutairou, Reference Peichl and Moutairou1998; Jacobs et al., Reference Jacobs, Calderone, Fenwick, Krogh and Williams2003; Peichl et al., Reference Peichl, Nĕmec and Burda2004, Reference Peichl, Chavez, Ocampo, Mena, Bozinovic and Palacios2005). The S-cones showed identical labeling with both S-opsin antisera, JH 455 directed against the C-terminus and sc-14363 directed against the N-terminus, strengthening the evidence that the agouti possesses a full-length, functional S-opsin.
In a number of mammalian species including mouse, guinea pig, and rabbit, studies with cone opsin antibodies have revealed substantial numbers of mature cones that coexpress the S- and L-opsins (Szél et al., Reference Szél, Rohlich, Caffe, Juliusson, Aguirre and van Veen1992; Rohlich et al., Reference Rohlich, van Veen and Szél1994; Famiglietti & Sharpe, Reference Famiglietti and Sharpe1995; Applebury et al., Reference Applebury, Antoch, Baxter, Chun, Falk, Farhangfar, Kage, Krzystolik, Lyass and Robbins2000; Lukáts et al., Reference Lukáts, Szabo, Rohlich, Vigh and Szél2005). Because the guinea pig, also a hystricomorph rodent, has such “dual-pigment” cones, we specifically tested for cone opsin coexpression in the agouti and did not find any evidence for it (Figs. 3–4). Thus, the agouti retina appears to conform to the pattern described for many other diurnal visually oriented rodents, having separate cone populations that exclusively express either the L- or the S-opsin.
Cone topographies and their potential role for agouti visual performance
Comparing our results with a study of agouti ganglion cells (Silveira et al., Reference Silveira, Picanço-Diniz and Oswaldo-Cruz1989), we observed a correspondence between L-cone topography and ganglion cell topography. Both have a central specialization, the visual streak, and a similar dorsoventral asymmetry. On the other hand, the S-cones do not form a characteristic visual streak and have a flatter, fluctuating distribution across the whole retina. But the S-cones also maintain elevated densities (>1000/mm2) in ventral retina.
The agouti has a characteristic “squirrel-like” food intake behavior. Sitting down with an erect body allows it to manipulate food with its front paws. The erect position also serves as “alert” position against natural predators. The association of the agouti’s posture with the presence of a retinal visual streak would enable the animal to better monitor the visual horizon, giving more reaction time to sudden attacks from predators (Silveira, Reference Silveira1985; Silveira et al., Reference Silveira, Picanço-Diniz and Oswaldo-Cruz1989). Considering the vulnerability of any feeding animal to attack from predators, the above constellation is an evolutionary adaptation of great value for the agouti’s survival. The dorsoventral asymmetry of ganglions cells and cones found in agouti suggests that retinotopic priority is given to the dorsal (upper) visual field, imaged onto ventral retina. The higher density of both spectral cone types in ventral retina suggests better spectral sensitivity in the upper visual field. This should enhance the agouti’s detection of color contrasts originating above the horizon.
There are interesting similarities and differences between the cone topographies of agoutis and ground squirrels. Both are diurnal and have a distinct visual streak of L-cones and ganglion cells, suggesting the importance of attending to the horizon (for ground squirrels, see Kryger et al., Reference Kryger, Galli-Resta, Jacobs and Reese1998, and references therein). However, in ground squirrels the visual streak is ventral to the optic disk, whereas in agouti it is dorsal to it. Hence, in ground squirrel, the “blind spot” of the optic disk lies below the horizon and in agouti above it. This indicates different adaptations for scanning the visual environment. Ground squirrels live in an open prairie habitat where birds of prey are the predominant predator, and a blind spot in the dorsal half of the visual field (covering the sky) would be fatal. The agouti, inhabiting rainforests and bushy savannas, apparently was under different adaptive pressure, with the terrain below the horizon and terrestrial predators being more important. A further difference is that ground squirrel retinas are extremely cone-dominated (>80% cones; Kryger et al., Reference Kryger, Galli-Resta, Jacobs and Reese1998, and references therein). Such a cone dominance is rare even among diurnal mammals, and it may be an adaptation to the high daylight intensities present in the open prairie. The markedly lower agouti cone proportion (roughly 10–20%) is more typical for diurnal mammals (Ahnelt & Kolb, Reference Ahnelt and Kolb2000; Peichl, Reference Peichl2005). For example, the diurnal guinea pig also has about 8–17% cones (Peichl & González-Soriano, Reference Peichl and González-Soriano1994), and the diurnal degu has about 30% cones (Jacobs et al., Reference Jacobs, Calderone, Fenwick, Krogh and Williams2003).
The populations of S- and L-cones correspond to about 10 and 90% of the total cone population, respectively. This is the arrangement found in many mammals (reviews: Ahnelt & Kolb, Reference Ahnelt and Kolb2000; Peichl, Reference Peichl2005), and it is the prerequisite for the dichromatic type of color vision most commonly found in nonprimate mammals (review: Jacobs, Reference Jacobs1993). Hence our data suggest that the agouti has dichromatic color vision. While our immunocytochemical labeling clearly shows the presence of a shortwave-sensitive and a longwave-sensitive cone opsin, it does not provide information about their exact spectral tuning. Among rodents, there is a great variety in the spectral tuning of the cone opsins (Jacobs, Reference Jacobs1993; Ahnelt & Kolb, Reference Ahnelt and Kolb2000; Szél et al., Reference Szél, Lukáts, Fekete, Szepessy and Rohlich2000; Yokoyama, Reference Yokoyama2000; Bowmaker & Hunt, Reference Bowmaker and Hunt2006). In the hystricomorph degu and cururo, the S-opsin is tuned to UV (Chávez et al., Reference Chávez, Bozinovic, Peichl and Palacios2003; Jacobs et al., Reference Jacobs, Calderone, Fenwick, Krogh and Williams2003; Peichl et al., Reference Peichl, Chavez, Ocampo, Mena, Bozinovic and Palacios2005); in the hystricomorph guinea pig, it is tuned to violet (Jacobs & Deegan, Reference Jacobs and Deegan1994; Parry & Bowmaker, Reference Parry and Bowmaker2002). Sequencing of the opsins and determining their tuning-relevant amino acids, as well as electrophysiological and behavioral studies will be needed to determine which particular form of color vision the agouti has.
The spatial patterning of S- and L-cone mosaics
The S- and L-cone arrays show different degrees of spatial organization. The results obtained by DRP analysis imply that L-cones form regular mosaics, while S-cones establish less regular mosaics. These results provide evidence in a further rodent group for the hypothesis that irregular mosaics rather than regular ones appear to be the rule for mammalian S-cones (Ahnelt et al., Reference Ahnelt, Fernandez, Martinez, Bolea and Kubber-Heiss2000). Random S-cone mosaics were shown in diverse mammalian species like marsupials, rabbits, cats, horses, rats, and guinea pigs (Szél et al., Reference Szél, Diamantstein and Rohlich1988, Reference Szél, Rohlich, Caffe, Juliusson, Aguirre and van Veen1992; Szél & Rohlich, Reference Szél and Rohlich1992; Ahnelt et al., Reference Ahnelt, Hokoç and Rohlich1995; Sandmann et al., Reference Sandmann, Boycott and Peichl1996), which, as the agouti, all have rod-dominated retinas. It seems that regular S-cone mosaics are only present in mammals with cone-dominated retinas such as ground squirrels and tree shrew (Long & Fisher, Reference Long and Fisher1983; Ahnelt, Reference Ahnelt1985; Müller & Peichl, Reference Müller and Peichl1989) and in diurnal monkeys (Martin et al., Reference Martin, Grünert, Chan and Bumsted2000). Regular S-cone mosaics can be of particular advantage for species with a diurnal lifestyle by providing low spatial fluctuation of the widely spaced, short-wavelength input to higher level antagonistic receptive fields and processing channels. Still, specific synaptic connectivities may underlie the apparent randomness of many S-cone mosaics, as suggested by spatial correlation with peripheral dendrites of felid A-type horizontal cells (Ahnelt et al., Reference Ahnelt, Fernandez, Martinez, Bolea and Kubber-Heiss2000). Whatever the advantage of S-cone regularity is, it seems to be dispensable for non-sciurid rodents including the diurnal agouti studied here.
Acknowledgments
This research was supported by grants from CNPq-PRONEX/FAPESPA #2268, CNPq #620248/2006-8, CAPES-PROCAD #0019/01-1, and FINEP research grant “Rede Instituto Brasileiro de Neurociência (IBN-Net)” #01.06.0842-00. S.M.A.L. received a fellowship from the Austrian Academic Exchange (OAD). F.A.F.R. had a CAPES fellowship for graduates. L.C.L.S. is a CNPq research fellow. The authors are grateful to John Manoel de Souza for helpful suggestions on the manuscript and to Christian Schubert and Elizabeth Anger for research assistance.