
Introduction
Micro electro mechanical systems (MEMS) are micro-scale structures with mechanical and electrical components designed for applications such as high-performance inertial sensors, timing references, and others. Typical MEMS fabrication is based on materials and processes from integrated circuits (ICs) (clusters of electronic circuits fabricated on a single silicon chip). However, MEMS have different features due to their need for deep trenches, high aspect ratios, and release processes required for their dynamic components.[Reference Martin1] MEMS have revolutionized many industries, including the sensors industry, due to their small size, low cost, and low-power consumption. However, it is difficult to determine their sources of failure. To enable continued development of high-performance MEMS sensors for a wide variety of applications, it is critical to better understand the failure mechanisms that affect these devices.[Reference Martin1, Reference Perlmutter and Breit2]
Despite the importance of ongoing research in this area, a gap remains in studying the surface features of highly doped encapsulated MEMS sensors after fabrication and testing, without disrupting the encapsulation. Traditional means of analysis such as scanning and transmission electron microscopy are unavailable due to the opaque, hermetic encapsulation. Infrared (IR) microscopy is available but limited in resolution. X-ray microscopy is an attractive technology for through-encapsulation imaging, due to its access through multiple layers. Previous x-ray computed tomography (XCT) studies of MEMS devices have been conducted but have been largely limited to studying features above the millimeter scale and non-encapsulated devices.[Reference de Veen, Bos, Hoogstede, Revenberg, Liljeholm and Ebefors3] One study uses XCT with micro-scale resolution to examine encapsulated MEMS devices post-fabrication, but it focuses on evaluating the bonding of different substrates samples with simple structures.[Reference Manier, Zoschke, Oppermann, Ruffieux, Dalla Piazza, Suni, Dekker and Allegato4] XCT has been widely applied to the analysis of ICs with micro- and nano-scale resolutions with a focus on reliability applications.[Reference Wang5–Reference Zschech and Diebold10] Though ICs have nano-scale surface features, MEMS have suspended structures that require unique fabrication processes and sacrificial layers to produce devices with mechanical components and very low resistivity levels (<0.001 Ω-cm).
In this paper, we use XCT with a resolution of 30 nm to 1 µm to analyze more than 50 devices fabricated in a unique vacuum-sealed process, including accelerometers, gyroscopes, test structures, and other sensors. We build three-dimensional models based on collected x-ray images and use a systematic method to analyze each layer of the samples to study and assess failure modes. The results show that micro-scale XCT is effective to analyze the full structures of the devices and assess stiction in large released structures, and that nano-scale XCT can show the detailed surface features of device sections and reveal small defects in the features including surface roughness, silicon migration, and over-etch. These findings allowed us to attribute failures to specific steps in the fabrication process.
Vacuum-sealed MEMS fabrication
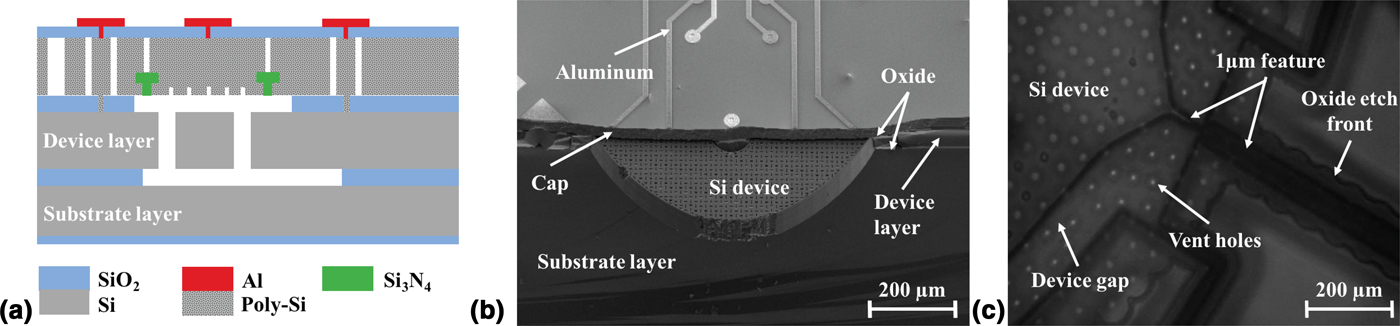
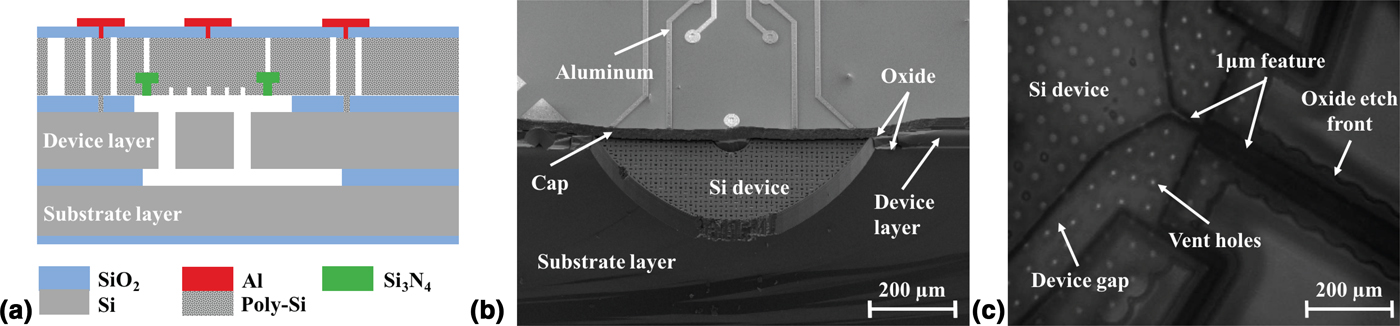
Unpredictable environmental conditions present a serious challenge to reliable, high-performance MEMS devices.[Reference Martin1] Epitaxial encapsulation is a unique packaging technology for MEMS, developed in collaboration between Stanford University and Bosch, designed to mitigate the effects of the environment on MEMS devices.[Reference Partridge and Lutz11, Reference Candler, Hopcroft, Kim, Park, Melamuf, Agarwal, Partridge, Lutz and Kenny12] In this process, silicon structures are packaged free of contamination in a hermetically sealed, near-vacuum environment, which is crucial for high performance and stability of MEMS sensors.[Reference Kim, Candler, Hopcroft, Agarwal, Park and Kenny13, Reference Ng, Lee, Ahn, Melamud and Kenny14] The devices are manufactured at the “Stanford Nanofabrication Facility” with features from tens of nanometers to hundreds of micrometers and are monolithically encapsulated at the wafer level. The materials used in the baseline process include silicon, silicon dioxide, polysilicon, and silicon nitride as shown in the schematic representation of a device cross-section in Fig. 1(a). There have been multiple variations of this encapsulation process with different materials in the device layer and steps to improve the yield and sensor performance.[Reference Yang, Ng, Chen, Flader and Kenny15–Reference Flader, Chen, Gerrard and Kenny17] We study a wide range of devices fabricated in these processes to understand the material effects and processes on failure mechanisms.
Schematic representation of devices and current imaging techniques used to assess vacuum-sealed structures: (a) schematic representation of cross-section of a die fabricated with the vacuum-sealed encapsulation process, (b) SEM image of cross section of a resonant accelerometer, (c) IR image of an accelerometer with micro-tether.
Failure mechanisms
Though the ultra-clean packaging environment reduces the likely failure mechanisms, our MEMS devices are still susceptible to failure from stiction, fracture, and fatigue. Stiction (sticking friction) occurs when two surfaces become inadvertently adhered to one another[Reference Martin1, Reference Perlmutter and Breit2] and is the most common failure mechanism in MEMS devices even though encapsulation prevents moisture adhesion. Prior studies have found that stiction can be caused by Van der Waals forces due to the high surface area to volume ratio.[Reference Heinz, Hong, Ahn, Ng, Yang and Kenny18–Reference Zhuang and Menon20] Since previous studies have proven that stiffness and stiction are inversely related in vacuum-sealed devices, performance metrics are often sacrificed to increase stiffness and maximize the yield of MEMS sensors.[Reference Heinz, Hong, Ahn, Ng, Yang and Kenny18]
Stiction often leads to fracture when two walls stick together and the device experiences stress above its yield, often during high-impact collisions.[Reference Tanner, Walraven, Helgesen, Irwin, Brown, Smith and Masters21] Fracture particularly affects highly compliant structures and devices with stress concentrations. Sensors designed for harsh environments often must survive large impacts, necessitating a good understanding of fracture failure. Another failure mechanism that has been documented in our devices is fatigue, which is the gradual weakening of a material due to repeated stress cycles below the ultimate failure stress. Incidences of fatigue have been observed in MEMS devices with device layer materials such as oxide-coated single-crystal silicon and oxide-coated polysilicon, which have rougher surfaces than single-crystal silicon.[Reference Hong, Yoneoka, Messana, Graham, Salvia, Branchflower, Ng and Kenny22, Reference Muhlstein, Stach and Ritchie23]
Examining vacuum-sealed MEMS
The surface features of vacuum-sealed encapsulated MEMS remain hidden after fabrication and testing. The low transmission of highly doped silicon and the multi-layer enclosed cavity prevent the use of typical imaging and characterization tools to examine surface features after fabrication. Assessing failure modes of these devices is vital to understand their behavior and improve future designs.
Current methods of examining vacuum-sealed MEMS devices include electrical tests and imaging techniques. These methods are either invasive or limited in assessing failure post-fabrication. Our devices are often tested for electrical conductivity to determine if two surfaces are in contact. This method is effective to determine the fabrication yield of the devices, but it fails to provide specific information on the location of the failure and nature of defects. Scanning electron microscopy (SEM) and IR microscopy techniques are used to evaluate the surfaces during and after the fabrication process. After the devices are sealed, they must be cleaved to access the device layer with SEM. This is very invasive and it contaminates the cavity, as shown in Fig. 1(b). The high doping of the devices (of the order of 2.2e20/cm3 for p-type and 6e19/cm3 for n-type) reduces the transmission of IR, which lowers the resolution of IR microscopy, as shown in Fig. 1(c).
Methods
Using micro- and nano-scale resolution XCT, we studied a wide range of devices from variations in our fabrication process to assess the structures and failure mechanisms.
Micro-scale XCT
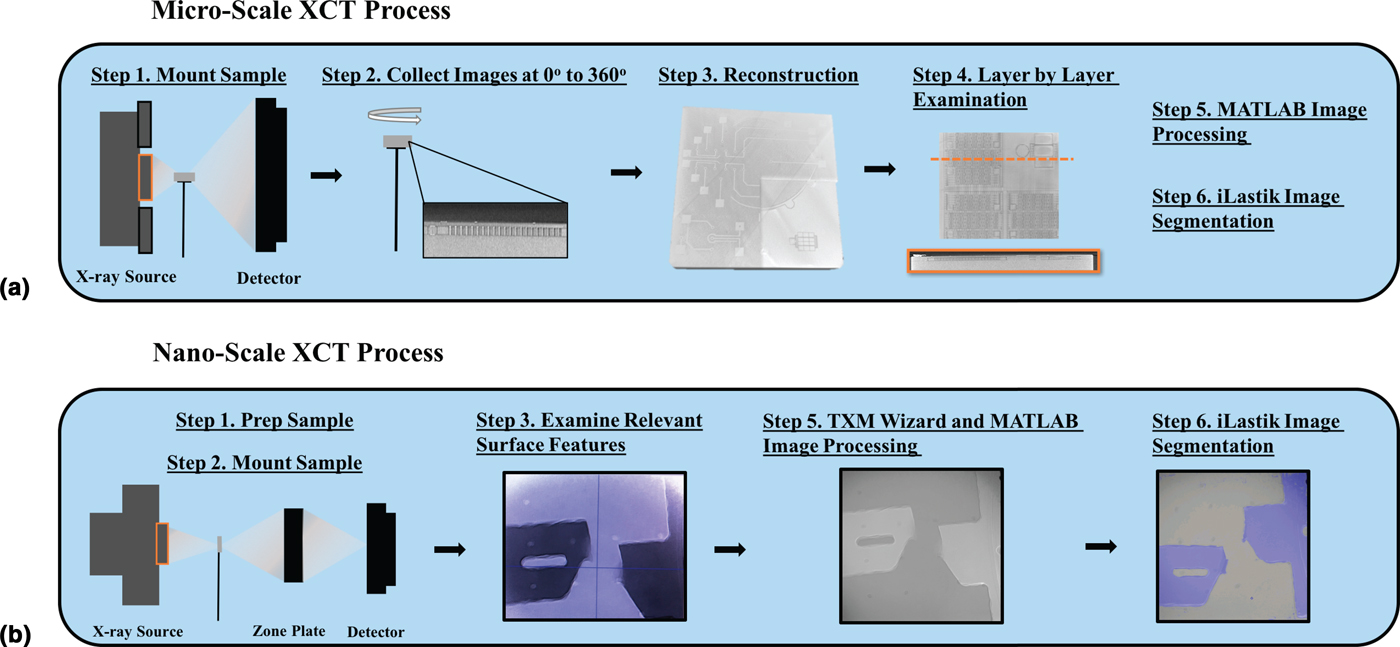
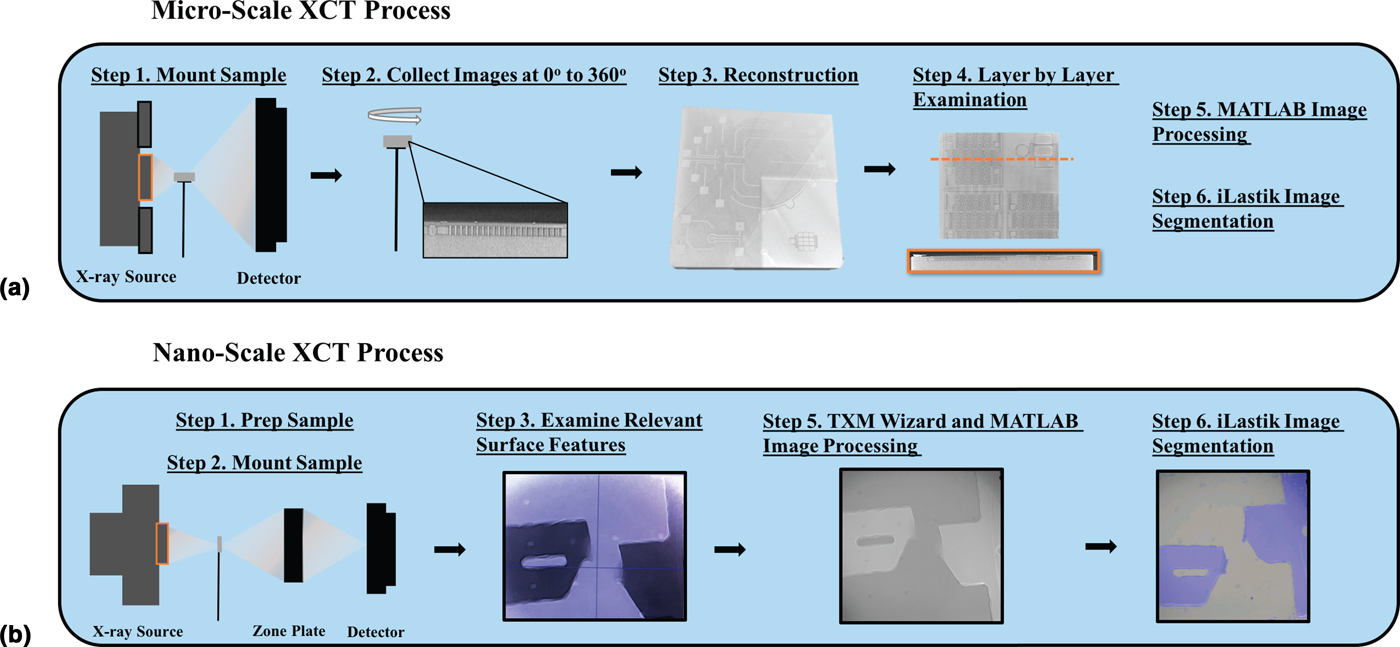
A “Zeiss Xradia” micro-XCT system was used to examine vacuum-sealed MEMS dies, which are 2 mm × 2 mm × 0.6 mm square samples diced from the wafer. Each die contains multiple devices. The samples were mounted vertically onto a needle tip with non-conductive adhesive and placed in a mounting plate at the shortest collision-free distance from the x-ray source and detector, as shown in Fig. 2(a). The x-ray source was used at 80 keV with a transmission of 30% and a low-energy filter to obtain a resolution of 0.7–1 µm. Approximately 3000 x-ray images were captured in an interval of 6–7 hrs while rotating the sample from 0° to 360° using a computer with an Intel Xenon processor with a dual 2.8 GHz core. A three-dimensional model of each sample was constructed using “Xradia Scout and Scan Reconstruction” software, where the images were corrected for center shift and beam hardening. A reference x-ray image of air taken without the low-energy filter was used to subtract any errors due to filter imperfections. We examined each layer of the sample using “Dragonfly” software to evaluate features.
Process of collecting and examining x-ray computed tomography images: (a) micro-scale XCT process, (b) nano-scale XCT process.
Nano-scale XCT
In addition to the Xradia system, we used the transmission x-ray microscope at beamline 6-2 at the “Stanford Synchrotron Radiation Lightsource Laboratory” located at the “SLAC National Laboratory” for higher resolution imaging. First, the samples were prepared by carefully polishing the inactive wafer handle portion of the die to reduce the thickness from 0.6 to 0.1 mm to maximize x-ray transmission through the material, since x-ray transmission through silicon is inversely proportional to the thickness of the material.[Reference Henke, Gullikson and Davis24] Then, the samples were mounted horizontally onto a needle and placed in the mounting plate at an optimal distance from the x-ray source and zone plate to maximize the resolution, as shown in Fig. 2(b). The x-ray source was used at 9.8 keV to obtain a resolution of 30 nm.
The images were processed using “TXM Wizard” software, described in,[Reference Liu, Meirer, Williams, Wang, Andrews and Pianetta25] where reference x-ray images taken of air were subtracted from the images collected to correct for any inherent errors of the system. We collected x-ray images at a small range from 0° to 60°, but were not able to construct three-dimensional models of the devices. This was due to the horizontal sample placement required due to the sample thickness, which causes low transmission at oblique angles, contrary to micro-XCT. Therefore, the image collection process was much shorter (approximately 10 min) than in the micro-XCT process.
Image processing and segmentation
The images were further processed after initial evaluation using the “MATLAB image processing toolbox” and “iLastik 1.2.2” software to apply different filters and segment components. We applied several types of filters including Gaussian and median to improve the image quality. The iLastik 1.2.2 software was trained to recognize the regions with different brightness to segment the devices in the images. The time incurred in these steps was approximately 1–3 hrs per device, with some images requiring more processing than others. This process allowed us to improve the image quality to better examine the surfaces.
Assessing failure mechanisms
Stiction
We used both micro- and nano-XCT to examine stiction test structures and examine stiction in highly compliant devices. We studied a range of beams with variable stiffness, fabricated in two variations of our vacuum-sealed encapsulation process with rough and smooth surfaces in the device layer. We compared the effects of material roughness in preventing in-process stiction resulting from the fabrication process.[Reference Heinz, Hong, Ahn, Ng, Yang and Kenny18] We examined the devices using nano-scale XCT, since micro-scale XCT resolution was inadequate.
One example of the tradeoff between resilience against stiction and sensor stiffness was the design of a resonant accelerometer. The accelerometer contains two resonating beams that measure the displacement of a large proof mass, further discussed in.[Reference Christensen, Ahn, Hong, Ng, Yang, Lee and Kenny26, Reference Shin, Ahn, Chen, Christensen, Flader and Kenny27] During fabrication, the large released areas of the proof mass increase the incidence of in-process stiction and decrease the yield of the devices. We examined the surfaces using micro-XCT to assess for lateral and vertical stiction of the proof mass.
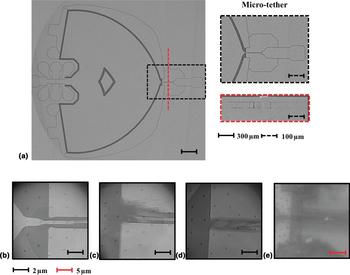
We studied a further design iteration of the resonant accelerometer that aims to mitigate in-process stiction and increase the yield for these devices. This design iteration added a 1 µm-thick silicon micro-tether at one end of the proof mass connected to an additional anchor support to prevent in-process stiction. The micro-tether was severed after fabrication by melting the tether with a Joule heating current, or alternatively with the application of a large stress, as described in.[Reference Flader, Chen, Shin, Heinz, Comenencia Ortiz, Alter, Park, Goodson and Kenny28] We examined the micro-tether using nano-scale XCT in several devices after breaking the tether and the full structure using micro-scale XCT to assess the status of the proof mass.
Fracture
We evaluated highly compliant devices after fabrication and testing using micro-XCT to assess if they fractured during the fabrication process. Additionally, we examined failure within vacuum-sealed devices after high-stress experiments, where the 2 mm × 2 mm × 0.6 mm die is subjected to large shock accelerations (>10,000 Gs) to inspect the areas where the devices fail due to stress concentrations.
Fatigue
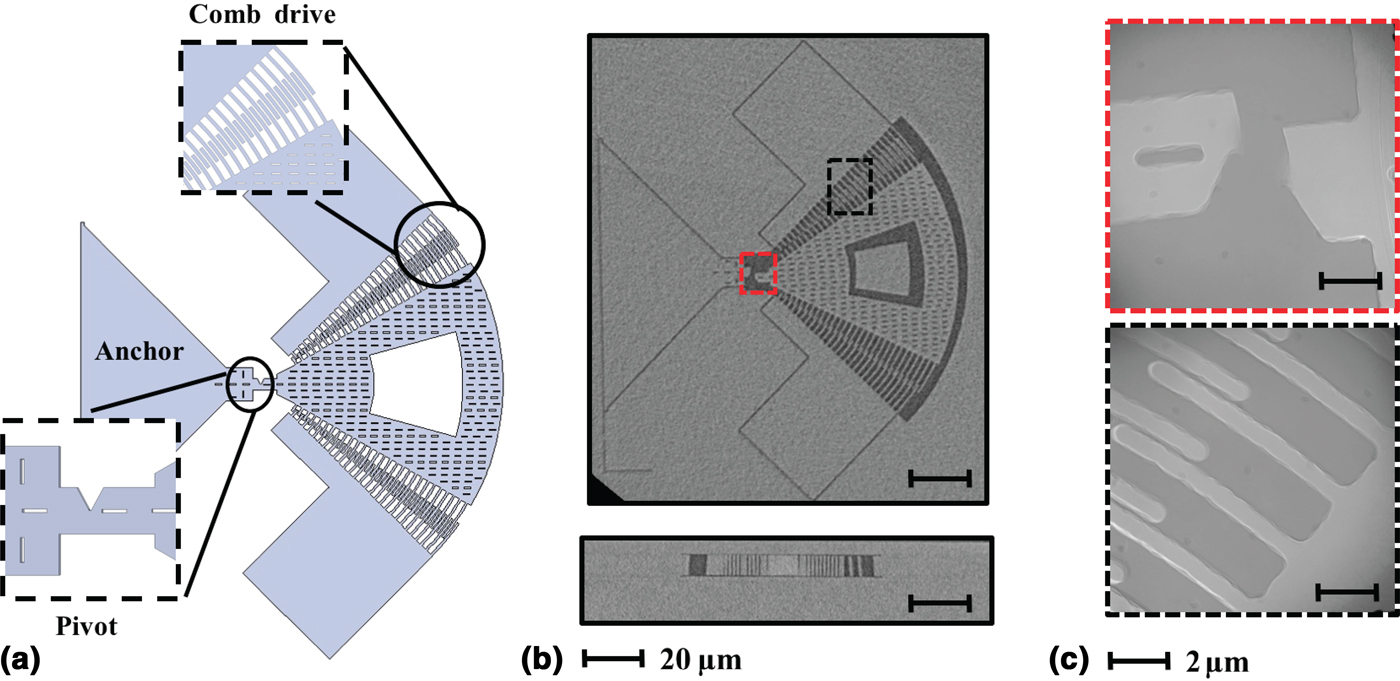
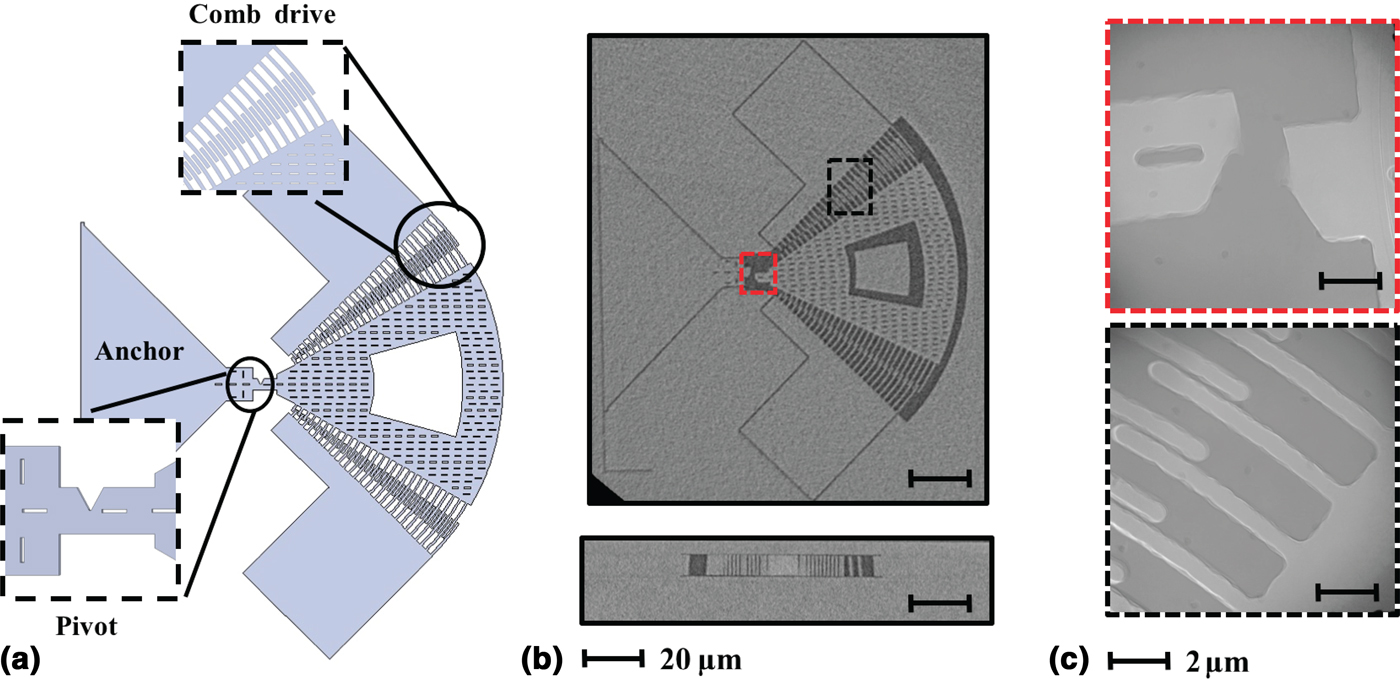
We examined fatigue test structures with comb drives and high-stress concentrations using XCT to discern how the devices break after cyclic loads. The devices consist of a proof mass, actuated and sensed with comb drives, connected to a notched cantilever beam, inducing a point of high-stress concentration at the notch tip.[Reference Hong, Yoneoka, Messana, Graham, Salvia, Branchflower, Ng and Kenny22] The devices were driven into a large amplitude resonance until failure. We examined devices fabricated in a variation of the vacuum-seal encapsulation process, which has epitaxial polysilicon in the device layer and rougher surface side walls due to the grain structure of the polysilicon.
Results and discussion
Overall, we examined the surfaces of more than 50 devices and assessed failure mechanisms of stiction, fatigue, and fracture.
Analyzing stiction
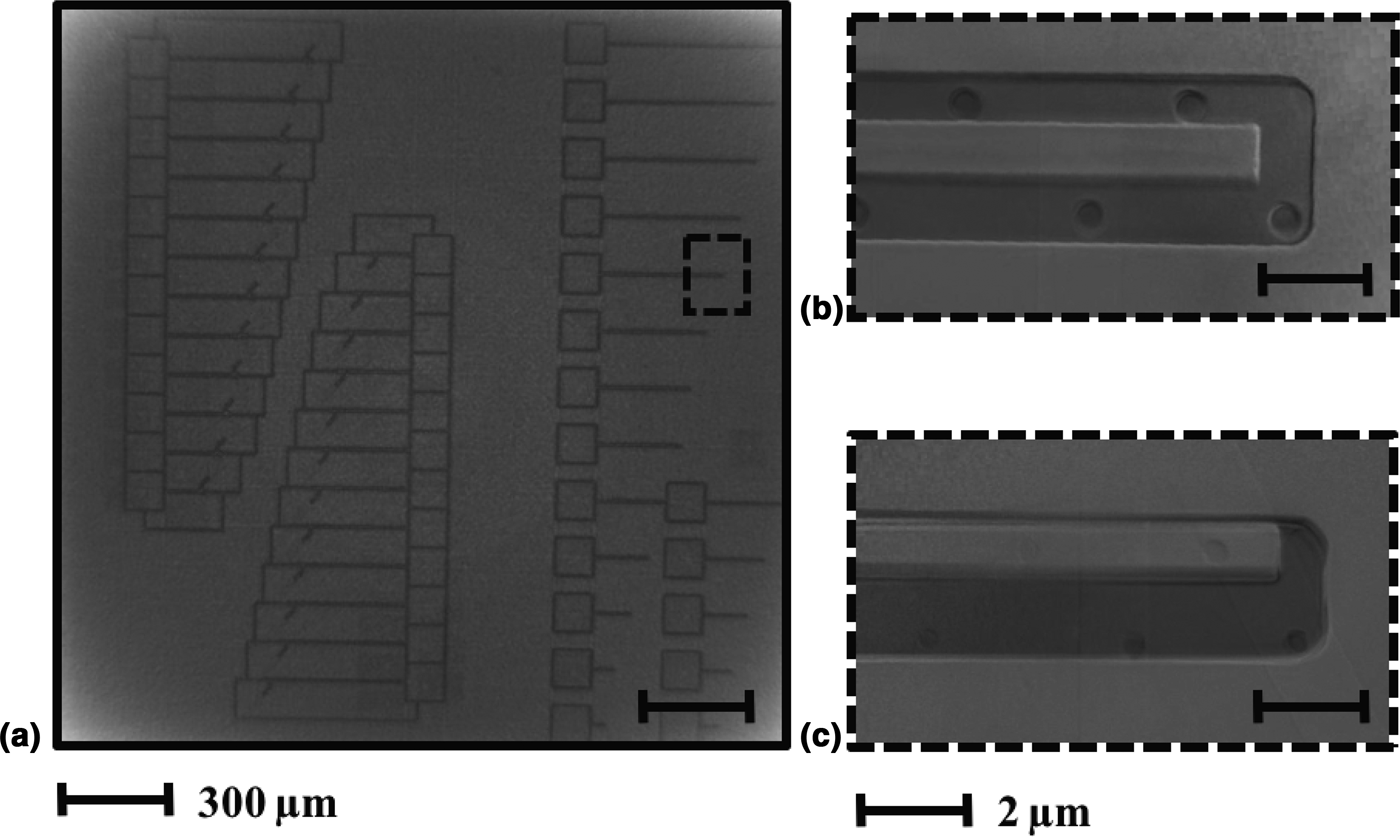
We find that nano-scale XCT is useful to inspect the device features and determine if stiction has occurred. Figure 3 shows a cantilever fabricated with an oxide-coated polysilicon device layer (rough walls) and a cantilever fabricated with a single-crystal silicon device layer (smooth walls). The cantilever with rough walls showed no in-process stiction, while the one with smooth walls was stuck to the side wall. These results complemented previous studies that measured electrical shorts in such devices and proved that the incidences of stiction were higher in devices with smooth walls. By comparing cantilevers with different surface roughness and examining for stiction, this study allowed us to further characterize the effects of material roughness in the device layer of vacuum-sealed devices in preventing in-process stiction.
Results of micro- and nano-scale XCT of cantilevers: (a) micro-scale XCT image of the device layer of a die with cantilevers, the resolution is inadequate to discern whether stiction occurred, (b) nano-scale XCT of an oxide-coated polysilicon tip of a cantilever, (c) nano-scale XCT of single-crystal silicon tip of a cantilever.

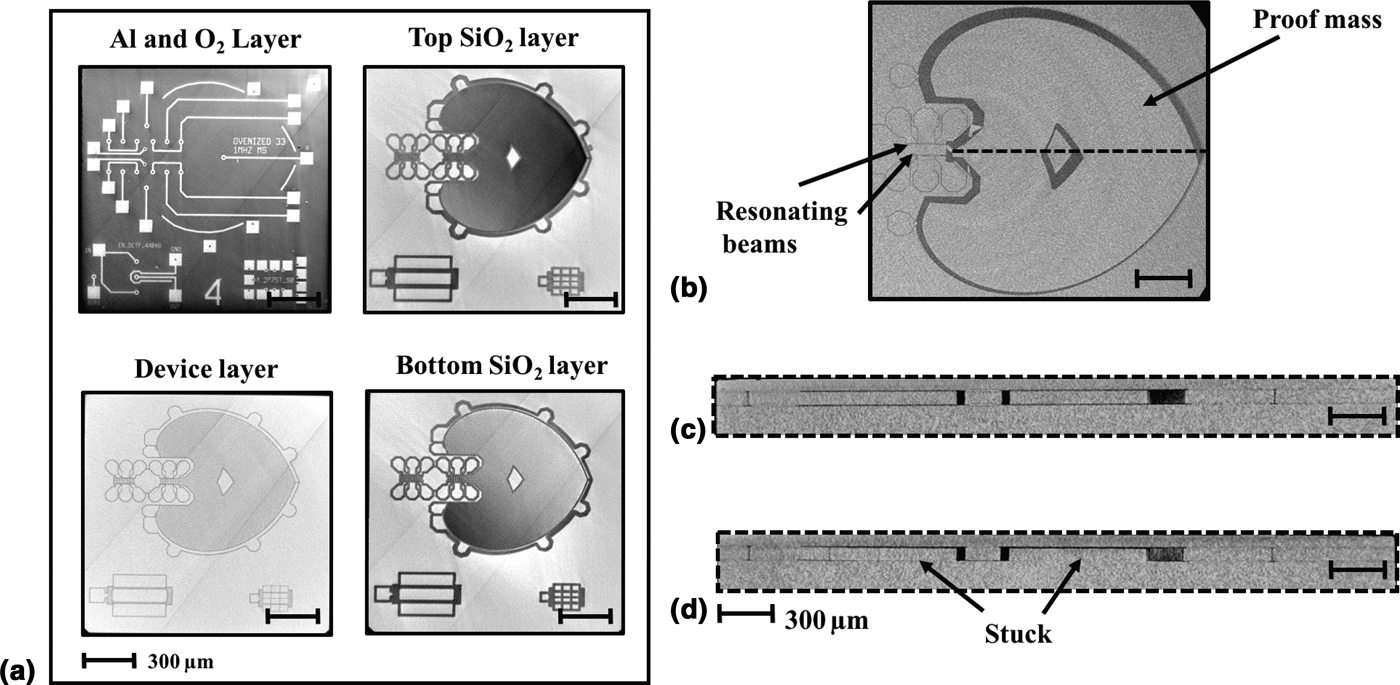
Figure 4(a) shows micro-XCT images of each layer of the die of a resonant accelerometer. By analyzing each layer through cross-sections of the three-dimensional reconstruction, we find that micro-XCT is effective at assessing for stiction failure in resonant accelerometers. Figures 4(b)–4(d) show micro-XCT images of resonant accelerometers with both vertical and horizontal stiction. Prior to these results, the failure mechanisms for these devices were unknown; some of them were electrically shorted, but it was unclear where they failed. These images allowed us to identify where the devices were stuck and to consider at which step they failed. We could compare with simulations, confirm assumptions of failure mechanisms, and inform the next design iterations. This study demonstrated that the accelerometer mass had adhered to the substrate [shown in Fig. 4(d)] during a fabrication step prior to the cavity seal.
Micro-scale XCT images of a resonant accelerometer: (a) top view of each fabrication layer for the device, (b) top view of the device layer shows the proof mass stuck to the side wall, (c) cross-section view of a resonant accelerometer with no stiction, (d) cross-section view of resonant accelerometer shows proof mass stuck to bottom wall.

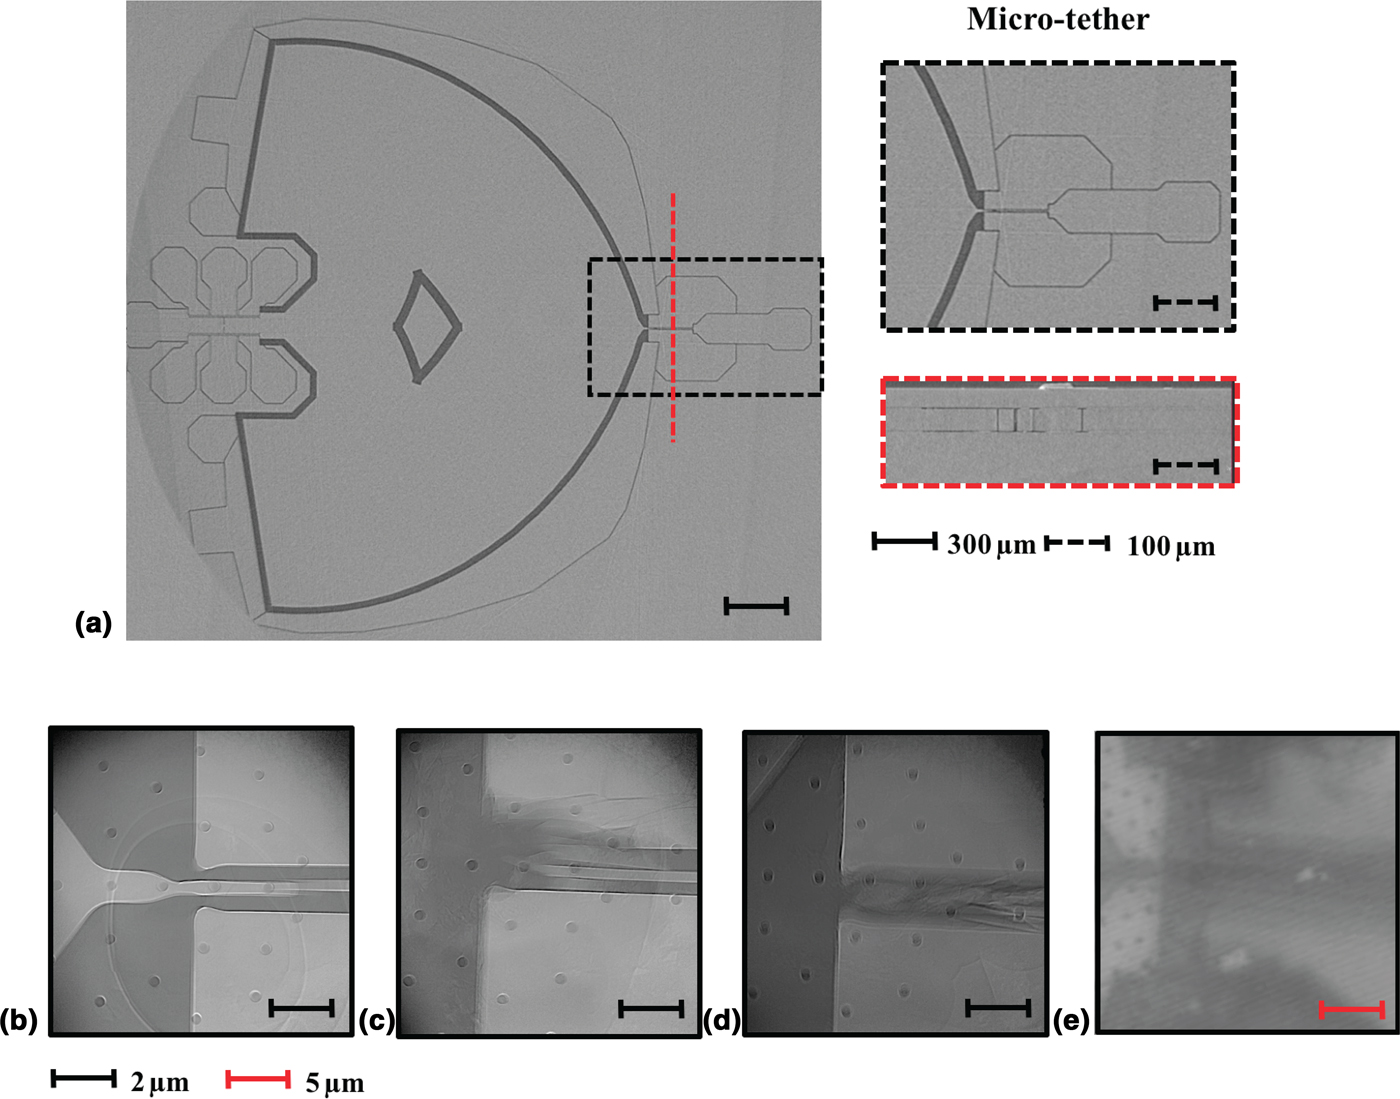
In testing a further iteration with a micro-tether to mitigate in-process stiction, we find that the resolution of micro-scale XCT is insufficient to discern the condition of the micro-tether after breaking, as shown in Fig. 5(a). The results show that nano-scale XCT is effective to discern the difference between breaking the micro-tether using Joule heating or high stress, as shown in Figs. 5(b)–5(E). In these images, we can distinguish that the micro-tether broken during the fabrication process has other impacted surrounding surfaces, shown in Fig. 5(c); similarly, the micro-tether broken with Joule heating melted the surfaces surrounding the micro-tether, as shown in Fig. 5(d). In summary, these results help us realize that the cleanest way of breaking the micro-tether was by applying a high stress, since the surrounding surfaces were unaffected, as shown in Fig. 5(b).
Results of XCT images of resonant accelerometer with tether: (a) top view of micro-scale XCT with zoomed view of tether area and cross-section, (b) broken tether after high-stress test, (c) broken tether in fabrication process, (d) broken tether with Joule heating, (e) IR image of broken tether with joule heating shows insufficient resolution to discern tether.
Analyzing fracture
We find that micro-XCT is useful to inspect devices with fracture failure. Figure 4(b) shows a micro-XCT image of the top view of the resonant accelerometer; the beam that connects the accelerometer to the anchor is fractured. Prior to these results, the assumption was that the device had suffered from fatal stiction to the bottom surface. However, our results showed that the device had suffered from both stiction and fracture. The results allowed us to identify sections prone to fracture. As this mechanism is often accompanied by stiction, it is particularly hard to identify without destructively accessing the cavity.
Analyzing fatigue
We find that nano-XCT is effective to examine the notch tip where the devices fail due to fatigue, and micro-XCT is useful to evaluate the condition of the entire structure after failure. Figure 6(b) shows a micro-XCT image of a fatigue device after failure; in this image, we can discern that the proof mass has rotated to the left after failure. Figure 6(c) shows a nano-XCT image of the notch, designed to crack following the material crystal orientation after fatigue failure, and the comb drive fingers stuck together after the proof mass rotated. The surface roughness of the epi-polysilicon device layer is also noticeable in these images.
Results of XCT for a fatigue test structure: (a) schematic representation of fatigue test structure, (b) micro-XCT images of device layer of a polysilicon oxide-coated device after failure and cross-section of comb drive section, (c) nano-XCT images of pivot and comb drive areas for one sample.
This is the first time we could inspect vacuum-encapsulated devices after fatigue failure without destroying the sealed cavity. These results allowed us to affirm that these structures failed due to cracking and fracture and not due to other mechanisms such as electrical pull-in or stiction. We were also able to compare devices after failure and to complement past results that showed two very similar resonators with different fatigue responses. These results assisted in the conclusion that the material grain structure influences how our devices fatigue, thus providing a better understanding of how fatigue affects the devices fabricated in our process.
Analyzing surface features
Access to the unperturbed cavity of a vacuum-sealed die, allowed by XCT, can be useful to examine the surfaces after fabrication and testing. Nano-scale XCT proved to be a more effective technique to assess the material features of MEMS devices fabricated. Due to the high resolution of this technique, we can discern the smallest surface features of the devices. This method is useful to examine the effects of silicon migration in the devices with single-crystal silicon in the device layer. Figure 5(a) shows that the surfaces are smooth due to the thermal annealing step in our fabrication process.[Reference Lee, Yao and Wu29] We could inspect the deep trenches into the device layer post-fabrication; this was useful to record the amount of etching achieved during some of our fabrication steps. These results are an added benefit to examining the surfaces for failure mechanisms and serve to corroborate data about the fabrication steps without intruding into the ultra-clean cavity.
Conclusion
A combination of micro- and nano-scale XCT is proven to be effective to examine failure mechanisms in hermetically sealed MEMS sensors fabricated with a unique ultra-clean vacuum encapsulation packaging process. We analyzed more than 50 devices including sensors and test structures such as accelerometers, gyroscopes, and others with resolution from 30 nm to 1 µm. Our findings provide an unprecedented observation of the devices after fabrication and testing and allowed us to connect failures and defects to specific steps in the fabrication process. This work allows unique insight into the cavity of vacuum-sealed devices and can be used to explore failure mechanisms and inform future MEMS sensor designs.
Acknowledgments
This work was supported by the Defense Advanced Research Projects Agency (DARPA) Precision Navigation and Timing program (PNT) managed by Dr. Ron Polcawich under contract # N66001-12-1-4260. The fabrication work was performed at the Stanford Nanofabrication Facility (SNF), which was supported by the National Science Foundation through the National Nanotechnology Infrastructure Network under Grant ECS-9731293. The author would also like to thank the National Science Foundation and the Graduate Research Program (NSF-GRFP). Use of the Stanford Synchrotron Radiation Lightsource, SLAC National Accelerator Laboratory, is supported by the US Department of Energy Office of Science, Office of Basic Energy Sciences under Contract No. DE-AC02-76SF00515.