I. INTRODUCTION
Silicon nanowires have recently been proposed as basic building blocks for high efficiency PV cells, because they relax the constraints on the quality of the silicon material and on the amount of semiconductor required for efficient light absorption.Reference Kelzenberg, Boettcher, Petykiewicz, Turner-Evans, Putnam, Warren, Spurgeon, Briggs, Lewis and Atwater1 On the other hand, metallic dots grafted on the nanowire surface can produce localized plasmonic modes to enhance light absorption by the semiconductor and further boost PV efficiency.Reference Catchpole and Polman2, Reference Maier3 These two concepts can be integrated in PV production if low cost technologies for Si nanowire and metallic dot synthesis, among the large range of available approaches, are identified, with the target of reducing cost with maximum performance. Two of the most proposed approaches for the synthesis of the Si nanowires are based on vapor-liquid-solid (VLS) growthReference Wagner and Ellis4–Reference Fan, Werner and Zacharias11 or on solid-liquid-solid (SLS) growth.Reference Yan, Xing, Hang, Yu, Wang, Xu, Xi and Feng12, Reference Yu, Xing, Hang, Yan, Xu, Xi and Feng13 In both these methods, metallic nanoparticles are deposited randomly on an Si substrate and work as catalyst seeds for the nucleation of the Si phase from the vapor source, in the first case, and from the substrate source, in the second case. During the growth, in both cases however, some lateral diffusion of the metallic dots on the substrate can produce a coalescence of the metal nanoseeds, thus increasing the disorder level in the template substrate, and producing a final forest-like material.
There are several low-cost methods present in the literature for producing ordered templates for nanowire growth, but the final catalyst seed density is usually lower than 1 × 109 cm−2, or not directly compatible with standard semiconductor processing techniques.
Some recent approaches for the fabrication of solar cells based on Si wires utilize standard lithography,Reference Kelzenberg, Boettcher, Petykiewicz, Turner-Evans, Putnam, Warren, Spurgeon, Briggs, Lewis and Atwater1 with demonstrated excellent optical absorption results. To try to improve the charge transport to the electrical contacts, including the case in which impurities are present, which work as electronic traps, it seems to be feasible to deal with wires of sizes in the nanometer scale.
In this paper, a facile route for the low-cost production of large-scale substrates templated with ordered nanometric patterns of metallic dots, specifically gold nanodots (NDs), is demonstrated. The method is based on the formation of a polymeric nanomask by diblock copolymer self-assemblyReference Guarini, Black and Yeung14, Reference Thurn-Albrecht, Schotter, Kastle, Emley, Shibauchi, Krusin-Elbaum, Guarini, Black, Tuominen and Russell15 and successive dry etch to transfer the polymeric pattern to the oxide substrate.Reference Kim, Maeng, Lee, Park, Bang, Kima and Sohn16–Reference Puglisi, Scandurra, Bongiorno, La Fata and Lombardo20 The obtained substrate is made of a silicon dioxide layer with nanopores 20 nm wide and separated by a 40 nm distance, etched down to the Si substrate. Afterward, a single layer of Au NDs, with coverage of 20%, is deposited all over the template by sputtering, and subjected to thermal annealing at temperatures ranging between 600 and 1000 °C, to diffuse the metallic NDs on the surface. In this paper it is shown that the NDs deposited outside the pores during annealing diffuse and coalesce to the Au dots deposited inside the pores. The final result of this process is that most of the nanopores are saturated with the gold NDs, and the density of saturated nanopores can be tuned by changing the annealing temperature. The preferential diffusion of the gold NDs toward the nanopores is followed in situ by annealing the samples during TEM imaging, and ex situ by annealing the samples in a furnace and observing them by TEM and high-statistics SEM analysis.
II. EXPERIMENTAL
The self-assembled templates were realized on oxidized p type Si substrates with wet oxides of 15 nm of thickness. We used a commercially available PS–PMMA diblock copolymer with average molecular weight Mn = 67000 g/mol, polydispersity index of 1.11, and PMMA weight fraction of 30%. The polymer was dissolved 1% by weight in toluene. Sample preparation started with an initial surface pretreatment with a random copolymer, the Poly(styrene-co-methylmethacrylate) TEtraMethylPiperidinylOxy (TEMPO) terminated, necessary to neutralize the substrate to the two block copolymers and to promote the proper orientation of the hexagonal template. The polymer-coated substrates were then heated under vacuum at 140 °C for 48 h, above the glass transition temperature of both PS and PMMA, to allow the terminal OH groups to diffuse to and react with the oxide substrate.Reference Mansky, Liu, Huang, Russell and Hawker21 Unattached polymer chains were removed by rinsing in toluene for 30 min at room temperature. The thickness of the grafted layers as measured by ellipsometry was about 3 nm. A 30 nm thick film of diblock copolymer was spin coated on the pretreated substrate and annealed under vacuum at 190 °C for 1 h, to promote the microphase separation of the blocks and self-organization into the hexagonal array. Template formation was completed by exposing the samples to ultraviolet light, which degraded the PMMA and cross linked the PS. The UV exposure was performed by using a low pressure mercury lamp, with a wavelength of 254 nm, and a power density of 12 mW/cm2, and placing the samples under the tube at a distance of about 2 cm. The exposure was taken in air for 20 min. The copolymer was developed in acetic acid, which removed the PMMA cylinders and left a porous PS template. The developed samples presented a close packed hexagonal array of pores, arranged in several randomly oriented macrodomains.Reference Puglisi, La Fata and Lombardo22 The diameter of the nanopores was about 20 nm, while the distance between the centers of the pores was statistically measured to be about 40 nm. The polymeric template was then used as a lithographic mask to transfer the pattern on the oxide underneath. The pattern transfer was obtained through a reactive ion etching (RIE) based on a mixture of tetrafluoromethane (CF4) and nitrogen, with gas fluxes of 10 sccm for CF4, and 10 sccm for N2, by using RF power of 440 mW/cm2, chamber pressure of 15 Pa, and etching time of 600 s. After the RIE etch, all the samples were subjected to a cleaning through a plasma process based on O2 ashing, and to a brief HF dip. After cleaning, the samples were introduced into the sputtering chamber for gold deposition. The metallic dots were deposited by sputtering a gold target on the nanopatterned substrate at room temperature, by using a Emitech K550X (Emitech Limited, Kent, UK) sputter coater, at 2 × 10⁻¹ mbar of partial pressure and 15 mA of gun current, for 10 s. The sputtered samples were annealed in a horizontal furnace in argon ambient for 1 h at temperatures ranging between 600 °C and 1000 °C. The temperature in the furnace was raised by 10 °C/min, and the gas flow was 2 L/min. Structural characterization was performed by transmission electron microscopy (TEM) in cross section and plan view, by using a JEOL JEM 2010F (JEOL Ltd., Tokyo, Japan) microscope with a field emission gun operating at 200 kV accelerating voltage, equipped with a system for energy filtered TEM (EFTEM). The characterization of the early stages of the gold diffusion was performed by in situ TEM analysis. The samples were loaded in a GATAN single tilt heating holder. The temperature was measured by a thermocouple with an accuracy of a couple of degrees. The structural characterization of the samples was also performed by scanning electron microscopy (SEM), using a ZEISS SUPRA35 FE-SEM system with a field emission electron gun.
III. RESULTS AND DISCUSSION
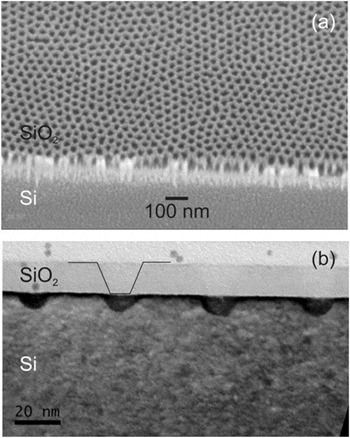
Figure 1 shows the patterned substrate after the copolymer nanomask formation and the successive RIE etching. The figure reports the SEM analysis in tilted view (30° along the y axis) acquired in the region of the sample close to the cleaved edge [Fig. 1(a)], and the TEM in cross section acquired under bright field conditions [Fig. 1(b)]. As Fig. 1(a) illustrates, the etched oxide presented a uniform pattern of nanopores arranged in the hexagonal configuration typical of the polymeric nanomask, this confirming the fidelity of the pattern transfer by dry etch. The measured density of the nanopores was dp = 6 × 1010 cm−2, and their average center-to-center distance was 40 nm.
(a) SEM micrograph in tilted view (30° along the y axis) of the nanoporous SiO2 template realized by nanopatterning based on diblock copolymer self-assembly. The analysis was performed on the cleaved edge of the sample. It is possible to identify the Si substrate in the bottom and the etched oxide layer on top. (b) Cross-section TEM image of a sample: it is visible the 15 nm oxide layer etched down to the Si substrate for about 8 nm. The black line shows the typical etch profile in the oxide layer of the samples. The total pore depth is about 23 nm and the curvature radius at the bottom of the nanopores is about 6 nm.

Figure 1(b) presents the TEM cross section micrograph acquired in bright field conditions of the same sample as in Fig. 1(a). From the micrograph, it is possible to see that inside the pores, the oxide layer was totally etched and the Si substrate was etched for a depth of about 8 nm. The total pore depth was about 23 nm, including the oxide etched thickness. The surface of the oxide between the nanopores is flat, indicating that the copolymer mask has protected the oxide during the dry etch. The bottom of the nanopores presented a circular profile with a curvature radius of about 6 nm. The average diameter of the pores result was〈Sp〉= 22 nm, so the total percentage area covered by the nanopores is ϑp = π(〈Sp〉/2)2 × dp = 20%.
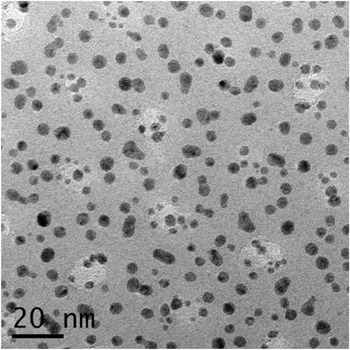
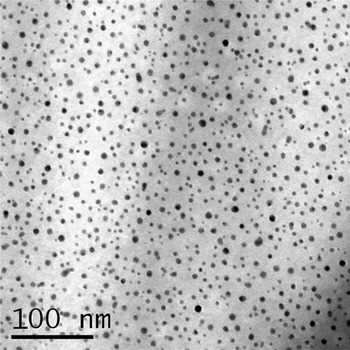
The sample after the 10 s gold sputtering step is shown in the TEM plan view micrograph of Fig. 2. It is possible to see the nanopores of the substrate, which correspond to the white circular regions, and the gold NDs, which correspond to the black spots. As the image indicates, the position of the NDs was random all over the substrate, presenting either dots on the planar part of the oxide or dots corresponding to the nanopores. The TEM micrographs were digitally analyzed and the dot density, the average dot radius, and surface coverage were calculated. The density of the Au NDs was 1.2 × 1012 cm−2, the average dot radius was 2 ± 0.7 nm, and the surface coverage was 19%. The deposited equivalent thickness was calculated by assuming a spherical shape of the Au NDs, and was defined as  , where ri is the radius of each dot imaged in the TEM micrographs and A TEM is the total TEM analyzed area, and the result was about theq = 0.6 nm.
Bright field TEM micrograph of the templated oxide substrate after sputtering of gold nanodots. The white regions represent the nanopores in the SiO2 substrate and the black dots represent the gold nanodots deposited randomly on the substrate.

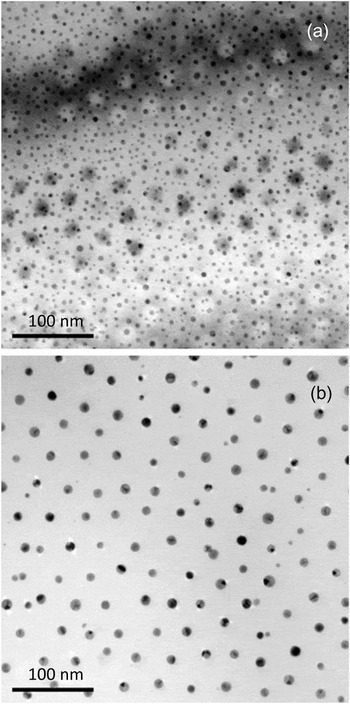
Figure 3 reports the TEM micrograph in plan view of two samples subjected, after sputtering, to furnace annealing for 1 h at (a) 600 °C and (b) 800 °C. In (a) it is possible to see the nanopores of the oxide substrate, which correspond to the white circles and form the typical hexagonal pattern described before, and the Au NDs over the patterned oxide, which correspond to the black circles. As is clear from the image, many dots are visible outside the nanopores, thus illustrating a situation similar to the as deposited sample, that is, a random dispersion of the dots. Above 800 °C, however, as shown in Fig. 3(b), the Au dots saturate all the nanopores and the final configuration is that typical of the polymeric mask illustrated in Fig. 1(a), that is, a regular pattern of nanostructures in hexagonal configuration with a spacing of 40 nm on diameters of about 12 nm. From Fig. 1(b), the pore diameter at the top is measured to be about 20 nm, but due to the oblique etching profile, the pore size decreases, at the bottom, to about 12 nm. From the geometrical characteristics of the pore in the initial substrate, and by considering the synthesis conditions of the sample in Fig. 3(b), that is, theq = 0.6 nm, one can conclude that after annealing at 800 °C for 1 h, the pores are not completely filled, and the Au covers only the bottom part of the pores. The Au NDs present a gray/dark appearance, due to the presence of crystallographic defects, which create a different contrast during bright field TEM imaging.
TEM micrographs in plan view of the nanopatterned oxide substrates after deposition of Au dots and annealing for 1 hr at (a) 600 °C and (b) 800 °C. In (a) it is possible to see the nanopores in the SiO2 substrate and the random Au nanodots (dark spots), while in (b) the ordered Au dots saturating the nanopores together with few dots outside the nanopores.

Another result coming from the TEM is evidence of the few Au dots still present outside the pores, and they are smaller than the dots corresponding to the pores.
The formation of the ordered array of Au dots can be attributed to two processes: (i) the surface diffusion and ripening of the metal dots all over the oxide surface, and (ii) to a preferential trapping of the dots corresponding to the pores. This result is similar to that observed in the literature by Ruffel et al.,Reference Ruffell, Venkatachalam, Shalav, Elliman, Chason, Cuerno, Gray and Heinig23 where Au NDs were deposited on Si with native oxide, diffused upon annealing, underwent a ripening processes, then concentrated at indented sites that were realized by a nanoindentation technique. In that case, the trapping mechanism at the indented sites was attributed to the presence of surfacial defects inside them: Au NDs freely diffused over the surface outside of the indents, where the surface was defect-free, and concentrated at the indented sites, where surface and line defects such as steps and ledges were present, and they are generally believed to act as preferred nucleation sites for metals on semiconductors.Reference Venables24
Gold diffusion was also followed at a higher temperature than 800 °C, and by processing at 1000 °C for 1 h in a furnace, the dot density decreased considerably. In order to reach a sufficient statistical level, the results were acquired by SEM analysis, and the result is illustrated and discussed in Fig. 6(a).
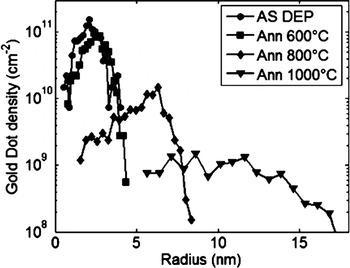
The dot radius distribution was calculated on the above samples and the results are shown in Fig. 4. In particular, the results for the as deposited samples (circles), and for the samples annealed for 1 h at 600 °C (squares), 800 °C (diamonds), and 1000 °C (triangles) are reported. As it is clear from the curves, no large differences were evident between the distribution of the as deposited case and after 600 °C, thus indicating that the thermal budget was not enough to diffuse the nanodots over the surface, as expected from literature on Au ND diffusion on planar substrates,Reference Ruffino, Grimaldi, Bongiorno, Giannazzo, Roccaforte and Raineri25 although some coalescence took place as demonstrated by the shift of the curve at 600 °C toward large sizes. Above 800 °C annealing, the distribution instead presented a considerable shift and a tail at small sizes due to the small dots that remained outside the pores, together with a major component that peaked at about 6 nm in radius, related to the dots saturating the pores. It is interesting to note that this distribution is asymmetric; the tail exists only for small sizes, and decreases abruptly for sizes larger than average.
Gold dot radius distributions in the as deposited samples (circles) and for the samples annealed for 1 hr at 600 °C (squares), 800 °C (diamonds), and 1000 °C (triangles).

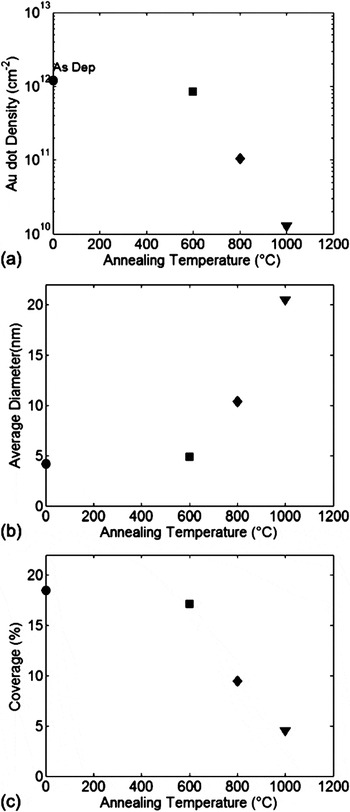
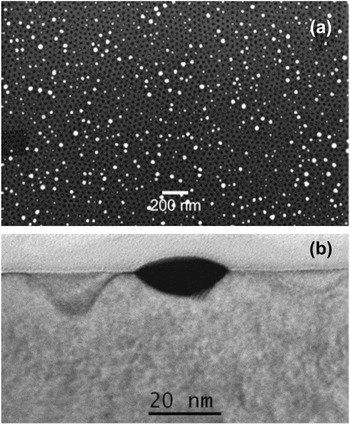
Most of these results were better quantified by calculating (a) the dot density, (b) the dot diameter, and (c) the coverage as illustrated in Fig. 5 for the as deposited case (circles), for the 600 °C (squares), the 800 °C (diamonds), and the 1000 °C (triangles) annealing conditions. The dot density after annealing decreased monotonically, mainly due to the coarsening, and for the same process the average dot diameter increased from 4 nm up to ~20 nm, while the coverage decreased, reaching about 4% for the sample annealed at the highest temperature. As previously described, at 600 °C, the dot characteristics were very similar to the as deposited case, while major differences were noted for temperatures higher than 800 °C. Although the 1000 °C case did not produce any order, it remains an interesting case, because, as illustrated in Fig. 6, it provides many important insights. The SEM micrograph shown in Fig. 6(a) was acquired in plan view and the nanopores in the oxide substrate were imaged as black spots, while the white circles represented the Au nanodots. As shown by the analysis, all the Au nanodots were positioned in correspondence to the underlying nanopores. No nanodots were imaged from the outside of the nanopores, that is, on the planar regions of the oxide. Moreover, the analysis showed the presence of dots with different size, the largest having sizes much larger than the pores, this suggesting that the growth of the large dots proceeded at the expense of the small dots. Moreover, the density of the Au dots was in this case 1.3 × 1010 cm−2, which compared to the total density of the nanopores (6 × 1010 cm−2) indicates that the 20% of nanopores was in this case saturated by the gold. Compared to the 800 °C case, where the totality of the nanopores were saturated, this suggests that some out-diffusion from the nanopores may have taken place. Figure 6(b) is a cross section TEM analysis of the same sample as in Fig. 6(b) showing one nanopore completely filled with gold. As it is possible to see the gold was in contact with the Si substrate, and filled the pore up to the surface. The micrograph also showed some pores close to first described, which were completely empty. Apparent etch depth variations among the pores were an artifact of TEM sample preparation.
(a) Au dot density, (b) diameter, and (c) coverage for the as deposited samples (circles) and for the samples annealed for 1 hr at 600 °C (squares), 800 °C (diamonds), and 1000 °C (triangles).

SEM image in plan view of the nanopatterned oxide substrate after the deposition of Au dots and annealing at 1000 °C for 1 hr. It is possible to see the nanopores in the SiO2 substrate (black circles) and the gold nanodots diffused in the nanopores (white spots).

What played an important role, together with the annealing temperature, was the preparation of the substrate surface. Figure 7 presents the TEM analysis in plan view of a sample annealed at 800 °C for 1 h, in the same conditions as in Fig. 3(b), but the sample clearly presented a random dispersion of the dots.
TEM in plan view for a sample annealed at 800 °C for 1 hr with untreated surface.

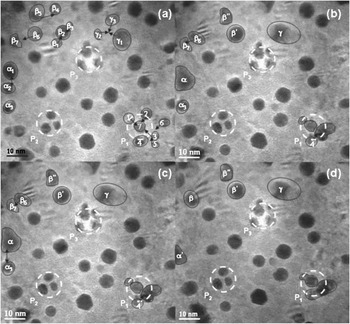
The early stage of the Au diffusion toward the nanopores was followed by in situ annealing during TEM analysis. The sample was heated to 700 °C at a rate of 25 °C/min. Figure 8 depicts bright-field images acquired at various times after the temperature reached 700 °C. In the image of Fig. 8(a) the pores are denoted by the white dashed circles, and identified as P1, P2, and P3. Also in the image, several groups of dots which diffuse on the substrate and/or toward the pore are highlighted by the black shapes. In particular, the group of Au dots marked with numbers 1 to 7 diffuse and coalesce inside pore P1. The Au dots present inside pores P2 and P3 remain immobile during the analysis. In the regions outside the pores many events of ripening are observed. For example, the groups of Au dots identified by α, β, and γ undergo ripening and form larger dots, as pointed out by the black arrows in Figs. 8(a), 8(b), and 8(c).
Bright field TEM micrographs acquired during in situ thermal annealing at 700 °C for (a) 2 s, (b) 58 s, (c) 116 s, (d) 169 s. The black arrows indicate a group of Au dots which diffuse toward one of the nanopores of the substrate (which appears as the white circular region in the micrograph), while the black circle indicates a gold dot inside a nanopore that does not change its position during annealing.

It is interesting to note that nucleation and growth does not occur at the same location in each pore, despite the fact that the structural characteristics are the same for every pore. Typically, during the early stages of annealing, more than one nucleus forms in the pore and they are randomly positioned inside it. This suggests that there are a large number of surface defects at each pore, despite its small size.
During the whole preparation process of these type of templated substrates, atomic diffusion of Au into the Si is known to take placeReference Putnam, Filler, Kayes, Kelzenberg, Guan, Lewis, Eiler and Atwater7, Reference Perraud, Poncet, Noël, Levis, Faucherand, Rouvière, Thony, Jaussaud and Delsol8, Reference Allen, Hemesath, Perea, Lensch-Falk, Li, Yin, Gass, Wang, Bleloch, Palmer and Lauhon26 and can represent a limiting factor for the performance of the silicon nanowire solar cells realized by Au mediated VLS, because it produces a high density of localized electronic states within the bandgap which act as generation-recombination centers. Regarding the introduction of mid-gap traps due to gold diffusion, Perraud et al. found that the value of the reverse current in the p-n junction of their Si nanowire array solar cell, grown by Au mediated VLS, was on the order of 1 mA/cm2, that is, extremely high compared to that of a typical silicon wafer solar cell (i.e., 1 pA/cm2).
In our experiment, we estimate an upper limit for the concentration of gold for atomic diffusion toward the bulk, and it is, for the highest temperature that we used, equal to 1.7 × 1016 cm−3,Reference Putnam, Filler, Kayes, Kelzenberg, Guan, Lewis, Eiler and Atwater7 that is, comparable to the thermodynamic bulk equilibrium concentration at 1000 °C.Reference Bullis27
In order to improve the carrier’s lifetime, and also to ensure compatibility with CMOS fabs, where Au may be questionable, the catalytic properties of other metals (Al, Cu, and Ni) can also be considered for the preparation of such ordered metallic nanotemplates.
IV. CONCLUSION
An easy and low-cost method to obtain ordered gold nanodots on Si substrates laterally isolated by SiO2 was demonstrated. The method started with the formation of a hexagonal nanopattern through the self-assembly of diblock copolymer lithography. Then gold nanodots were randomly sputtered on the patterned substrate and subjected to thermal annealing at different temperatures. Their density outside the nanopores was found to decrease, and at the proper temperature, the total saturation of the nanopores was obtained. The surface chemical conditions before gold sputtering were found to play an important role, together with the thermal budget. The TEM analysis with in situ annealing followed the early stages of the diffusion process.
ACKNOWLEDGMENTS
We thank Salvatore Di Franco of CNR-IMM for his expert and valuable support during the sample preparation, and Gaetano Di Benedetto, Francesco La Mantia, Vincenzo Litrico, of STMicroelectronics for important help in some phases of the processing and analysis of the samples.