

The dominant theory of electoral behaviour in European Parliament elections (EPEs) predicts that government parties lose votes when compared to national first-order elections (FOEs) (Reif and Schmitt Reference Reif and Schmitt1980: 9–10). The core mechanism underpinning this pattern is that second-order elections (SOEs), such as EPEs, are perceived as less politically consequential. This perception leads to lower turnout and a distinct voter composition, with participants more likely either to express dissatisfaction with government performance or to vote sincerely for parties they feel close to but would not support in FOEs for strategic reasons. Consequently, government parties face a comparative disadvantage. However, these losses are not expected to be uniform across cases, as they are shaped by contextual factors, most notably, the timing of EPEs within the national electoral cycle (NEC), which varies across countries.
Several explanatory mechanisms beyond these basic propositions, while not fully testable in the original study due to limited data, have been examined in subsequent studies. These works have mainly examined the interaction between party size and government status (e.g. Curtice Reference Curtice1989; Hix and Marsh Reference Hix and Marsh2011), the role of ideological extremity (e.g. Oppenhuis et al. Reference Oppenhuis, van der Eijk, Franklin, van der Eijk and Franklin1996; Wondreys Reference Wondreys2023) and other ideological and contextual factors (e.g. Ferrara and Weishaupt Reference Ferrara and Weishaupt2004). The crucial conditional effects of election timing on government losses have also been repeatedly assessed (e.g. Hix and Marsh Reference Hix and Marsh2007, Reference Hix and Marsh2011; Marsh Reference Marsh1998; Oppenhuis et al. Reference Oppenhuis, van der Eijk, Franklin, van der Eijk and Franklin1996; Schmitt et al. Reference Schmitt, Sanz, Braun and Teperoglou2020; Weber Reference Weber2007, Reference Weber2011). However, other plausibly important determinants of government parties’ performance across European SOEs and national FOEs, yet not incorporated in the SOE model, remain theoretically unexplored and largely untested. One especially relevant factor, highlighted in the broader comparative electoral behaviour literature, is clarity of responsibility (e.g. Anderson Reference Anderson2000; Fisher and Hobolt Reference Fisher and Hobolt2010; Lewis-Beck Reference Lewis-Beck1988; Powell and Whitten Reference Powell and Whitten1993). This may be particularly consequential in EPEs given supply-side dynamics: campaigning intensity seems to vary systematically with party size, with smaller parties potentially taking these elections more seriously (Bartels Reference Bartels2023; Kovář and Kovář Reference Kovář and Kovář2013), while media coverage is often limited and domestically framed (van Egmond Reference van Egmond, van der Brug and van der Eijk2007). In such contexts, voters may rely even more on simple responsibility heuristics.
This study thus primarily aims to fill this gap. Building on extensive existing research, I posit that variation in clarity of responsibility strongly shapes the electoral outcomes of individual government parties in EPEs. Consequently, I focus on whether government parties’ expected losses vary with parties’ electoral size (cf. Curtice Reference Curtice1989) and cabinet role, as well as with other factors that structure responsibility attribution (coalition size, the distribution of ministerial portfolios and prior government experience). In addition, to extend the analysis beyond formal cabinet members, I test whether parties providing official external support to governments are also punished in EPEs.
Moreover, while the SOE model, and particularly its proposition regarding government party losses, is often considered nearly a ‘law’ in explaining electoral behaviour in EPEs, it is often overlooked that, in general, the subsequent studies provided rather mixed support in terms of the validity of its predicted mechanisms. This is particularly true for the arguably crucial effect of election timing (see e.g. Hix and Marsh Reference Hix and Marsh2007: 498). Drawing on a novel dataset covering the vote shares of all parties in EPEs and corresponding FOEs from 1979 to 2024, this study thus also provides a systematic theoretical and empirical reassessment of underlying mechanisms predicted to explain government party losses in EPEs.
Finally, the article is also motivated by the growing political relevance of the European Union (EU) and the European Parliament (EP), which today engage with more consequential policy issues than ever before. Recent and ongoing crises (e.g. the COVID-19 pandemic, Russia’s aggression against Ukraine and the return of Donald Trump to the White House) underscore the need to understand how electoral dynamics at the EU level and beyond may be changing. Improving our ability to explain and anticipate shifts in EP composition, as well as shifts in voting patterns between national FOEs and EPEs, is therefore crucial not only for academic inquiry but also for broader assessments of Europe’s political trajectory. This article thus also reflects on both continuity and change in patterns of electoral behaviour in EPEs over time. As earlier work has suggested (e.g. Oppenhuis et al. Reference Oppenhuis, van der Eijk, Franklin, van der Eijk and Franklin1996; van der Eijk et al. Reference van der Eijk, Franklin and Marsh1996), EPEs can also serve as a valuable laboratory for broader questions of comparative electoral behaviour, particularly with regard to protest and sincere voting (see also Hobolt and Spoon Reference Hobolt and Spoon2012; Weber Reference Weber2011). While aggregate-level analyses like the one presented here can only be a first step towards unpacking these micro-level processes, introducing a theoretically central but underused mechanism such as clarity of responsibility alongside a more comprehensive reassessment of classic SOE dynamics such as election timing provides a stronger foundation for subsequent individual-level research.
Clarity of responsibility and government punishment in European elections
The core argument of the SOE model that less is at stake in EPEs (Reif and Schmitt Reference Reif and Schmitt1980: 9–10) leads to several individual-level mechanisms explaining (aggregate-level) government party performance relative to FOEs. Primarily, government party voters may feel less motivated to participate in EPEs, as more ‘important’ FOEs have already been won. In contrast, opposition voters, dissatisfied with the FOE outcome, can use EPEs as an opportunity to signal their discontent. Moreover, some loyal government voters may temporarily defect to an opposition party in the EPE, as some voters will inevitably be disillusioned with the government’s performance, without necessarily changing their overall party allegiance (see also Schmitt et al. Reference Schmitt, Sanz, Braun and Teperoglou2020: 8; Weber Reference Weber2007, Reference Weber2011).
Furthermore, some voters may feel liberated from strategic concerns in EPEs, as their vote does not influence the composition of the national legislature, making it seem inconsequential. The electoral system in EPEs may also be less disproportional than in FOEs in some of the EU member states, reducing the concerns of a ‘wasted vote’ (Duverger Reference Duverger1964; see also, e.g. Anckar Reference Anckar1997). This can encourage voting for smaller and/or newer parties that voters feel aligned with but would not typically support in FOEs due to their lower chances of success. As a result, this sincere vote dynamic generally disfavours government parties in EPEs relative to FOEs.
These basic motivations, however, are shaped by the specific context of EPEs in each EU country, particularly due to differences in election timing across countries (Reif and Schmitt Reference Reif and Schmitt1980: 9–10). EPEs can occur shortly after FOEs (honeymoon), in the middle between two FOEs (mid-term), and/or long after FOEs, potentially close to the next ones (late-term). The proposed logic is inspired by the cyclical pattern of presidential party support in US mid-term elections. This model posits that at the start of the cycle, shortly after the presidential election, there is a surge in general support for the presidential party driven by ‘unrealistic expectations unaccompanied by commitment to the man or his policies’. The initial boost is followed by a gradual decline over approximately three years as disillusionment sets in due to unmet expectations. Towards the end of the term, support then tends to recover, as approval returns ‘to (very roughly) the plurality which elected him’ (Stimson Reference Stimson1976: 10; see also Goodhart and Bhansali Reference Goodhart and Bhansali1970).
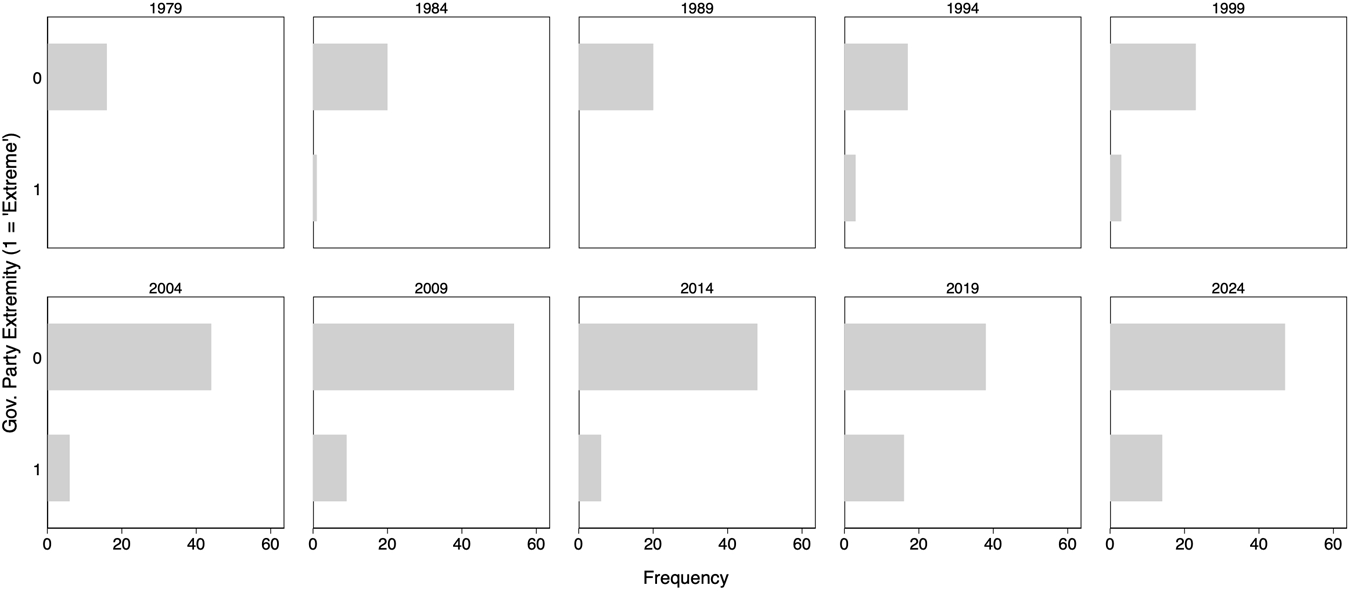
Election timing, however, is not the only factor likely to condition the government status effect in EPEs. Party size has long been argued to shape the electoral fortunes of government parties (e.g. Curtice Reference Curtice1989), and supply-side dynamics may amplify this pattern, as smaller and niche parties often have stronger incentives to campaign intensively in EPEs, whereas larger parties may treat them as lower priority contexts (Bartels Reference Bartels2023; Kovář and Kovář Reference Kovář and Kovář2013). Empirically, Simon Hix and Michael Marsh (Reference Hix and Marsh2011: 7) conclude that ‘large parties lose votes in EPEs, while small parties gain votes, regardless of whether these parties are in government or opposition’. However, reassessing these patterns remains important, particularly considering shifts in government composition and the growing relevance of party extremity. Two decades after the 2004 EU enlargement (cf. Koepke and Ringe Reference Koepke and Ringe2006), challenger and Eurosceptic actors have become more common participants in national cabinets. Indeed, Jakub Wondreys’ (Reference Wondreys2023) data indicate that in the last two elections, nearly 20% of parties classified as ‘extreme’ contested EPEs while in government, compared to zero (or near-zero) levels in the first five elections (see Figure 1). To the extent that such parties also potentially devote more attention to EU-related issues, which broadly increase in salience, and combine ideological extremity with Euroscepticism (Wondreys Reference Wondreys2023: 8), their presence in government may complicate the established SOE model’s expectations.
Representation of Extreme Parties in National Governments at the Time of the EPE

Figure 1 Long description
The image contains nine small-multiple histograms arranged in two rows. Each histogram shows the frequency distribution of government party extremity for a specific election year. The horizontal axis is labeled Frequency and ranges from 0 to 60 across all panels. The vertical axis is labeled Gov. Part y Extremity (1 equals lowest). The panels are presented for the following years: 1970, 1980, 1990, 2000, 2004, 2009, 2014, 2019 and 2020. All panels share the same axis scale, allowing direct comparison across years. Each panel contains a single set of bars with no legend present. For 1970: the distribution is concentrated at the lower end of the extremity scale, with a peak frequency near 60 at the lowest extremity level. For 1980: a similar pattern with mass concentrated at low extremity levels and a visible peak near frequency 50. For 1990: the distribution remains concentrated at low extremity, with frequency around 40 to 50 at the lowest levels. For 2000: distribution still skewed toward low extremity, with a peak near frequency 40. For 2004: the distribution begins to show a broader spread, with bars extending toward mid-range extremity levels and a reduced peak at the lowest level. For 2009: distribution shows further spread across extremity levels, with frequency values more evenly distributed. For 2014: the distribution shows bars present at both low and mid-range extremity levels, suggesting a wider spread. For 2019: bars are visible across a broader range of extremity levels compared to earlier years. For 2020: the distribution shows notable frequency at mid to higher extremity levels, with bars extending further along the extremity axis than in earlier panels. Across all nine panels, the overall pattern shows a shift from distributions heavily concentrated at low extremity in earlier decades toward broader and more spread distributions in later years.
Importantly, beyond the need to re-evaluate some of the existing explanatory frameworks, several mechanisms underpinning electoral behaviour in EPEs remain substantially underexplored. One particularly important factor is the effect of clarity of responsibility on voters’ ability to hold incumbents accountable (e.g. Anderson Reference Anderson2000; Duch and Stevenson Reference Duch and Stevenson2008; Fisher and Hobolt Reference Fisher and Hobolt2010; Lewis-Beck Reference Lewis-Beck1988; Nadeau et al. Reference Nadeau, Niemi and Yoshinaka2002; Powell Reference Powell2000; Powell and Whitten Reference Powell and Whitten1993; Whitten and Palmer Reference Whitten and Palmer1999). While the validity of this explanatory factor has been repeatedly emphasised, it is largely overlooked in the literature on EPEs.
This may be because, as noted, the SOE model draws heavily on the US mid-term voting theories, where the two-party system ensures relatively clear responsibility for government policies, making it easier for voters to punish or reward incumbents (Norpoth Reference Norpoth2001; see also Anderson Reference Anderson2000). However, in European party systems, power is typically shared between different coalition parties, which can obscure the lines of accountability. Institutional settings also vary significantly across countries and over time, resulting in fluctuating degrees of clarity of responsibility (Anderson Reference Anderson2000; Nadeau et al. Reference Nadeau, Niemi and Yoshinaka2002; Whitten and Palmer Reference Whitten and Palmer1999). In such heterogeneous and often fragmented multiparty systems, it is unlikely that voters will punish all coalition partners equally (Anderson Reference Anderson2000; Hobolt et al. Reference Hobolt, Tilley and Banducci2013; Klüver and Spoon Reference Klüver and Spoon2020).
This has direct implications for second-order voting. Beyond the well-established effect of election timing, which suggests that incentives for protest and the relative weight of sincere voting vary across the NEC (see also Weber Reference Weber2011), variation in clarity of responsibility should structure who can be credibly targeted. In short, voters cannot cast a meaningful protest vote in EPEs unless they can identify plausible objects to blame. This also implies that election timing and clarity of responsibility may be linked: where responsibility is concentrated, timing effects should be more pronounced, as voters can more readily attribute credit and blame; where responsibility is diffused, timing effects should be weaker and less cyclical (cf. Oppenhuis et al. Reference Oppenhuis, van der Eijk, Franklin, van der Eijk and Franklin1996) because accountability becomes blurred and protest incentives are harder to channel towards specific government parties.
To examine whether responsibility attribution operates as expected, also considering the supply-side dynamics and broader changes in party competition discussed above, it is useful to first reassess the moderating role of party size. However, two competing logics can apply here, presenting an interesting puzzle. On the one hand, Christopher J Anderson (Reference Anderson2000) argues that the smaller a party’s representation in the cabinet, the less influence it wields over policy outcomes, which weakens the perceived link between the party and government performance. This, in turn, reduces the likelihood of the party being either punished or rewarded in subsequent elections. On the other hand, Heike Klüver and Jae-Jae Spoon (Reference Klüver and Spoon2020) find that junior coalition partners often suffer electorally in subsequent national elections. They attribute this to their limited capacity to implement policy agendas and their difficulty in distinguishing themselves from senior coalition partners, which can lead to voter misperceptions about their role in government. Comparing party performance between EPEs and the preceding FOE thus also offers a useful ‘laboratory’ setting (cf. van der Eijk et al. Reference van der Eijk, Franklin and Marsh1996) for evaluating how party size conditions responsibility attribution. I thus first test the following hypothesis:
Hypothesis 1: Small government parties do (not) lose votes in EPEs compared to the previous FOE.
Beyond party size, voters’ ability to identify a single government party to reward or punish may depend on whether that party holds the position of head of government (HoG), i.e. being a senior coalition partner. Sara Hobolt et al. (Reference Hobolt, Tilley and Banducci2013) posit that such a party is not only likely to wield the most power within a coalition but also tends to attract greater media attention. The government’s performance should thus be closely associated with the performance of the HoG (see also Fisher and Hobolt Reference Fisher and Hobolt2010: 361). Even here, however, a competing logic exists. Ana Ines Langer and Iñaki Sagarzazu (Reference Langer and Sagarzazu2018) demonstrate that in certain contexts, multiparty governments can lead to a decrease in media personalisation and an increase in coverage of other cabinet members. This suggests a potential dispersion of perceived responsibility, thereby diminishing the clarity of responsibility typically afforded to the HoG (Langer and Sagarzazu Reference Langer and Sagarzazu2018: 490). I therefore also propose and test:
Hypothesis 2: Relative to the HoG party, other government parties do (not) lose votes in EPEs compared to the previous FOE.
Beyond size and seniority, several additional factors should shape voters’ ability to allocate responsibility within coalition governments. First, ministerial portfolio allocation should matter. Although voters may not track specific policy jurisdictions, research shows that responsibility attributions often follow heuristics related to a party’s overall presence in the cabinet (e.g. Angelova et al. Reference Angelova, König and Proksch2016; Duch and Falcó-Gimeno Reference Duch and Falcó-Gimeno2021). A larger share of ministries signals greater participation in governing and thus greater visibility and influence. Second, coalition size should be a foundational determinant of clarity. As coalition size increases, responsibility becomes more diffuse, making it harder for voters to identify a single actor accountable for policy outcomes (Anderson Reference Anderson2000; Powell and Whitten Reference Powell and Whitten1993; Whitten and Palmer Reference Whitten and Palmer1999). Larger coalitions should therefore tend to dilute electoral accountability. Third, prior government experience may further condition responsibility attributions (Duch and Stevenson Reference Duch and Stevenson2008), since parties with repeated experience in office may be viewed as more institutionally embedded and politically competent. Voters may therefore assume they exert greater influence over outcomes (e.g. Alt et al. Reference Alt, Bueno de Mesquita and Rose2011). Accordingly, I also assess:
Hypothesis 3: Government parties holding a larger share of ministries are more likely to lose votes in EPEs compared to the previous FOE.
Hypothesis 4: Government parties in larger coalitions are less likely to lose votes in EPEs compared to the previous FOE.
Hypothesis 5: Government parties with prior governing experience are more likely to lose votes in EPEs compared to the previous FOE.
Finally, responsibility may extend beyond formal cabinet membership. In increasingly fragmented European party systems, minority governments frequently rely on confidence-and-supply agreements, whereby non-cabinet parties, officially bound by a contract, provide external support to the government in exchange for policy concessions (e.g. Bassi Reference Bassi2017; Strøm Reference Strøm1990). Since these agreements are typically public and politically salient, there are good reasons to expect that parties providing such support may also be held accountable (Thürk and Klüver Reference Thürk and Klüver2025; cf. Thesen Reference Thesen2016), and therefore also potentially punished in EPEs. I therefore also test:
Hypothesis 6: Parties that provide confidence-and-supply support to the government are more likely to lose votes in EPEs compared to the previous FOE.
Data and variables
I employ an extended version of Wondreys’ (Reference Wondreys2023) dataset on vote shares in EPEs and corresponding FOEs, covering all parties and elections from 1979 to 2019. Results from the 2024 EPE are added using data provided by the official EP website,Footnote 1 and cross-validated with the official country-level sources where available. To supplement missing information on clarity of responsibility indicators (ministries share, the simple and effective number of coalition parties, and external support), I draw on The Representative Democracy Data Archive (REPDEM) (Hellström et al. Reference Hellström, Bergman, Lindahl and Gustafsson2025) and the Political Parties, Presidents, Elections and Governments (PPEG) (Krause et al. Reference Krause, Döring and Stoppe2025) datasets. Data on government experience are added manually, based on information on government participation already included in the datasets.
To ensure the accurate calculation of the dependent variable, parties that did not contest either the EPE or the corresponding FOE are excluded. This means, for instance, that parties for which the EPE was the first election they ever contested are not included. Further exclusions apply to parties that changed electoral coalitions between elections, unless it was possible to retrieve disaggregated vote share data for individual parties within those coalitions; in such cases, the vote shares of individual parties, rather than the entire coalition, are compared. Additionally, parties from countries where EPEs and FOEs are held on the same day, as well as those where a cabinet had not yet been formed at the time of the EPE (and thus no government record could be evaluated by voters), are omitted (see Wondreys Reference Wondreys2023: 4). To allow for accurate comparisons between government and opposition parties, an additional category (‘other’) is introduced to capture vote shares of opposition parties excluded for these reasons. Consequently, for each election, the total vote share always sums to 100%.Footnote 2
The dependent variable is the difference in vote share between the EPE and preceding FOE (ΔVote Share = Vote Share EPE – Vote Share FOE). The key explanatory variable is the party’s government status at the time of the EPE (1 = government, 0 = opposition). To test H1, I first interact this variable with the party’s vote share in the preceding FOE, which serves as the standard indicator of party size.Footnote 3 Next, the government status is first replaced by the Clarity variable (0 = opposition, 1 = government but not HoG, and 2 = HoG) and subsequently by the percentage of ministries held by each government party at the time of the EPE. These specifications test H2 and H3, respectively. To address H4, I then introduce interaction terms between government status and the number of coalition parties (M4) and, alternatively, the effective number of coalition parties (M4a). In the following model (M5), government status is interacted with a binary indicator coded as 1 if a party had participated in government at least once in the 20 years preceding the relevant FOE to test H5. Finally, to address H6, I employ a categorical variable distinguishing opposition parties (0), non-cabinet parties providing formal external support through written confidence-and-supply agreements (1) and cabinet parties (2).Footnote 4
The models also include several control variables that could influence the impact of the explanatory variables on the dependent variable based on expectations derived from SOE theory. These include the difference in turnout (ΔTurnout = Turnout EPE – Turnout FOE) and the position of the EPE in the NEC (Cycle).Footnote 5 The party size variable, used as an explanatory variable in M1, is included as a control in all subsequent models except M3, given that it is highly correlated with ministerial portfolio share (r = 0.91), which can itself be interpreted as a size-related indicator, creating multicollinearity.Footnote 6 To account for the temporal dimensions of my data, I also include a control for the election year, a continuous variable ranging from 1979 to 2024. The spatial dimension of the data is addressed through the inclusion of country-level fixed effects (FE), which account for unobserved heterogeneity across political systems (see below). Additionally, I control for changes in economic performance using the difference in GDP growth between the EPE and preceding FOE (ΔGDPGrowth = GDPGrowth EPE – GDPGrowth FOE). This allows me to account for arguably the most relevant time-varying confounder (i.e. state of the economy) as regards government performance across elections, which cannot be captured by country-level FE that only account for time-invariant country characteristics.
Statistical tests
This study combines descriptive statistics with country-level FE regression models estimated with robust standard errors.Footnote 7 The descriptive analysis documents long-term patterns in vote-share differences between EPEs and the preceding national FOEs from 1979 to 2024 and formally tests whether these differences are statistically significant. The regression analyses then assess the independent effects of the key explanatory variables specified above.
Country-level FE models are particularly well-suited to this research design, as they account for unobserved, time-invariant heterogeneity across EU member states, including institutional arrangements, party systems and political cultures, which may shape electoral behaviour in important but difficult-to-measure ways (Wondreys Reference Wondreys2023: 5; see also Allison Reference Allison2009). Unlike ordinary least squares regression, which assumes homogeneity across units, FE models explicitly control for such country-specific characteristics. This makes them especially appropriate in the context of EPEs, where cross-national contextual variation is both substantial and theoretically consequential. Accordingly, this study combines country-level FE with controls for temporal dynamics and party-level variation, drawing on the most comprehensive set of observations available to date.
Findings
I first broadly assess whether government parties systematically lose support in EPEs compared to the preceding FOE. The results confirm this expectation. On average, government parties lost approximately 4 percentage points (p.p.) in EPEs relative to their FOE performance, corresponding to an 18.3% decline. Notably, in no election set did government parties perform better in the EPE than in the FOE. While the magnitude of these losses is not entirely uniform across time, the overall pattern is remarkably stable. In most election sets, the decline ranges between roughly 3 and 5 p.p. The main exceptions are the first two EPEs and, in particular, the 2004 EPE, when government parties lost over 6 p.p., equivalent to a decline of more than 27%. However, the pattern largely returned to ‘normal’ in subsequent elections.Footnote 8
As regards the key focus of my analysis, the impact of the clarity of responsibility, the findings were largely clear and in the expected direction, while also suggesting that some factors matter more than others. First, among government parties receiving less than 10% of the national vote (N = 108), the difference in vote shares is statistically insignificant (mean = + 0.4 p.p.; p = 0.28). This indicates that small government parties tend to perform similarly, or even slightly better, in EPEs compared to FOEs. Conversely, medium-sized (10%–30%) government parties (N = 159) experience significant average losses (−3.49 p.p.; p < 0.001), and for large (>30%) parties (N = 105), the loss deepens to −9.18 p.p. (p < 0.001).Footnote 9
The regression analysis confirms this relationship in a more nuanced way. While the higher-order Government × Size interaction terms in M1 are not individually statistically significant (Table 1), their combined effect yields a clear downward trend in the marginal-effects plot (Figure 2), indicating that the electoral cost of government participation increases with party size. Small governing parties perform similarly to opposition parties in EPEs relative to FOEs, whereas large governing parties experience substantially greater losses. Overall, these results provide robust evidence that electoral punishment in EPEs is concentrated among dominant governing parties, while smaller coalition partners tend to avoid being punished, thus supporting H1.
Marginal Effect (95% CI) of Government Status on ΔVote Share across Party Size

Figure 2 Long description
A scatter plot with a fitted curve and a shaded band. The horizontal axis label is Part y Size. The horizontal axis shows tick labels 0, 0.2, 0.4, 0.6, 0.8, 1. The vertical axis label is Marginal Effect on Ch. in Vote Share (EPE minus Nat). The vertical axis shows tick labels negative 60, negative 40, negative 20, 0, 20, 40. Many circular markers are concentrated near Part y Size values close to 0 and Marginal Effect values close to 0. Markers are more sparse as Part y Size approaches 1. A dashed horizontal reference line is drawn at 0 on the vertical axis. A solid curve starts near 0 at Part y Size 0 and slopes downward as Part y Size increases. The curve is near negative 10 around Part y Size 0.6, near negative 20 around Part y Size 0.8 and near negative 35 to negative 40 near Part y Size 1. A shaded band surrounds the curve and widens as Part y Size increases, extending to lower vertical axis values near Part y Size 1.
Country-Level Fixed Effects Regression Models: Determinants of ΔVote Share (Vote Share EPE – Vote Share FOE)

Table 1 Long description
The table reports three country fixed-effects regression models predicting the change in vote share between two election types. In model 1, party size is positive and statistically significant, while the squared size term is negative and significant and the cubed size term is positive and significant, indicating a nonlinear relationship. Government status is not statistically significant in model 1, and its interactions with size terms are also not statistically significant. In model 2, the nonlinear size pattern remains significant, and opposition clarity is positive and statistically significant, while junior clarity is not statistically significant and senior clarity is the reference category. Model 3 includes ministries share, which is negative and statistically significant, and the constant is not statistically significant; size terms are not reported in this model. Model fit is modest, with R-squared values of 0.26 for model 1, 0.24 for model 2, and 0.17 for model 3. Sample sizes differ across models, with 1,568 observations in models 1 and 2 and 363 in model 3, across 27 countries in all models. Standard errors are robust, so significance reflects uncertainty adjusted for heteroskedasticity.
Note: Results for control variables are reported in Table S3 in the Supplementary Material.
Robust standard errors in parentheses.
*** p < 0.01, **p < 0.05, *p < 0.1.
Second, there are clear differences in government parties’ performance depending on their seniority. While both HoG (N = 169) and junior coalition partners (N = 203) lose significantly in EPEs relative to FOEs (p < 0.001), these losses are substantially larger for the former (−6.89 p.p. compared to −1.54 p.p.).Footnote 10 The regression results in M2 reinforce this pattern: relative to HoG parties, junior coalition members exhibited a modest relative advantage in EPEs, although this difference is not statistically significant (Table 1). These findings thus provide substantial support for H2, while it should be noted that junior status does not fully offset the overall electoral penalty associated with government participation.
Third, regarding the effect of cabinet portfolio share, the descriptive analysis indicates that government parties with low ministry shares (≤20%) show no meaningful difference between EPEs and FOEs (+0.02 p.p.; p = 0.970). Conversely, parties controlling 20%–50% of ministries lose 3.10 p.p., while those controlling over 50% lose 8.82 p.p. (both p < 0.001).Footnote 11 The FE regression (M3) confirms this pattern: each unit increase in ministry share is associated with an 11-point decline in EPE–FOE performance (p < 0.001) (Table 1). Figure 3 further illustrates this, showing a steady downward slope, from near zero at low ministerial shares to around −10 to −15 points at the highest shares. These results thus largely confirm H3. However, it should be acknowledged that this analysis is based on a substantially smaller subset of government parties only (N = 363), limiting statistical leverage relative to models estimated on the full sample.
Marginal Effect (95% CI) of a Party’s Share of Ministries on ΔVote Share

Figure 3 Long description
The horizontal axis label is Part y’s Ministries Share. The horizontal axis ranges from 0 to 1, with tick labels 0, point 2, point 4, point 6, point 8, 1. The vertical axis label is Marginal Effect on change in Vote Share (EPE minus FOE). The vertical axis ranges from negative 35 to 10, with tick labels negative 35, negative 30, negative 25, negative 20, negative 15, negative 10, negative 5, 0, 5, 10. Circular markers are plotted as a single series with the same marker style. A horizontal dashed reference line runs across the plot at 0 on the vertical axis. A solid fitted line slopes downward from left to right, with two additional lines close to it, one above and one below, forming a band around the fitted line. Markers are spread across the full horizontal range from 0 to 1. The densest concentration of markers appears around Part y’s Ministries Share near point 2 to point 8 and vertical values near negative 10 to 0. Markers are sparser near the far left close to 0 and near the far right close to 1. Several markers appear below negative 20 on the vertical axis.
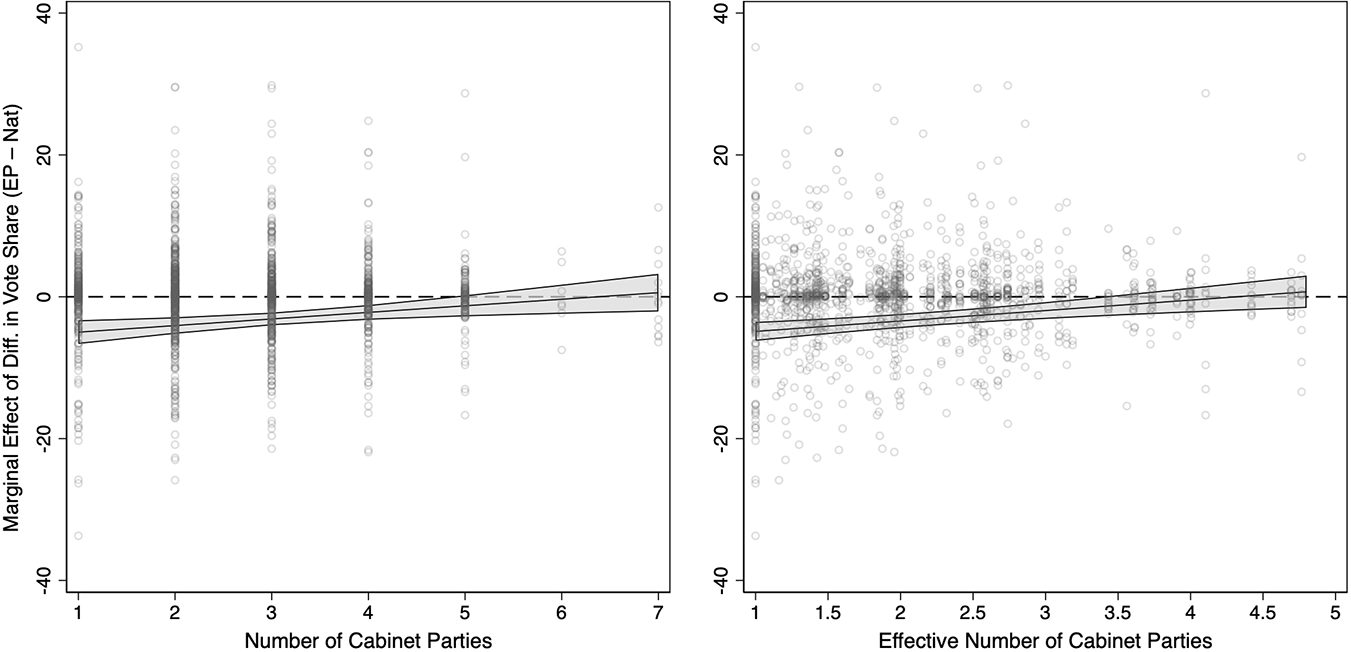
Fourth, electoral losses in EPEs relative to FOEs are largest in small coalitions. Governments consisting of one to two parties (N = 147) lose 6.28 p.p. and those in three to four party coalitions (N = 170) lose 2.99 p.p. (both p < 0.001), whereas parties in coalitions of five or more parties (N = 55) show no statistically significant difference (0.82 p.p.; p = 0.284).Footnote 12 However, the small number of cases in this last category contributes to the wider standard errors and lack of significance. The regression results in M4 and M4a (Table 2) corroborate this pattern: the magnitude of government-party losses decreases as coalition size increases. In other words, the larger and more fragmented the governing coalition, the less strongly voters punish each governing party in EPEs, supporting H4. Figure 4 further illustrates this, showing a modest upward trend in the marginal effect of government status across coalition size. Nonetheless, the plot also reveals the visible clustering of observations at low coalition sizes, which limits estimation precision at the upper end of the distribution. Consequently, uncertainty increases for very large coalitions where data are sparse, and any apparent positive slope in that range, should be interpreted cautiously.
Marginal Effect (95% CI) of Government Status on ΔVote Share across Coalition Size

Figure 4 Long description
The first scatter plot displays the marginal effect of government status on vote share, measured in percentage points, against the number of cabinet parties. The horizontal axis represents the number of cabinet parties, ranging from 1 to 8. The vertical axis represents the marginal effect on vote share, ranging from negative 10 to positive 10 percent points. A trend line is visible, indicating a slight upward trend as the number of cabinet parties increases. Data points are densely clustered around lower numbers of cabinet parties, with some outliers scattered across the plot. The second scatter plot shows the marginal effect of government status on vote share against the effective number of cabinet parties. The horizontal axis represents the effective number of cabinet parties, ranging from 1.5 to 4.5. The vertical axis again represents the marginal effect on vote share, ranging from negative 10 to positive 10 percent points. A trend line is visible, suggesting a modest upward trend as the effective number of cabinet parties increases. Data points are densely clustered around lower effective numbers, with fewer points at higher values. Both plots aim to illustrate the relationship between coalition size and vote share, highlighting clustering at lower coalition sizes and suggesting increased uncertainty at higher values.
Country-Level Fixed Effects Regression Models: Determinants of ΔVote Share (Vote Share EPE – Vote Share FOE) (M4–M6)

Table 2 Long description
The table reports four country fixed-effects regression models estimating change in vote share between two election types, with coefficients and robust standard errors for each predictor. Party size is positively associated with vote-share change in all models where included (about 8.5 to 13.4), while the squared size term is strongly negative (about minus 68.9 to minus 78.6) and the cubed size term is positive (about 56.5 to 62.5), indicating a non-linear size relationship. Government participation is linked to lower vote-share change in models M4, M4a, and M5 (about minus 2.3 to minus 6.4), but it is not reported in M6. Coalition-party measures alone are small and not statistically clear (for example, number of coalition parties is about minus 0.16; effective number about minus 0.26), yet their interactions with government are positive and statistically strong (about 0.93 in M4 and 1.47 in M4a), suggesting the government penalty is reduced as coalition complexity increases. In M5, government experience is positive (about 1.31), while its interaction with government is negative but not statistically clear (about minus 1.19). In M6, external support is associated with lower vote-share change relative to the opposition reference category (about minus 2.01 for external support yes and minus 3.03 for external support government). Model fit is similar across specifications (R-squared about 0.24 to 0.25) with 27 countries and roughly 1,560 to 1,568 observations, so differences mainly reflect alternative predictors rather than large changes in overall explanatory power.
Note: Results for control variables are reported in Table S3 in the Supplementary Material.
Robust standard errors in parentheses.
*** p < 0.01, **p < 0.05, *p < 0.1.
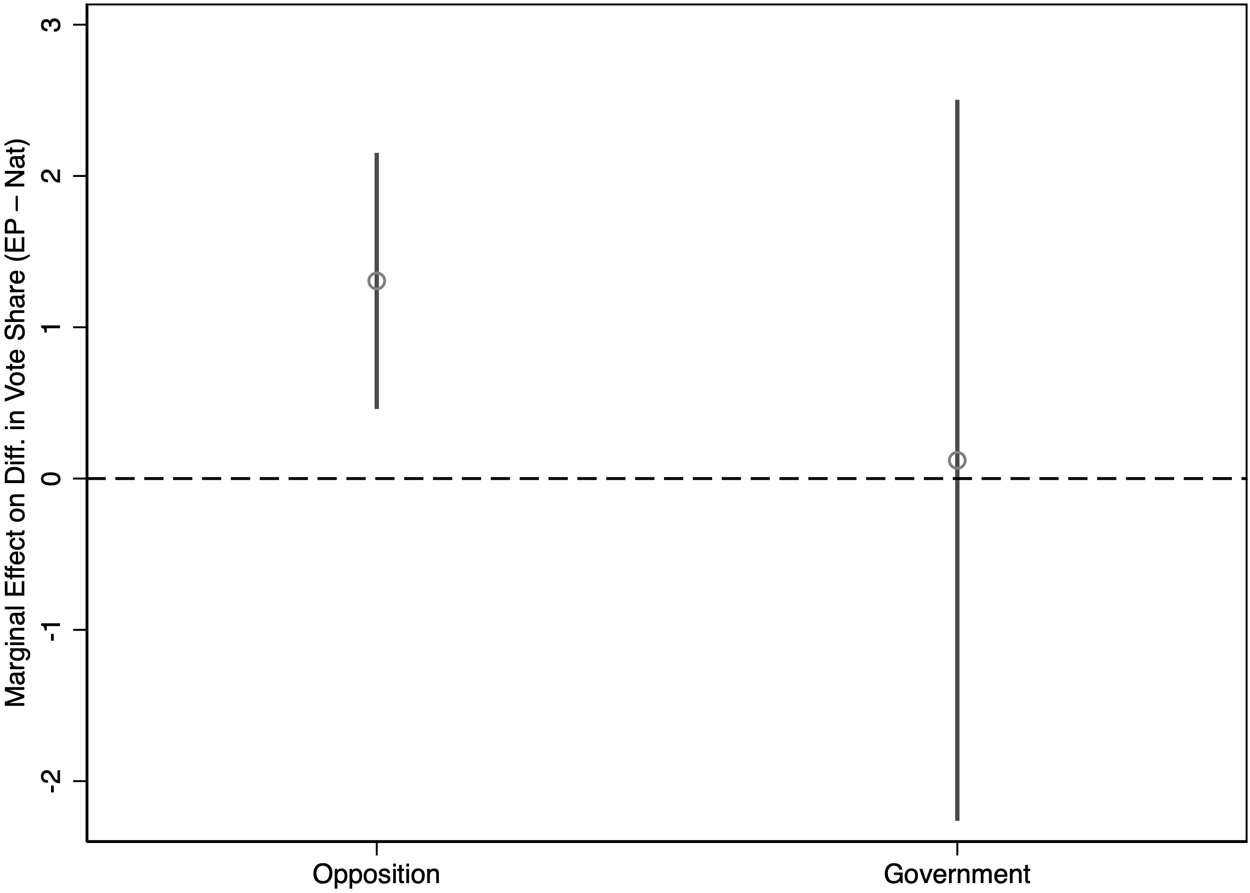
Fifth, contrary to expectations, the results indicate no meaningful difference between experienced and inexperienced governing parties. Descriptively, both incur comparable losses in EPEs relative to FOEs. Experienced parties lose 4.12 p.p. (N = 317, p < 0.001), while inexperienced parties lose 3.1 p.p. (N = 55, p = 0.002).Footnote 13 However, the much smaller number of cases among inexperienced parties limits statistical precision and makes it difficult to identify systematic differences between the two groups. Consistently, in M5 the interaction between government status and prior government experience is negative but statistically insignificant, suggesting that experienced government parties might lose slightly more, but the estimate is too uncertain to support a firm conclusion (Table 2). By contrast, the main effect of government experience reflects a significant advantage among experienced opposition parties, an effect that largely disappears for governing parties (Figure 5). Overall, H5 is hence largely rejected.
Marginal Effect (95% CI) of Prior Government Experience on ΔVote Share

Figure 5 Long description
Marginal Effect on Prior Gov. Exp. The x-axis has two categories: Opposition and Government. The y-axis is labeled Marginal Effect on Prior Gov. Exp. on Vote Share, with tick labels at minus 2, minus 1, 0, 1, 2 and 3. A horizontal dashed reference line is drawn at 0. At Opposition, a single open-circle point is plotted a little above 1, with a vertical error bar extending from a little above 0.5 to a little above 2. At Government, a single open-circle point is plotted at about 0, with a vertical error bar extending from about minus 2 to about 2.5.
Finally, the descriptive analysis demonstrates that parties offering external support to a government experience no statistically significant change in vote share between FOEs and EPEs (−0.32 p.p.; p = 0.580).Footnote 14 Still, the regression results in M6 indicate that external supporters perform significantly worse than opposition parties (p < 0.01), losing around 2 p.p. in EPEs, even though their losses are somewhat smaller than those of parties formally in government (Table 2). Taken together, the evidence for H6 is therefore mixed. It is not evident in the descriptive comparisons but emerges in the regression results. However, it should be emphasised that the number of external-support cases is very small (N = 27), which severely limits statistical power and increases uncertainty around the estimates, especially in the descriptive comparison.
Extension: reassessing second-order mechanisms over time
While the preceding analysis shows that clarity of responsibility helps explain who is punished within governments, my initial motivations also include assessing whether the broader second-order logic operates consistently over time. This question is particularly relevant given that European party systems, the political salience of the EU and the composition of governing coalitions have changed substantially over the past five decades. First, in light of mixed findings in the existing literature, the key conditional mechanism of election timing within the NEC should be reassessed using a more comprehensive dataset. Moreover, it is unclear whether (and how) election timing interacts with clarity of responsibility. Second, the increasing prominence of extreme and Eurosceptic parties, some of which have entered government coalitions, warrants systematic analysis, as it may alter how voters respond to incumbents in EPEs. The following section, therefore, extends the analysis by reassessing core second-order dynamics and by evaluating the effects of ideological extremity and stances towards European integration on government parties’ comparative electoral performance.
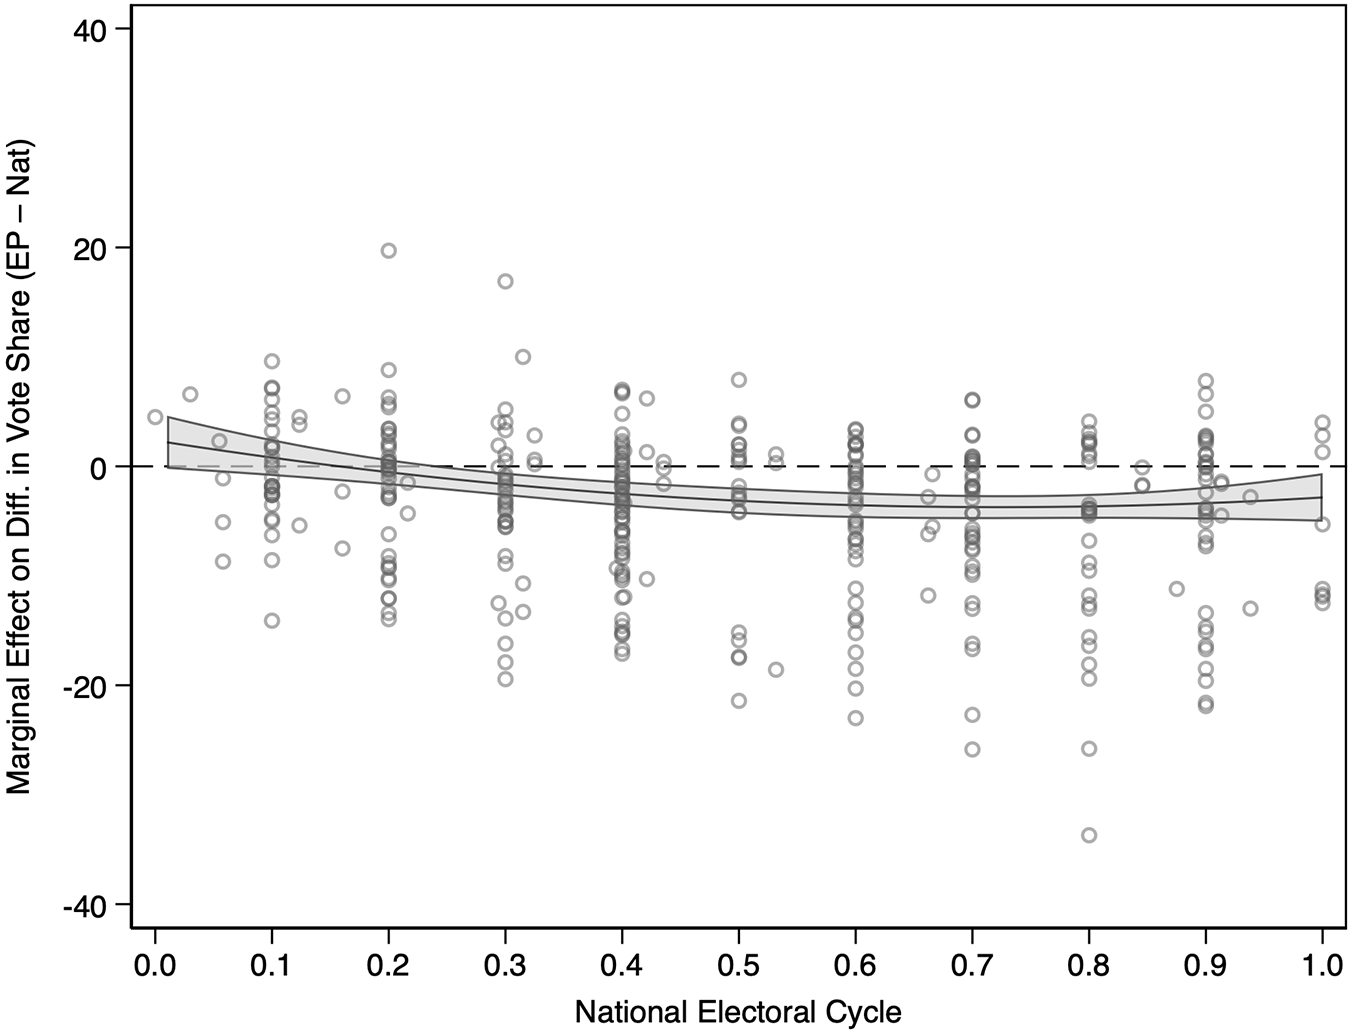
To reassess the timing mechanism (Table 3), I estimate an additional FE model that interacts government status with election timing and its squared term. The results indicate that election timing significantly moderates the incumbency effect. The interaction between Government × Cycle is negative and highly significant (b = −21.52; p < 0.01), while the positive and significant Government × Cycle2 term (b = 14.30; p < 0.05) implies a curvilinear pattern.Footnote 15 Substantively, this suggests that government-party losses tend to increase as EPEs are held further into the NEC, but that this penalty weakens again towards the end of the cycle rather than intensifying continuously. At face value, this could be taken as support for the second-order timing mechanism. Yet the margins plot in Figure 6 reveals that the empirical pattern is weaker than the classic U-shaped expectation and is sensitive to sparse observations at the extreme ends of the NEC.
Marginal Effect (95% CI) of Government Status on ΔVote Share across the National Electoral Cycle

Figure 6 Long description
A scatter plot with a fitted curve and a shaded band around the curve. The horizontal axis label reads National Elections Cycle. The horizontal axis shows tick labels 0, 0.1, 0.2, 0.3, 0.4, 0.5, 0.6, 0.7, 0.8, 0.9, 1. The vertical axis label reads Marginal effect on Δ vote share (E minus N). The vertical axis shows tick labels negative 40, negative 20, 0, 20, 40. Many circular markers are plotted across the full horizontal axis range, with dense vertical stacks of points at several cycle values. The fitted curve slopes downward from near 0 at the left side toward a more negative value around the middle of the axis, then slopes upward slightly toward the right side. The curve stays below 0 for most of the horizontal axis range. The shaded band surrounds the curve across the full horizontal axis range. Points appear most concentrated around marginal effect values near 0 and negative 10, with additional points extending to positive values above 0 and negative values below negative 20. A small number of points extend to around negative 30 and to around positive 20.
The Effects of Election Timing on the Government Vote in EPEs

Table 3 Long description
The table links a government’s vote performance in EPE to where the election falls within the national electoral cycle and suggests a mechanism for each phase. In the honeymoon period, the government is expected to gain votes compared with the previous FOE, attributed to over-confirmation and post-electoral euphoria. At midterm, the government is expected to lose votes relative to the previous FOE, associated with disillusion. In the late-term phase, the government is expected to regain votes compared with the previous FOE, tied to clearer electoral prospects and the role of EPE as test elections. Overall, the pattern is a rise, then a dip, then a recovery across the cycle. The entries describe directional changes and proposed explanations rather than giving numeric vote amounts or statistical uncertainty.
Mainly, there is little evidence of over-confirmation in the honeymoon period. Although the estimated marginal effect is slightly above zero at the very beginning of the cycle, this estimate is based on extremely few observations and is therefore not substantively meaningful. More importantly, already around 0.1 of the NEC, still plausibly within the honeymoon, the marginal effect is essentially null, indicating that early-cycle elections do not systematically benefit governing parties. As EPEs occur later in the cycle, the incumbency effect becomes gradually more negative, reaching its most negative values between 0.6 and 0.7 of the NEC. The effect does not display a pronounced mid-term spike; instead, the curve levels off around 0.9 of the NEC and shows a slight recovery towards the end of it. However, this recovery should not be over-interpreted, as the number of observations at the very end of the NEC is again limited, preventing robust conclusions. Consequently, these findings, above all, suggest a relatively modest and gradual timing effect, with limited evidence for either strong honeymoon over-confirmation or a sharply defined mid-term peak.
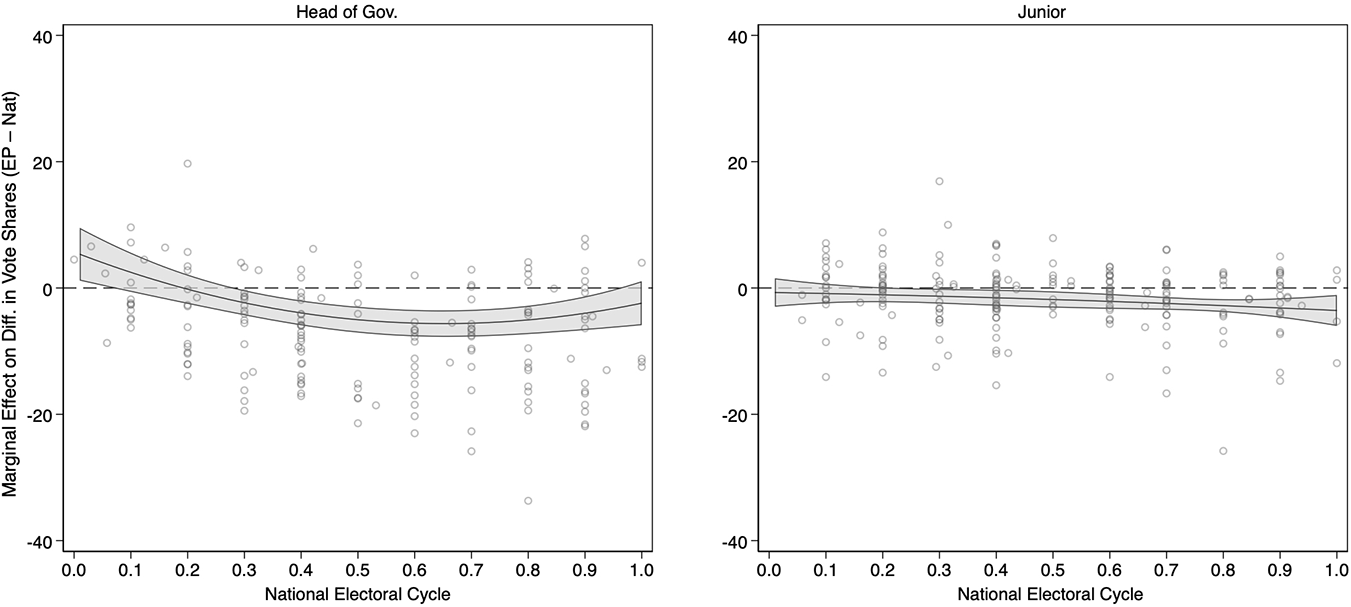
To examine whether (and how) election timing conditions the impact of clarity of responsibility, I then estimate an additional FE model that interacts the Clarity variable with Cycle and its squared term. The results indicate that timing effects are highly asymmetric across government parties. While the interaction terms for junior coalition members are not statistically significant, the corresponding interactions for HoG parties are significant and larger than in the case of interactions between simple government status and election timing. Importantly, the positive coefficient of Clarity = Senior × Cycle2 (b = 29.43; p < 0.01) implies a pronounced curvilinear pattern for senior incumbents.Footnote 16
Figure 7 illustrates these estimates. For HoG parties, the marginal effect of incumbency becomes progressively more negative as EPEs move into the middle of the NEC, reaching its lowest point slightly after the mid-term, before recovering towards the end of the cycle. Importantly, this recovery is already somewhat visible around 0.8 and 0.9 of the NEC, where there remains a meaningful number of observations, suggesting that it is not solely driven by the sparse data at the extreme endpoint. By contrast, for junior coalition partners, the marginal effect remains close to zero in the early part of the cycle, suggesting little evidence of systematic punishment during the honeymoon phase. Only after roughly 0.2 of the NEC does the effect become gradually more negative, indicating that junior partners begin to experience modest losses as EPEs are held later in the cycle. However, compared to HoG parties, this pattern is substantially weaker and does not display a pronounced mid-term trough or clear late-cycle recovery. Overall, these results suggest that the cyclical timing logic of SOEs applies most strongly to the dominant party of government, while responsibility diffusion dampens, but does not eliminate, timing-based punishment among junior partners.
Marginal Effect (95% CI) of Being Head of Government vs Junior Coalition Member on ΔVote Share across the National Electoral Cycle

Figure 7 Long description
The image contains two line graphs. The first graph, titled 'Head of Gov.', shows the marginal effect on vote share across the National Elections Cycle. The horizontal axis is labeled 'National Elections Cycle' and ranges from 0 to 1. The vertical axis is labeled 'Marginal Effect on Vote Share (95 percent CI)' and ranges from negative 40 to positive 40. The graph displays a downward trend, reaching its lowest point slightly after the midterm, before recovering toward the end of the cycle. The second graph, titled 'Junior', also shows the marginal effect on vote share across the National Elections Cycle. The axes are similarly labeled and scaled. This graph shows a relatively stable trend with minor fluctuations, indicating little evidence of systematic punishment during the early part of the cycle. Both graphs include shaded confidence intervals and scattered data points, illustrating variability and trends over the cycle. The graphs highlight the differences in vote share effects between the Head of Government and Junior Coalition Member roles.
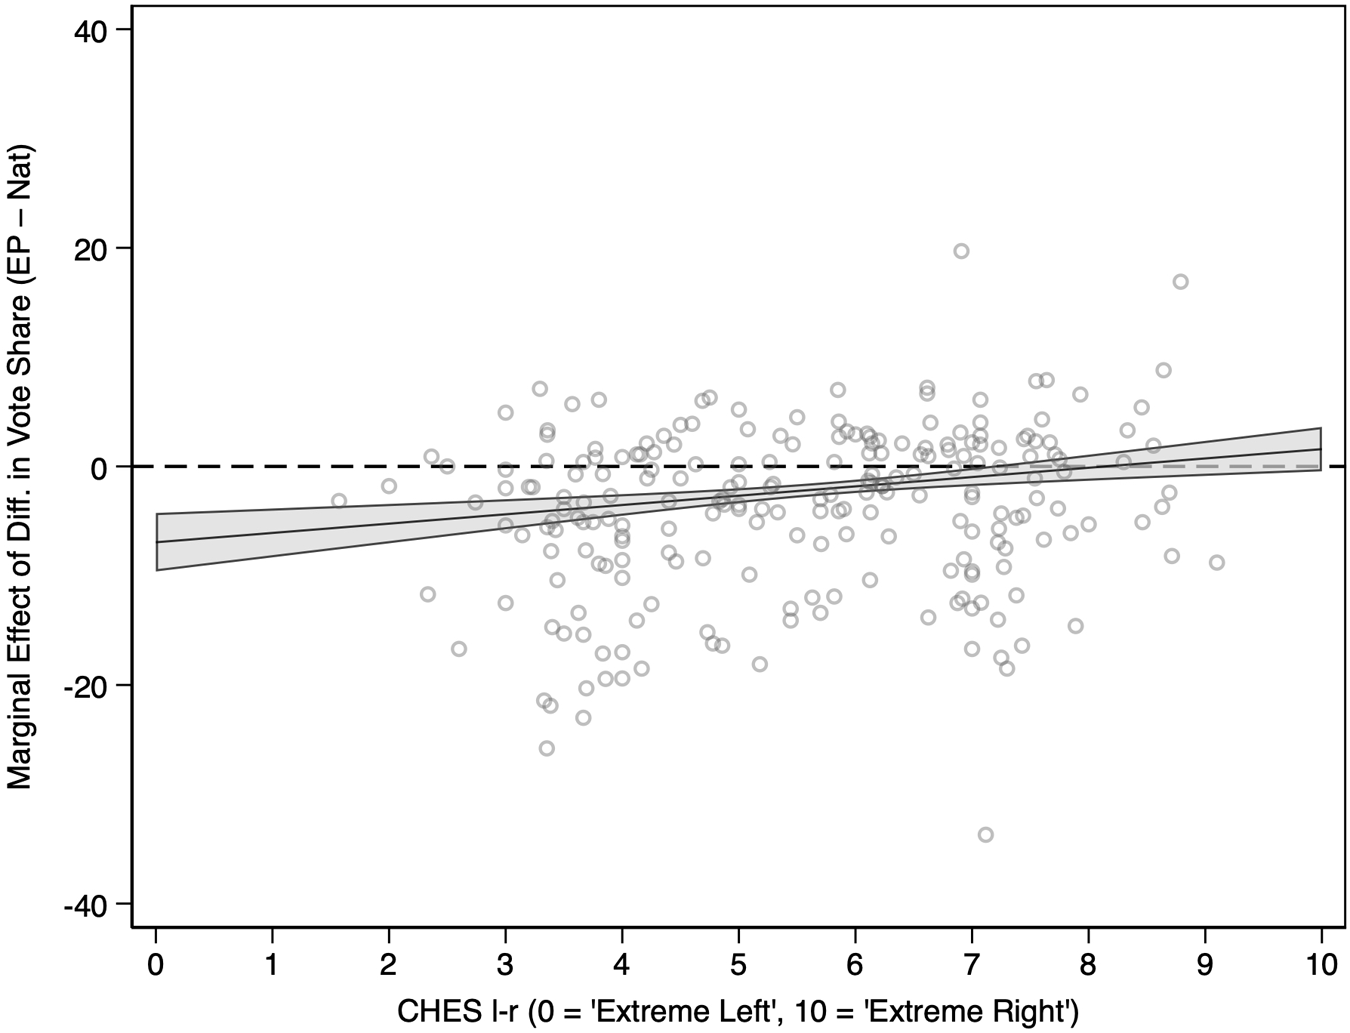
Finally, to further assess whether transformations in European politics condition the second-order punishment of governing parties, I conducted additional regression analyses that account for party ideology and EU attitudes (cf. Hix and Marsh Reference Hix and Marsh2011; Hobolt and Spoon Reference Hobolt and Spoon2012; Hobolt et al. Reference Hobolt, Spoon and Tilley2009; Inglehart and Rabier Reference Inglehart and Rabier1979).Footnote 17 Drawing on Wondreys’ data, I first employed a continuous measure of parties’ left–right ideological position based on the CHES left–right scale (Jolly et al. Reference Jolly, Bakker, Hooghe, Marks, Polk, Rovny, Steenbergen and Vachudova2022), ranging from 0 (‘extreme left’) to 10 (‘extreme right’). The results suggest that ideological position significantly conditions government-party performance in EPEs. The interaction between government status and CHES left–right scale is positive and significant (b = 0.68; p < 0.01),Footnote 18 indicating that as governing parties become more right-wing, their relative losses in EPEs become smaller and may even approach zero. Figure 8 illustrates this upward trend but also highlights an important caveat. Observations are highly concentrated in the middle of the ideological spectrum, with very few parties at the extreme left and right ends. Accordingly, while the evidence clearly suggests that right-leaning governing parties fare better than left-leaning ones, inferences about the magnitude of the effect at the ideological extremes should be drawn cautiously.
Marginal Effect (95% CI) of Government Status on ΔVote Share across the CHES Left–Right Spectrum

Figure 8 Long description
The horizontal axis label is CHES l-r 0 equals Extreme Left, 10 equals Extreme Right. The horizontal axis shows tick labels 0, 1, 2, 3, 4, 5, 6, 7, 8, 9, 10. The vertical axis label is Marginal Effect (dot) on Vote Share (per cent). The vertical axis shows tick labels negative 40, negative 20, 0, 20, 40. A scatter of open-circle points is plotted across the full horizontal axis range, with many points concentrated around horizontal axis values near 4 to 7 and vertical axis values near negative 10 to positive 10. A solid fitted line runs upward from left to right. A shaded band surrounds the fitted line. A dashed horizontal reference line is drawn at 0 on the vertical axis. Several points extend farther from the main concentration, including points above 20 and points below negative 20 on the vertical axis.
In a separate analysis, I then included a Euroscepticism dummy (1 = Eurosceptic; 0 = non-Eurosceptic), based on the data of Matthijs Rooduijn et al. (Reference Rooduijn, Pirro, Halikiopoulou, Froio, van Kessel, de Lange, Mudde and Taggart2023), and an Extreme dummy (1 = Extreme; 0 = Mainstream), already included in Wondreys’ (Reference Wondreys2023) data. Table 4 reports the average marginal effects based on regression analyses including interactions between government status and these two added variables. The results of these analyses show that so-called ‘mainstream’ governing parties lose on average 2.92 p.p. in EPEs (p < 0.001), while non-Eurosceptic governing parties experience an almost identical loss (−2.95 p.p., p < 0.001). Conversely, the corresponding estimates for ‘extreme’ and Eurosceptic governing parties (−1.7 and −1.1 p.p.) are smaller and statistically insignificant, implying that these groups appear less systematically penalised. However, it needs to be strongly emphasised that here uncertainty remains high due to the limited number of cases. From 1979 to 2024, only 56 ‘extreme’ parties and 38 Eurosceptic parties, respectively, contested EPEs as government parties.
Average Marginal Effect of Government Status on ΔVote Share by Party Extremity and Euroscepticism

Table 4 Long description
The table reports the average marginal effect of being in government on change in vote share, shown separately for party extremity and for Euroscepticism, along with uncertainty and sample sizes. Mainstream parties show an average decrease of 2.92 points with a small standard error and a very small p-value, based on 307 government and 536 opposition observations. Extreme parties show a smaller decrease of 1.72 points with a larger standard error and a p-value that does not indicate a clear effect, based on 56 government and 509 opposition observations. Non-Eurosceptic parties show a decrease of 2.95 points with a very small p-value, based on 325 government and 543 opposition observations. Eurosceptic parties show a decrease of 1.10 points with a large standard error and a p-value that does not indicate a clear effect, based on 38 government and 502 opposition observations. Overall, the government penalty appears strongest and most precise for mainstream and non-Eurosceptic parties, while estimates for extreme and Eurosceptic parties are less precise, likely reflecting smaller government samples in those groups.
Source: Calculation from country-level-fixed-effects regression (robust standard errors, N = 1,408).
To assess whether these dynamics have changed over time, particularly considering the rise of Eurosceptic and ‘extreme’ parties over the past two decades and the 2004 key EU enlargement, I also conducted a descriptive analysis for each set of elections from 2004 to 2024.Footnote 19 The results show that mainstream and non-Eurosceptic governing parties exhibit consistent and statistically significant losses across all elections, typically ranging from −4 to −6 p.p. Conversely, ‘extreme’ and Eurosceptic governing parties display more volatile patterns. Their average losses are smaller and seldom statistically significant, and in some elections (e.g. 2014) virtually disappear. However, these findings should again not be overinterpreted. These groups are represented by very few observations (often fewer than 10 per election year), making precise inferences difficult. Moreover, when comparing average losses across the 2004–2024 period, the difference, especially between ‘extreme’ and ‘mainstream’ government parties, is minimal (0.4 p.p.) and both exhibit statistically significant losses overall (two-tailed p = 0.002 and p < 0.001, respectively).
Consequently, there is no clear trend indicating that the magnitude of the government losses has systematically increased or diminished since 2004. Losses among ‘mainstream’ parties remain relatively stable, while the limited evidence for ‘extreme’ and Eurosceptic parties suggests sporadic rather than structural deviations. For instance, while around 2019 there was clearly a sort of a boom of ‘extreme’ parties in government, this trend was not confirmed in 2024, suggesting that the 2019 outcome reflected a temporary conjuncture rather than a lasting structural transformation of European party politics.
Discussion
The findings reaffirm that government parties, on average, lose votes in EPEs relative to the preceding national FOE, and this pattern holds across the full time span of EPEs from 1979 to 2024. The study does not reveal much about cross-temporal changes. The most evident deviations from this ‘norm’ occurred in the 2004 EPE, marked by the EU enlargement to (mostly) ‘young’ democracies from the former communist bloc, whose party systems and patterns of electoral behaviour were arguably still (more) distinctive at the time (see also Koepke and Ringe Reference Koepke and Ringe2006). However, this ‘shock’ proved short-lived, and by the 2009 EPE, the familiar pattern of relatively stable average losses among government parties largely reappeared. This suggests that, if voters in new member states require time to adapt to these new electoral contests, they do so relatively quickly.
Central to the article’s key theoretical contribution, the results also demonstrate that clarity of responsibility strongly conditions losses by government parties in EPEs. In short, across multiple operationalisations, punishment is concentrated on governing actors whose responsibility is most visible. Dominant parties, whether measured by vote share (i.e. size), ministerial control or holding senior position in the government, systematically suffer the greatest losses in EPEs relative to the preceding FOE. In contrast, small governing parties, parties holding small shares of ministries and occupying junior partner positions, are frequently spared from punishment, with effects that are often statistically indistinguishable from zero. These patterns strongly suggest that EPE losses are not simply a blanket penalty for government participation but depend on voters’ ability to identify responsible targets in fragmented coalition governments. In that sense, the findings extend SOE theory by showing that second-order punishment is structured by accountability heuristics, rather than being purely a function of election importance, and provide further support for the previous findings of more generalist literature on clarity of responsibility. Finally, they are also potentially consistent with supply-side accounts suggesting that party campaign intensity in EPEs varies with party size and that EPEs may not be treated as SOEs by all parties (Bartels Reference Bartels2023).
These conclusions should nevertheless be interpreted with caution. Several clarity-of-responsibility indicators are unevenly distributed across the sample, which is a recurring limitation of aggregate-level comparative research on electoral behaviour in EPEs and constrains precision in some specifications. This strengthens the case for future individual-level analyses, which would be better suited to directly testing the micro-level assumptions outlined at the beginning of the article regarding sincere and protest voting. In particular, survey-based evidence could directly assess whether small government parties (whether measured by vote shares or shares of ministerial portfolios) and junior coalition members are indeed relatively insulated from protest voting (see also Klüver and Spoon Reference Klüver and Spoon2020) and may still benefit from sincere voting, while larger coalition partners are more consistently penalised through accountability-driven protest dynamics (Anderson Reference Anderson2000). At the same time, alternative logics, such as the ‘wasted vote’ hypothesis (Anckar Reference Anckar1997; Duverger Reference Duverger1964), also remain to be explored.
As regards additional variables related to clarity of responsibility, prior governing experience does not appear to meaningfully shape voters’ ability to attribute responsibility to government parties in EPEs. Perhaps the most interesting result in this regard is that former government parties that are in opposition at the time of the EPE tend to perform comparatively better, suggesting that previous time in office may leave parties with reputational and/or organisational advantages that enhance their electoral competitiveness once they are no longer held accountable for government performance. The results on external support parties (confidence-and-supply) are therefore suggestive but limited by low statistical power. Descriptive patterns show no significant punishment of support parties, while regression models indicate that they perform worse than opposition parties but less poorly than cabinet parties. This mixed evidence supports the possibility that formal support relationships generate partial accountability effects, but more cases and refined measures of support visibility are needed.
The analysis also provided a reassessment of the key SOE model mechanism concerning election timing. Largely in line with work re-examining the model, especially Hix and Marsh (Reference Hix and Marsh2011), the results show no systematic honeymoon advantage for government parties (reconfirmation rather than over-confirmation), weak mid-term effects, and no sign of late-cycle recovery. This suggests that, in aggregate, the timing mechanism may operate less through cyclical optimism and disillusionment and more through a relatively simple accumulation of discontent and protest opportunities across the NEC. As with clarity of responsibility, individual-level research is warranted to assess whether this corresponds to shifting motivations (e.g. sincere voting early in the cycle and protest voting later), as suggested in earlier work (Oppenhuis et al. Reference Oppenhuis, van der Eijk, Franklin, van der Eijk and Franklin1996; cf. Weber Reference Weber2011). Such research is especially needed given the lack of meaningful numbers of observations at the tipping points of the NEC, which constrains robust aggregate-level statistical analysis.
With regard to election timing, it should also be noted that a responsibility-structured view of SOE voting might help explain why timing effects appear uneven. This aligns with the initially made point that clarity of responsibility and election timing are likely interconnected, as they logically mutually condition their impact on voter motivations in EPEs, especially with respect to protest voting dynamics. Once government parties are disaggregated by cabinet role, timing effects become most visible for senior parties, whereas junior partners display weaker and less cyclical patterns. This implies that the classic SOE timing logic is also largely a story about the dominant actor of government: mid-term punishment and late-cycle recovery emerge primarily where responsibility is concentrated, while responsibility diffusion dampens cyclical dynamics. At the same time, junior partners, often smaller parties, may benefit from relatively more sincere voting early in the cycle (similar to small opposition parties), but become increasingly exposed to protest voting as the length of time since the previous FOE grows (Oppenhuis et al. Reference Oppenhuis, van der Eijk, Franklin, van der Eijk and Franklin1996) and their insulation from punishment weakens as voters more readily identify them as part of the governing coalition. Put simply, the SOE model’s timing mechanism is not universal and appears conditional on responsibility attribution.
The analysis also offers an updated assessment of whether recent transformations in European politics have altered SOE dynamics. As already noted, despite EU reforms and enlargements, the increased salience of European integration, and the growing inclusion of ‘challenger’/‘extreme’ and Eurosceptic parties in government coalitions (de Vries and Hobolt Reference de Vries and Hobolt2020; Wondreys Reference Wondreys2023), the core pattern of a government status disadvantage in EPEs appears to have remained largely intact on average, apart from short-lived shocks. This may also indicate that ‘challenger’, ‘extreme’ and Eurosceptic parties have become normalised (Akkerman et al. Reference Akkerman, Rooduijn and de Lange2016; Mudde Reference Mudde2019; Wondreys Reference Wondreys2023) to an extent that voters no longer treat them as categorically different from mainstream actors, and they are thus equally subject to electoral punishment in EPEs once they enter national governments.
At first glance, this finding may appear to reinforce the SOE model assumption that government parties are punished regardless of ideology or EU stance (cf. Carrubba and Timpone Reference Carrubba and Timpone2005; Clark and Rohrschneider Reference Clark and Rohrschneider2009; Hobolt and Spoon Reference Hobolt and Spoon2012; Hobolt et al. Reference Hobolt, Spoon and Tilley2009). However, this interpretation must be treated with caution. In my data, Eurosceptic and ‘extreme’ government parties appear to be systematically less punished than mainstream and pro-European ones (cf. Wondreys Reference Wondreys2023). The key limitation is statistical. These parties constitute a relatively small and uneven subset of governing actors across time, making their estimates more volatile and less precise. While this prevents strong conclusions about systematic ideological exceptions, it nevertheless points to an important avenue for future research, especially as the number of such cases continues to grow. In particular, future work should examine whether greater EU issue salience (measured comprehensively and across a wider range of cases) strengthens responsibility attribution and thus amplifies incumbent punishment in EPEs. Moreover, in a similar vein, my secondary analysis, although based on a more limited set of observations due to missing data, suggests that moving rightwards on the ideological spectrum may be associated with weaker government losses in EPEs relative to FOEs. Further testing with expanded and more varied data and, if the pattern is confirmed, closer attention to the mechanisms that could plausibly explain this is, therefore, also warranted.
Conclusions
Drawing on all election pairs between EPEs and the preceding national FOE from 1979 to 2024, this study reassessed the seminal SOE model. The emphasis was placed on its key proposition that government parties lose votes in second-order EPEs relative to national FOEs, while introducing clarity of responsibility as a key but underexplored mechanism shaping which governing parties are punished most. Taken together, the findings suggest that the SOE model remains highly relevant, but that its core mechanisms are best understood as operating in interaction with responsibility structures. In short, government punishment in EPEs persists, but it is unevenly distributed within governing coalitions and often shaped by coalition architecture and visibility, rather than by government status alone.
Across multiple measures, responsibility concentration increases the magnitude of punishment. Large governing parties, senior coalition parties and parties controlling substantial shares of ministerial portfolios are consistently penalised most heavily. By contrast, small coalition parties and junior partners often experience substantially weaker losses, and in some settings appear largely insulated from punishment. These results support the view that voters rely on accountability heuristics in multiparty coalition contexts (Anderson Reference Anderson2000; Fisher and Hobolt Reference Fisher and Hobolt2010; Hobolt et al. Reference Hobolt, Tilley and Banducci2013; Klüver and Spoon Reference Klüver and Spoon2020; cf. Langer and Sagarzazu Reference Langer and Sagarzazu2018), directing second-order punishment disproportionately towards the most visible responsible actors rather than distributing it evenly across governing coalitions.
The article also revisits the classic SOE election timing mechanism. Contrary to expectations of systematic honeymoon gains and strong late-cycle recovery, the results indicate a more modest pattern. Government losses tend to deepen as EPEs occur later in the NEC (see also Hix and Marsh Reference Hix and Marsh2011; Oppenhuis et al. Reference Oppenhuis, van der Eijk, Franklin, van der Eijk and Franklin1996), with limited evidence for cyclical dynamics at the aggregate level. However, disaggregated analyses suggest that timing effects are strongest for senior government parties, implying that the SOE cycle logic may operate primarily where responsibility is concentrated rather than diffused. This presents an important finding regarding overall assumptions about the cyclicity of elections (Stimson Reference Stimson1976; Weber Reference Weber2011).
Overall, the findings underscore both the enduring explanatory power of the SOE model and the need for theoretical refinement. In this sense, they also illustrate the usefulness of broader theories of comparative electoral behaviour. Correspondingly, EPEs prove to be a valuable litmus test of these broader theoretical frameworks beyond their original scope (see also van der Eijk et al. Reference van der Eijk, Franklin and Marsh1996). To conclude, it is important to re-emphasise that while the second-order nature of EPEs appears largely intact despite significant changes to party systems, government composition and EU politicisation, this situation may still change. While stronger aggregate-level conclusions remain constrained by data limitations, the results nevertheless point to potential signs of evolving dynamics that warrant continued attention. Future research should therefore systematically integrate responsibility-based mechanisms more explicitly into SOE theory and test these dynamics using individual-level data capable of distinguishing protest from sincere voting (see also Hobolt and Spoon Reference Hobolt and Spoon2012; Weber Reference Weber2011), thus clarifying responsibility attribution in increasingly complex governing arrangements, and continue to assess whether (and how) the evolving context of European integration reshapes the SOE model over time.
Supplementary material
The supplementary material for this article can be found at https://doi.org/10.1017/gov.2026.10046.
Data availability
Data are available from the author upon request.
Acknowledgements
I would first like to thank the three anonymous reviewers for their extremely valuable comments and suggestions. Second, as this article is broadly based on my doctoral dissertation, I would also like to thank my Doktorvater, Cas Mudde, as well as Shane P. Singh and the remaining members of my committee, Alexa Bankert and Molly Cohen, for all their extraordinary help and support. Finally, I thank Mattia Zulianello for his suggestions regarding the data, as well as all participants at the conferences and workshops where I presented earlier versions of this research.
Disclosure statement
The author reports that there are no competing interests to declare.
AI assistance statement
Generative AI (ChatGPT 5.2; OpenAI) was used solely to improve language, clarity and readability of the manuscript. It was not used to generate original scholarly content, analyses or results. All AI-assisted edits were reviewed and, where necessary, revised by the author, who retains full responsibility for the final content of the manuscript.






 Open access

