

INTRODUCTION
Intraindividual variability (IIV), or inconsistency, refers to fluctuations in performance from trial to trial within a given task. The consensus from the literature is that response time (RT) IIV is greater in healthy older adults compared with younger adults (Dykiert, Der, Starr, & Deary, Reference Dykiert, Der, Starr and Deary2012; Hultsch, MacDonald, & Dixon, Reference Hultsch, MacDonald and Dixon2002; Hultsch, Strauss, Hunter, & MacDonald, Reference Hultsch, Strauss, Hunter and MacDonald2008; Williams, Hultsch, Strauss, Hunter, & Tannock, Reference Williams, Hultsch, Strauss, Hunter and Tannock2005). Furthermore, longitudinal studies provide evidence that RT IIV increases through the aging process (Bielak, Cherbuin, Bunce, & Anstey, Reference Bielak, Cherbuin, Bunce and Anstey2014; Bielak, Hultsch, Strauss, MacDonald, & Hunter, Reference Bielak, Hultsch, Strauss, MacDonald and Hunter2010).
A cross-sectional study by Williams et al. (Reference Williams, Hultsch, Strauss, Hunter and Tannock2005) found a U-shaped RT IIV function from childhood to old age—variability decreases to middle adulthood where it reaches a nadir before increasing once again into old age. This may correspond to the rise and fall of executive control abilities throughout the lifespan. It is known that the frontal lobes, which play a large role in cognitive control processes, deteriorate with age (Kennedy & Raz, Reference Kennedy and Raz2015). This corresponds with elevated RT IIV in neurological populations known to have disrupted cognitive control abilities. For example, heightened variability has been observed in individuals with white matter lesions (Bunce et al., Reference Bunce, Anstey, Christensen, Dear, Wen and Sachdev2007), traumatic brain injury (Stuss, Pogue, Buckle, & Bondar, Reference Stuss, Pogue, Buckle and Bondar1994), and frontal lobe lesions (Stuss, Murphy, & Binns, Reference Stuss, Murphy and Binns1998; Stuss, Murphy, Binns, & Alexander, Reference Stuss, Murphy, Binns and Alexander2003). Lastly, functional neuroimaging has also confirmed a positive association between RT IIV and activation across a distributed neural network known to be involved in sustained attention and inhibitory processing including the inferior parietal, thalamic, and prefrontal regions (Bellgrove, Hester, & Garavan, Reference Bellgrove, Hester and Garavan2004).
One theory of RT IIV proposes that efficient top–down allocation of attention results in a more consistent response pattern, whereas disrupted attentional deployment leads to variable responses (Bunce, Warr, & Cochrane, Reference Bunce, Warr and Cochrane1993; Duchek et al., Reference Duchek, Balota, Tse, Holtzman, Fagan and Goate2009; West, Murphy, Armilio, Craik, & Stuss, Reference West, Murphy, Armilio, Craik and Stuss2002). Impairment in the ability to sustain attention may lead to a greater proportion of longer latency responses, which can inflate conventional measures of RT IIV. Fitting RT data to an ex-Gaussian distribution provides a way to test this hypothesis. An ex-Gaussian distribution is the convolution of a normal (Gaussian) function with an exponential function, and has three parameters: μ (mu) and σ (sigma) representing the mean and standard deviation of the Gaussian component, respectively, and τ (tau) representing the right tail of the distribution. Greater μ values signify general slowing and greater σ describes elevated variability of the Gaussian component of the RT distribution. Larger τ values indicate greater positive skew, and thus a greater proportion of slowed responses. In RT IIV research, τ has been viewed as a measure of attentional inefficiency, indicating brief attention lapses (Vasquez, Binns, & Anderson, Reference Vasquez, Binns and Anderson2016; West et al., Reference West, Murphy, Armilio, Craik and Stuss2002).
The cognitive underpinnings of RT IIV are not fully understood regarding the relative and specific strength of associations. Research has examined RT IIV as a predictive factor for cognitive decline longitudinally. In one study, cognition was assessed at baseline and six year later across the domains of perceptual speed, working memory, fluid reasoning, episodic memory, and crystallized verbal ability (MacDonald, Hultsch, & Dixon, Reference MacDonald, Hultsch and Dixon2003). The authors found a negative relationship between cognition and RT IIV, as well as a concomitant decline of both cognitive abilities and consistent RT performance. Similar results were also shown in a study of older adults that measured RT IIV along with perceptual speed and categorical fluency over a thirteen year span (Lövdén, Li, Shing, & Lindenberger, Reference Lövdén, Li, Shing and Lindenberger2007).
More recently, it has been shown that RT IIV was predictive of declining fluid abilities including memory, speed, reasoning, and fluency, whereas no change was observed in verbal performance (reflecting crystalized ability) (Bielak et al., Reference Bielak, Hultsch, Strauss, MacDonald and Hunter2010). A recent systematic review verified cognitive associations with RT IIV, and that inconsistency precedes cognitive decline in aging (Haynes, Bauermeister, & Bunce, Reference Haynes, Bauermeister and Bunce2017). Of note, previous studies have not consistently included common neuropsychological tests from clinical practice, nor have they examined the RT parameters that contributed to these associations. Moreover, these studies did not place priority on determining any cognitive specificity in the association with RT IIV, and as a result it has often been concluded that elevated RT IIV reflects compromised neurocognitive integrity broadly.
A parallel line of research has specifically targeted the role of executive processes in RT IIV. In one experiment, West et al. (Reference West, Murphy, Armilio, Craik and Stuss2002) manipulated demand for executive control processing by having participants perform a choice RT task with or without a 1-back component. They found that RT IIV and τ were similar across groups in the single-task 0-back condition, but greater in older than younger adults in the 1-back condition. It was reasoned that older adults had decreased efficiency of executive control processing, leading to elevated variability when greater cognitive control was required. Previously, an examination of ex-Gaussian parameters from a Stroop task revealed that higher interference in older adults was due to a greater distributional tail (Spieler, Balota, & Faust, Reference Spieler, Balota and Faust1996).
It has also been shown that quantitatively increasing the attentional demands on a RT task (i.e., simple vs. choice) increases RT IIV (Dykiert et al., Reference Dykiert, Der, Starr and Deary2012). Further research has demonstrated that the ex-Gaussian parameter τ was more strongly related than μ or σ to a latent working memory construct in younger (Schmiedek, Oberauer, Wilhelm, Süß, & Wittmann, Reference Schmiedek, Oberauer, Wilhelm, Süß and Wittmann2007) and older adults (Tse, Balota, Yap, Duchek, & McCabe, Reference Tse, Balota, Yap, Duchek and McCabe2010). Data from our lab showed that the ex-Gaussian parameter τ was most strongly associated with executive functioning, indexed by common neuropsychological tests, compared to μ or σ, or a conventional variability measure (intraindividual standard deviation; ISD) (Vasquez et al., Reference Vasquez, Binns and Anderson2016). These studies indicate a connection between executive functions and RT consistency, perhaps more specifically τ. However, we still do not know, whether executive demand or task difficulty was responsible for observed effects in West et al. (Reference West, Murphy, Armilio, Craik and Stuss2002), and we do not know whether variability-cognition associations are specific to executive functions as suggested by Schmiedek et al. (Reference Schmiedek, Oberauer, Wilhelm, Süß and Wittmann2007), Tse et al. (Reference Tse, Balota, Yap, Duchek and McCabe2010), and Vasquez et al. (Reference Vasquez, Binns and Anderson2016).
Thus, a question that remains from the existing literature is whether RT IIV and τ correspond to executive functioning preferentially, or to cognition more generally. This could not be addressed in our previous study as the neuropsychological tests we included did not cover multiple cognitive domains. In the present study, we tested younger adults (18–30 years old), young-old adults (65–74 years old), and old-old adults (75–85 years old) with a comprehensive battery of neuropsychological tests, as well as a reaction time task from which we derived RT distribution indices.
The primary goal of this study was to investigate how aspects of the RT distribution relate to different cognitive domains. We anticipated higher mean RT (Salthouse, Reference Salthouse1996), as well as higher ISD and τ, with increasing age (Hultsch et al., Reference Hultsch, MacDonald and Dixon2002, Reference Hultsch, Strauss, Hunter and MacDonald2008; Vasquez et al., Reference Vasquez, Binns and Anderson2016). We hypothesized that greater τ, rather than μ or σ, would be related more strongly to poorer performance on executive measures compared to other cognitive domains, reflecting the role of cognitive control in tests of executive functioning. Lastly, we predicted that precision in describing the RT distribution, such as with an ex-Gaussian analysis, would yield data that are sensitive to differences in cognitive ability not fully accounted for simply by age.
METHODS
Participants
We recruited 40 healthy young adults (aged 18–30 years; M=22.78, SD=3.32; 11 males) and 81 healthy older adults (aged 65–85 years; age M=74.42, SD=6.25; 22 males) from the Rotman Research Institute participant database. The older adult group was comprised of two subgroups: young-old (aged 65–74 years; n=40; M=68.88, SD=2.72; 11 males) and old-old (aged 75–85 years; n=41; M=79.83, SD=3.18; 11 males). Participants were excluded based on: history of head injury with loss of consciousness, neurological impairment/major medical illnesses (e.g., stroke, dementia, and heart disease), chemotherapy, radiation to the head, drug abuse, current use of psychiatric medication, English non-fluency, and obtaining a score below 31 on the modified Telephone Inventory of Cognitive Status (Welsh, Breitner, & Magruder-Habib, Reference Welsh, Breitner and Magruder-Habib1993). Written informed consent was obtained from all volunteers, and monetary compensation was provided. This research was approved by Baycrest’s Research Ethics Board.
Procedures
After obtaining informed consent, a neuropsychological battery and computerized feature integration attention task were administered. The entire session lasted approximately three hours.
Feature Integration task
Each trial involved the simultaneous presentation of four playing cards in random non-overlapping locations on a touch screen, with the goal being to tap the Target (8 of spades) as quickly as possible using a stylus. When there was no Target card present, participants were instructed to tap the Next button located at the bottom centre of the screen as quickly as possible (referred to as “Next trials”). The task was self-paced—when the screen was tapped, the display was refreshed with a new array of cards. Before participants began the task, the experimenter demonstrated with two Target and two Next trials (randomly ordered). Participants were then given the opportunity to practice, which ended after tapping 10 Targets.
The feature integration task consisted of 108 trials, with 36 (33%) containing the Target 8 of spades. Cards included numbers 5 through 9 in each of the four suits (spades, hearts, clubs, and diamonds). Selection of non-Target cards was controlled such that cards within a trial shared a certain number of attributes (color, suit, number) in common with the Target. Specifically, the non-Target sets contained two 2-feature, one 1-feature, and one 0-feature overlap non-Target cardsFootnote 1 . Target sets contained one 2-feature overlap non-Target card, one 1-feature overlap non-Target card, and one 0-feature overlap non-Target card. Trials were randomly ordered for each participant with the restriction that no more than three trials containing Targets occurred consecutively. Card images were 180 by 225 pixels in size, subtending visual angles of 5.26 by 6.56 degrees at an approximate viewing distance of 40 cm, and presented on a white background.
Participants missed an average of 0.86% of Targets and pressed incorrect cards (false alarms) on 0.22% of trials. There were no significant effects of age group for Target misses or false alarms. Thus, error trials are not discussed further.
Data Preparation
Error responses and outlying RTs were removed. RTs shorter than 150 ms were removed (Dixon et al., Reference Dixon, Garrett, Lentz, MacDonald, Strauss and Hultsch2007; Garrett, MacDonald, & Craik, Reference Garrett, MacDonald and Craik2012; MacDonald, Hultsch, & Bunce, Reference MacDonald, Hultsch and Bunce2006); these were exceptionally infrequent, representing none of the Target responses and 0.03% of Next responses from all age groups. Outliers representing extremely slow responses were characterized as exceeding the 3rd quartile + (3 × interquartile range). This method removed RTs that were clearly outside the RT distribution for that individual, without removing those that were part of the tail of slow responses; these made up only 0.92%, 0.54%, and 0.75% of Target trials for young, young-old, and old-old groups, respectively. Trimmed upper bound Next responses amounted to 1.61%, 1.16%, and 1.29% of trials for the same groups. Values for removed data points were not imputed.
Estimating IIV and Ex-Gaussian Distribution Parameters
We used ISD as a measure of IIV (Hultsch et al., Reference Hultsch, Strauss, Hunter and MacDonald2008), which controls for mean RT differences and systematic trends in performance (practice effects, fatigue, etc.). First, the raw RT data were checked for linear, quadratic, and cubic trends across trials, revealing a small but significant negative linear slope. Next, individual trial RTs were regressed on trial number for each participant, and ISDs were calculated from the unstandardized residuals. Ex-Gaussian parameters (μ, σ, and τ) were computed within each individual from the feature integration task using the MATLAB toolkit distrib v2.3 (Lacouture & Cousineau, Reference Lacouture and Cousineau2008). All calculations (ISD and ex-Gaussian) were conducted separately for correct Target and Next responses.
Neuropsychological Battery
Verbal intellectual functioning was estimated using Shipley’s Institute of Living Scale (Zachary, Reference Zachary1986) Vocabulary subtest. The Boston Naming Test (Kaplan, Goodglass, & Weintraub, Reference Kaplan, Goodglass and Weintraub1983) (30-item form) was used as a language measure. For later structural equation modeling analyses, the following tests were grouped into three cognitive domains (memory, speed of processing, executive functioning). Memory: the California Verbal Learning Test – II (CVLT-II) (Delis, Kramer, Kaplan, & Ober, Reference Delis, Kramer, Kaplan and Ober2000) delayed free recall, Wechsler Memory Scale III (WMS-III) (Wechsler, Reference Wechsler1997b) Logical Memory II, and Rey-Osterrieth Complex Figure (Meyers & Meyers, Reference Meyers and Meyers1995) immediate recall. Processing speed: Wechsler Adult Intelligence Scale III (WAIS-III) (Wechsler, Reference Wechsler1997a) Digits Symbol Coding, DKEFS (Delis, Kaplan, & Kramer, Reference Delis, Kaplan and Kramer2001) Trail Making Number Sequencing (completion time), and the DKEFS Colour-Word Interference Word Reading (completion time).
Executive functioning: Wisconsin Card Sorting Test (WCST) (Heaton, Chelune, Talley, Kay, & Curtis, Reference Heaton, Chelune, Talley, Kay and Curtis1993) percent perseverative errors, DKEFS Trail Making Number-Letter switching (completion time), and DKEFS Color-Word Interference Inhibition (completion time).
Statistical Analysis
To confirm age differences in RT performance, mean, ISD, μ, σ, and τ for Target and Next responses were separately analyzed in multivariate analyses of variance (ANOVAs) with age group (young, young-old, old-old) as a between-subjects factor. Where there were significant multivariate effects, follow-up univariate analyses were performed. Before analysis, estimates of ISD and τ for one participant with extreme values were winsorized.
As a first step in examining how different cognitive domains are associated with RT distribution indices, we used structural equation modeling (SEM) to establish age-independent relations between variables. We regressed age from all measures of interest—mean, ISD, and ex-Gaussian parameters (μ, σ, τ) for Target responses, in addition to the memory, processing speed, and executive function tests (see Vasquez et al., Reference Vasquez, Binns and Anderson2016)Footnote 2 . The standardized residuals from the regression were saved and used to build two SEMs of three cognitive latent variables and the RT distribution indices—one with the mean/ISD, and the other with the ex-Gaussian parameters. The construction of each model was guided by covariance and regression weight recommendations, and modified to achieve the best possible model fit (as in Vasquez et al., Reference Vasquez, Binns and Anderson2016). IBM SPSS Amos 20.0 was used for the SEM analysis, and good model fit was judged by the following: comparative fit index (CFI)>.95, Tucker Lewis Index (TLI)>.90, root mean square error of approximation RMSEA<.08, and the chi-square p>.05.
In a second step, we used regression to investigate how the ex-Gaussian parameters and age group predicted performance in the three cognitive domains (memory, processing speed, executive functioning). This allowed us to examine whether additional variance in cognitive performance was explained by age, over and above the ex-Gaussian parameters. Note that we only pursued the second step with ex-Gaussian parameters, not mean/ISD, in accordance with the ex-Gaussian model demonstrating better fit. We used raw data from the tests contributing to each cognitive domain in the SEM, rather than age-regressed residuals, then multiplied by SEM standardized regression weights and summed the resultant values to create cognitive domain factor scores (for a similar procedure, see Vasquez et al., Reference Vasquez, Binns and Anderson2016; Souchay, Isingrini, & Espagnet, Reference Souchay, Isingrini and Espagnet2000; Taconnat et al., Reference Taconnat, Baudouin, Fay, Clarys, Vanneste, Tournelle and Isingrini2006). Note that standardized regression coefficients for timed tasks were multiplied by -1 so that higher composite scores represented better processing speed and executive functioning. Linear regression was performed separately for each of the three cognitive composites. Predictors were entered in two steps: first the ex-Gaussian parameters (i.e., μ, σ, and τ) and second, age group.
RESULTS
Demographics and Neuropsychological Functioning
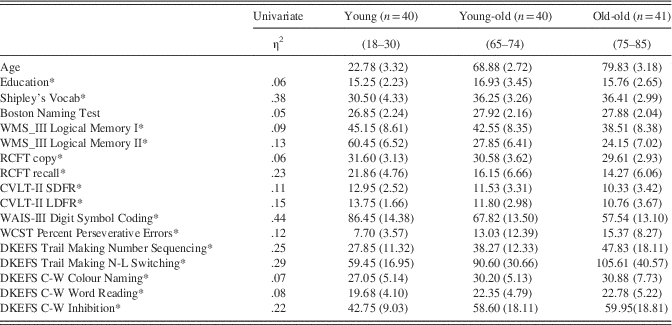
Demographic information and neuropsychological test scores are summarized in Table 1. Note that we obtained only partial data for one young-old participant (missing the Boston Naming test, the WMS-III Logical Memory II, and WAIS Digit Symbol Coding). Differences between age groups were identified using multivariate ANOVA, which yielded a significant model using Pillai’s trace, V=1.03, F(48,188)=4.15, p<.001, η2=.51. Main effects were examined with univariate ANOVA, revealing significant age group differences for all variables except the Boston Naming test (see Table 1). The older adult groups had acquired more years of formal education than the young group. Consistent with prior research, younger adults performed slightly worse on the vocabulary subtest of Shipley’s Institute of Living Scale, compared to older adults. Although not present for every test, there was a tendency for younger adults to outperform young-old, who in turn outperformed old-old on cognitive measures
Group Means (standard deviations) of Demographic and Neuropsychological Measures

*p<.05.
Effect of Age on RT Parameters
Target responses
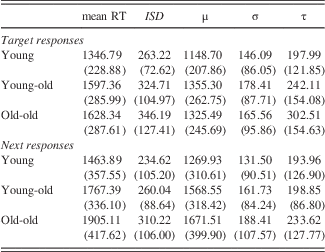
A significant multivariate effect was found for age group using Pillai’s trace (V=.27; F(10,230)=3.52; p<.001; ηp 2=.13). There was a significant univariate effect of age group on all Target response measures except σ, F(2,118)=1.36, p=.262, η2=.02. Target mean, F(2,118)=13.25, p<.001, η2=.18, Target ISD, F(2,118)=7.00, p=.001, η2=.11, and Target τ, F(2,118)=5.28, p=.006, η2=.08 all showed the pattern of worse performance (slower, more variable, more frequent slowed responses) with increasing age. A significant linear contrast revealed higher values in the RT indices escalating with each age group from the young to the young-old group, and from the young-old to the old-old group (Table 2). Target μ, F(2,118)=8.69, p<.001, η2=.13, was lower in the young compared to the young-old and old-old groups. A significant quadratic contrast was found for Target mean and Target μ, suggesting an attenuated aging effect within older adults.
Mean (ISD) of RT distribution indices by age group

Next responses
A significant multivariate effect was also found for age group using Pillai’s trace (V=.26; F(10,230)=3.39; p<.001; ηp 2=.13). There was a significant univariate effect of age group on all Next response measures except τ, F(1,118)=1.43, p=.245, η2=.02. Linear contrasts revealed that Next mean, F(1,118)=14.83, p<.001, η2=.20, Next μ, F(1,118)=14.67, p<.001, η2=.20, Next ISD, F(1,118)=5.97, p=.003, η2=.09, and Next σ, F(1,118)=3.66, p=.029, η2=.06, all declined (slower, more variable) moving from the young group, to the young-old group, to the old-old group (Table 2). No quadratic contrasts were significant.
Relationship between RT parameters and cognition
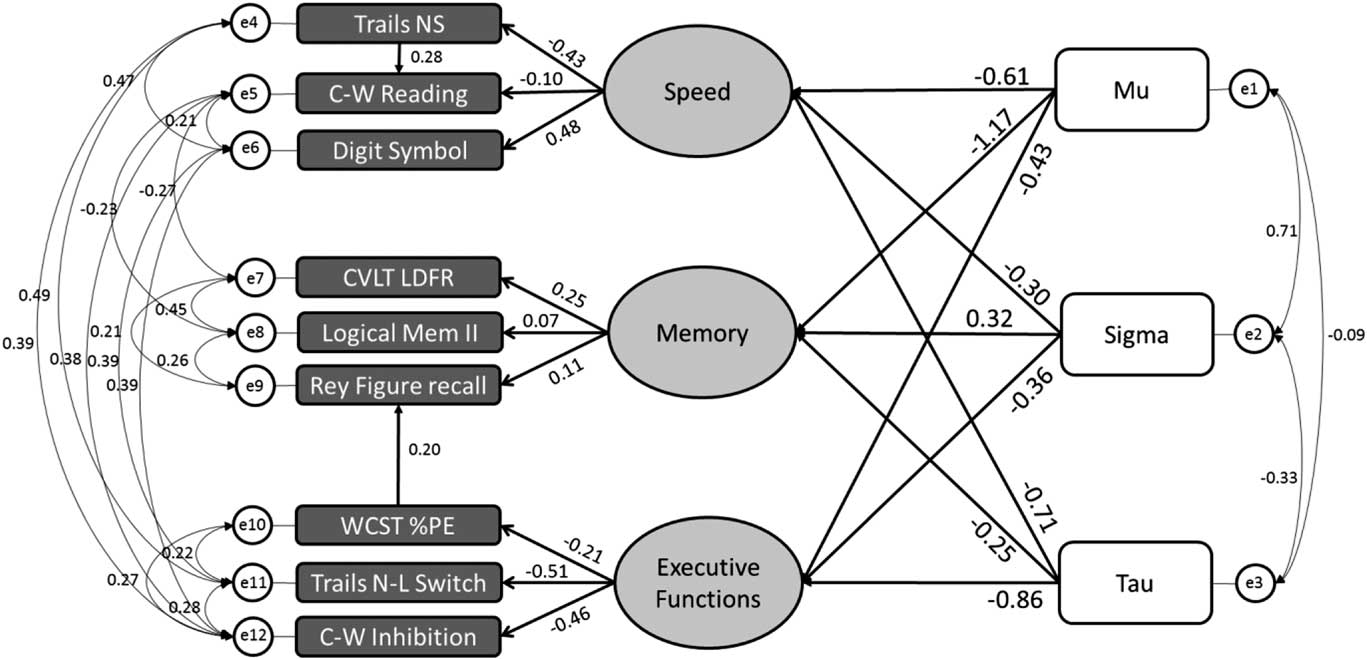
Two structural equation models were created to examine the relationship between RT indices and neuropsychological measures of cognition covering the domains of memory, processing speed, and executive functioning. The first model used mean and ISD to describe RT performance whereas the second model included the ex-Gaussian parameters. The resulting model for mean and ISD demonstrated a poor fit to the data, CFI=.93, TLI =.87, RMSEA=.01, χ2=60.22, p=.001. Conversely, the ex-Gaussian SEM exhibited good model fit, CFI=.97, TLI =.94, RMSEA=.06, χ2=72.68, p=.083 (Figure 1). Inspection of the model indicates that the episodic memory latent variable was most strongly related to the parameter μ, whereas the processing speed and executive functioning latent variables were most strongly associated with the parameter τ. Note that in a separate analysis, education and vocabulary were not found to contribute to age-independent variables included in the model.
Structural equation model relating reaction time distribution parameters and cognition. Good model fit - CFI=.97, TLI =.94, RMSEA=.06, chi-square=72.68, p=.083, based on the following fit statistic criteria; CFI>.95, TLI >.90, RMSEA<.08, and the chi-square p>.05. Regression weights are standardized. Trails NS=DKEFS Trail Making Test - Number Sequencing (time to complete); C-W Reading=DKEFS Colour-Word Interference Word Reading (time to complete); Digit Symbol=Wechsler Adult Intelligence Scale III (WAIS-III) Digits Symbol Coding; CVLT LDFR=California Verbal Learning Test – II (CVLT-II) Long Delay Free Recall; Logical Mem II=Wechsler Memory Scale III (WMS-III) Logical Memory II; Rey Figure recall=Rey-Osterrieth Complex Figure immediate recall; WCST PE=Wisconsin Card Sorting Test (WCST) percent perseverative errors; Trails N-L Switch=DKEFS Trail Making Number-Letter switching (time to complete); C-W Inhibition=DKEFS Color-Word Interference Inhibition (time to complete).
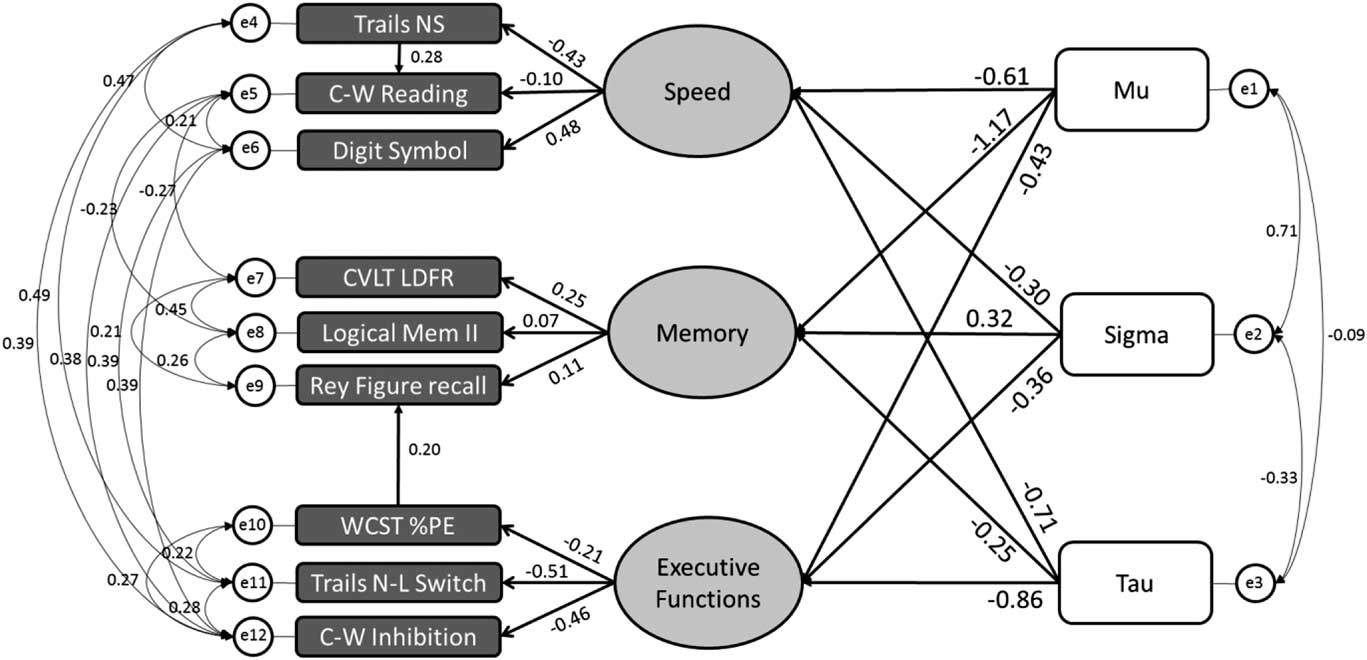
Given our interest in determining the specificity of the tau-executive relationship, nested comparison models were tested against the “default” model described above. The technique involves constraining regression coefficients to be equal in a nested model, and then comparing model fit with the original default model using a likelihood ratio test (Chi-square difference test). In nested models when regression coefficients between the ex-Gaussian parameters and the processing speed latent variable were constrained to equality, there was no significant change in model fit. The same was found for a nested model constraining ex-Gaussian parameters and the memory latent variable. In contrast, constraining equality of regression coefficients between ex-Gaussian parameters and the executive functioning latent variable resulted in a significant reduction in model fit (p=.005). These likelihood ratio comparisons indicate that the relative weightings between ex-Gaussian parameters and the executive latent variable are necessary to achieve good model fit.
Furthermore, when regression coefficients between τ and the three cognitive latent variables were constrained to equality (including a speed-executive contrast), model fit was significantly weakened (p<.001). Similarly, we tested constrained models between μ and the three cognitive latent variables, which revealed that model fit was not significantly affected; thus, we could not conclude that the μ-memory association was stronger than with the other cognitive domains. Together, likelihood ratio tests between nested models indicate that model fit is highly dependent on the relative and specific strength of association between τ and the executive functioning latent variable, over processing speed and memory.
Contributions of RT parameters and age to cognition
Linear regression was applied to examine the influence of age on the relationship between RT indices and each cognitive domain separately. The ex-Gaussian parameters (i.e., μ, σ, and τ) were entered in a first step, followed by age group in a second step. The resulting regression model for memory was significant [F(4,115)=12.95; p<.001], indicating that age group was a significant predictor. However, the coefficients for the ex-Gaussian parameters were not significant (see Table 3); the R2 change for the addition of ex-Gaussian parameters was .16. A significant regression model was generated in the prediction of processing speed [F(4,115)=39.68; p<.001]. For this processing speed model, age group was the strongest predictor; μ and τ also had significant coefficients, but σ did not (Table 3). The R2 change for age group in the processing speed model was .18, indicating that age explained a significant amount of variance, over and above the RT parameters (ΔF p<.001). Lastly, the regression model predicting executive functioning was significant [F(4,116)=32.22; p<.001]. Coefficients for both μ and τ, but not σ, were again significant in the prediction of executive functions (Table 3). The R2 change for the inclusion of age group into the executive functioning model was .10, also demonstrating significant variance explained, over and above the ex-Gaussian parameters (Δ F p<.001).
Hierarchical regression of age group and ex-Gaussian parameters predicting cognitive composites

*p<.05, **p<.01, ***p<.001
DISCUSSION
Variability in Aging
The present study supports prior literature indicating age-related slowing (Giambra, Reference Giambra1993; Parasuraman & Davies, Reference Parasuraman and Davies1977; West et al., Reference West, Murphy, Armilio, Craik and Stuss2002) and elevated variability (Bielak et al., Reference Bielak, Hultsch, Strauss, MacDonald and Hunter2010; Bunce, Reference Bunce2001; Hultsch et al., Reference Hultsch, MacDonald and Dixon2002; MacDonald et al., Reference MacDonald, Hultsch and Bunce2006; O’Halloran, Finucane, Savva, Robertson, & Kenny, Reference O’Halloran, Finucane, Savva, Robertson and Kenny2014; Williams et al., Reference Williams, Hultsch, Strauss, Hunter and Tannock2005); Mean RT and ISD were lowest in young adults and higher in each successive age group (young-old through to old-old). The data also support studies specifically examining age-related RT IIV differences within an older adult group (i.e., old-old more variable than young-old) (Hultsch et al., Reference Hultsch, MacDonald and Dixon2002, Reference Hultsch, Strauss, Hunter and MacDonald2008; Vasquez et al., Reference Vasquez, Binns and Anderson2016). Lastly, an aging effect was also found for ex-Gaussian parameters, Target response μ and τ, but not σ, increased linearly with age, whereas the same linear age effect for Next responses was only observed for μ and σ. The discrepancy between these response types could be due to Target responses requiring greater attentional control, reflected in age differences in Target, but not Next τ. The present findings are congruent with prior research showing elevation of τ in older compared to younger adults, suggesting an age-related decrease in cognitive control (Vasquez et al., Reference Vasquez, Binns and Anderson2016; West et al., Reference West, Murphy, Armilio, Craik and Stuss2002).
Cognition, Aging, and the RT Distribution
We fit an SEM that incorporated episodic memory, processing speed, and executive functioning, to capture more fully the spectrum of cognitive domains, and contrast the strength of relations of these domains with RT distribution indices. We then ran a linear regression to examine the predictive ability afforded by age over the RT indices. The current study demonstrates for the first time that various components of the RT distribution correspond, with differential priority, to distinct cognitive domains. This finding suggests that elevations in RT IIV, and in particular ex-Gaussian τ, reflect changes in specific cognitive processes rather than a general indication of neurocognitive integrity. The current results provide further evidence that the association between τ and executive functioning is higher than for other ex-Gaussian parameters, but now in context of other central domains of cognitive functioning. An additional novel aspect of our findings highlights the importance of μ in the association with cognitive variables.
The SEM and regression analyses presented here build on prior research that identified relationships between RT distribution indices and cognition. Tse and colleagues (2010) took two approaches to examining the relation between RT distribution parameters and cognition, first using correlation with cognitive tests covering several domains, and then focusing on working memory with a SEM. The latter established a connection between τ and a working memory composite that was stronger than the other parameters μ and σ. More recently, we expanded upon this idea by including other aspects of executive functioning (e.g., switching, inhibition, fluency) into an SEM, which further supported the connection with τ (Vasquez et al., Reference Vasquez, Binns and Anderson2016). Our prior study also demonstrated that executive functioning was more strongly connected to τ than to ISD or the other ex-Gaussian parameters.
The present results identified that τ was more strongly associated with processing speed and executive functioning than with memory. Although some of the tests we used to assess executive functioning, particularly DKEFS Trail Making and Color-Word Interference, were speeded tasks that theoretically could have exaggerated the τ-executive relation, we do not believe this to fully account for the results. Most importantly, in the current model the executive function latent variable included a non-speeded measure (WCST percent perseverative errors). Additionally, research has shown a strong relation between τ and measures of non-speeded working memory (Tse et al., Reference Tse, Balota, Yap, Duchek and McCabe2010). Together, the data suggest that brief attentional lapses not only inflate the completion time, but also cause individuals to lose set, thereby disrupting performance on executive tests of concept formation (WCST) and working memory. These results suggest that exceptionally slow responses correspond to the efficiency with which attention is maintained on task, and thus can be viewed as an index of cognitive control.
General latency, estimated by μ, evinced a strong association with all three included cognitive domains in the SEM, but only showed significant contributions to processing speed and executive functioning in the regression. These two analyses collectively suggest that although μ is related to cognitive variables, most of the variance in memory performance is better explained by age. In contrast, RT indices (μ and τ) were more salient contributors to processing speed and executive functioning compared to age. These findings for μ are logical; slowed processing should equally affect performance on cognitive tasks with a speeded component and experimental RT tasks. But what could explain the correspondence between μ and memory, controlling for age? Memory test performance is not directly dependent on speed of response, however, according to one theory, neural processing speed mediates cognition, including memory, through the principles of limited time and simultaneity mechanisms (Salthouse, Reference Salthouse1996). That is slow processing of information could disrupt cognition if sub-operations cannot all be completed in time, or if a mechanism is interrupted by decay of earlier sub-operations. Following this proposal, the Gaussian mean may provide an index of neural network efficiency. Alternatively, the μ-memory relationship could have resulted from individual differences in level of ability--- those who can respond quickly may also have better memory, representing superior performers.
A coupling between RT consistency and cognition has been shown to exist for fluid cognitive domains such as reasoning and processing speed (Bielak et al., Reference Bielak, Hultsch, Strauss, MacDonald and Hunter2010; Grand, Stawski, & MacDonald, Reference Grand, Stawski and MacDonald2016), consistent with the finding of age-related declines in fluid abilities (Salthouse, Reference Salthouse2004). Bielak et al. (Reference Bielak, Hultsch, Strauss, MacDonald and Hunter2010) and Grand et al. (Reference Grand, Stawski and MacDonald2016) used a conventional measure of consistency (ISD), which captures both the rightward distributional tail (τ) and the variability of observations in the Gaussian portion of the distribution (σ). Using ex-Gaussian analysis, the present data do not demonstrate a specific role for σ, indicating that the “active ingredient” in the relationship between ISD and fluid abilities is likely the slow responses reflected in τ. The notion that isolating the distributional component τ offers a purer measure of cognitive control is also supported by our present findings that τ maintains a stronger association with aspects of executive functioning compared to memory. Cognitive specificity of ex-Gaussian parameters had previously been hinted at in the data from Tse et al. (Reference Tse, Balota, Yap, Duchek and McCabe2010), which showed stronger correlations between τ and tests of processing speed and executive functions compared to memory. Including all variables into one unified SEM provides more direct evidence for the preferential association of τ with processing speed and executive functions over memory.
There are some limitations that should be considered when interpreting the data: (1) our sample did not consist of a continuous age range, which would have allowed for a more detailed depiction of continuous age-related effects. (2) Though the data suggest effects related to an aging process, these inferences should be made with caution, as a longitudinal design is required to make such conclusions. (3) The model depicts latent cognitive constructs based on commonly used neuropsychological instruments; however, these tests are often not process pure.
Conclusions
This study demonstrated that ex-Gaussian RT parameters are differentially associated with domains of cognitive functioning. The data support the theory that τ reflects the fidelity of cognitive control systems, which are recruited for classic tests of executive functioning (Vasquez et al., Reference Vasquez, Binns and Anderson2016; West et al., Reference West, Murphy, Armilio, Craik and Stuss2002), but also that these attentional failures impact measurement of processing speed on neuropsychological testing. The model replicated a stronger association of τ than other ex-Gaussian parameters μ and σ with neuropsychological measures of executive functioning independent of age (Vasquez et al., Reference Vasquez, Binns and Anderson2016). The model also indicated a connection between μ (the Gaussian mean) and memory, suggesting that general speed of processing may be an essential component to effective memory performance, but age contributed significantly more than μ to memory. This is in contrast with the domains of processing speed and executive functioning, where μ and τ had greater explanatory power over age. These data support the theory that speed of processing mediates several cognitive operations. We propose that cognitive specificity exists in the relative contribution of RT distribution parameters to neuropsychological performance based on the neural processes from which they are derived. Our data provide evidence that performance differences in neuropsychological tests of processing speed and executive functioning may be partially attributed to elevations in attention lapses (depicted in τ), as well as a general slowing of response (Gaussian mean). The findings also suggest that deterioration of cognitive control mechanisms through aging contributes to alterations in related cognitive abilities such as information processing speed and executive functioning.
Acknowledgments
We thank Colin Morris for programming the attention task and Mariam Iskander for her help with data collection. Conflicts of Interest: The authors have no conflicts to disclose. Funding: This research was supported by scholarships awarded to B. Vasquez from the Heart and Stroke Foundation of Canada, the Canadian Partnership for Stroke Recovery, and the Natural Sciences and Engineering Research Council of Canada, as well as by operating grants from the Canadian Institutes of Health Research (MOP 97844 and MOP 123484) awarded to N. Anderson. Author’s Note:Brandon Vasquez’s primary affiliation is now Neuropsychology and Cognitive Health, Baycrest Health Sciences.