
 α





1. Introduction
Due to its effect on the evolution of massive stars, mass loss plays an important role in many fields of astrophysics, such as the evolution and formation of black-hole binaries, the enrichment of the interstellar medium, the interpretation of high-redshift galaxies, galaxy evolution, supernovae, stellar population synthesis and even the first stars.
We know that mass loss strongly depends on metallicity and luminosity (e.g. Puls et al. Reference Puls, Vink and Najarro2008). The radiation pressure on metallic lines drives the outflows, which are classically characterized using the UV and optical mass-loss diagnostics. However, in the case of weak-winded stars, these measurements are subject to the weakness or insensitivity of H $\alpha$ and the UV P-Cygni profiles (Walborn et al. Reference Walborn, Lennon and Heap2000; Evans et al. Reference Evans, Lennon and Walborn2004). Moreover, the spectroscopic analyses of UV lines suffer from uncertainties due to wind-embedded shocks and wind-clumping (Hillier et al. Reference Hillier, Lanz and Heap2003; Fullerton et al. Reference Fullerton, Massa and Prinja2006; Oskinova et al. Reference Oskinova, Hamann and Feldmeier2007; Puls et al. Reference Puls, Vink and Najarro2008; Prinja & Massa Reference Prinja and Massa2010; Sundqvist et al. Reference Sundqvist, Puls and Owocki2014). Nonetheless, this results in empirical mass-loss measurements for higher luminosity stars (log
 $\frac{L}{L\odot}$
 $\geq$ 5.2–5.4 in the SMC), but only provides upper limits on the mass-loss rates from H
 $\alpha$ for the low-luminosity end of the observed massive stars.
These upper limits hint at lower wind momenta than expected from the theoretical predictions. But, without direct mass-loss measurements, the uncertainties of our current methods and common diagnostics cannot be ruled out to explain this discrepancy.
1.1. Br $\alpha$ as a unique mass-loss diagnostic for thin-winded stars

A sensitive mass-loss diagnostic exists in the infrared: the Brackett-alpha (Br $\alpha$) spectral line at 4.0512
 $\mu$m. This line forms in the transition region between photosphere and wind in the stellar atmosphere of weak winded stars. Br
 $\alpha$ is therefore insensitive to X-ray emission from wind-embedded shocks, and from wind inhomogeneities such as clumping and porosity. In hot stars, small departures from local thermodynamic equilibrium (LTE) have huge effects on the line morphology (Najarro et al. Reference Najarro, Hanson and Puls2011). In the weak-winds expected at low-luminosity and low-metallicity, the line shows extreme non-LTE effects resulting in a narrow emission near the line center that increases as the mass-loss rate decreases, with absorption wings (’N’ profile). For denser winds, Br
 $\alpha$ behaves much like H
 $\alpha$ with a broad emission that strengthens as mass-loss increases (’B’ profiles).
2. Observation program
2.1. JWST/NIRSpec
The superb sensitivity of the James Webb Space Telescope (JWST) to the thermal infrared makes it the only tool capable of reaching the faint magnitudes of the SMC targets in the range of Br $\alpha$. A handful of bright targets in the Milky Way were observed with IRTF/SpeX and VLT/ISAAC (Murdoch et al. Reference Murdoch, Drew and Anderson1994; Najarro et al. Reference Najarro, Hanson and Puls2011). However, the thermal background of the Earth’s atmosphere makes it impossible to observe more stars as they would be fainter in this spectral range. JWST circumvents this issue, and will allow the direct mass-loss measurements of thin-winded stars in the SMC, as well as testing the reliability of the Br
 $\alpha$ line by comparing with the classical diagnostics in the UV and optical. These mass-loss measurements will yield, for the first time, the wind-momentum-luminosity relation (WLR) in the low-metallicity, low-luminosity regime of the SMC. Recently, Mang Román et al. (Reference Mang Román, Zeidler and Hamann2025) also used JWST’s NIRSpec to showcase the Br
 $\alpha$ profiles of massive stars, albeit with lower signal-to-noise (SNR) ratio and some nebular contamination issues.
2.2. Sample selection
We have carefully chosen 15 stars in the SMC, spanning from the weak-wind to the strong-wind regimes, with an emphasis on lower luminosity O and B stars with log $\frac{L}{L\odot}$
 $\leq$ 5.2–5.4 (‘T’ profiles). One third of those stars were selected to have wind-sensitive H
 $\alpha$ profiles for cross-validation with the values derived from Br
 $\alpha$. All selected stars have already been thoroughly studied in the literature, with reliable photospheric parameters (effective temperature T
 $_{eff}$, surface gravity logg, luminosity log
 $\frac{L}{L\odot}$) estimated from optical and UV spectroscopy. With this information, we will be able to assess the role of T
 $_{eff}$ and logg on the stellar wind momentum. Whenever the information was available, binaries and nebulosity were avoided. All targets are included in GAIA DR3 and VISTA catalogs that meet the 0.1" astrometric accuracy required by the Wide Aperture Target Acquisition (WATA) mode of JWST.
2.3. Observation strategy
We have carried out long-slit spectroscopy of Br $\alpha$ with NIRSpec using the fixed slit aperture S200A2 (0.2"
 $\times$4.2"), with the grating and blocking filter G395H+F290LP achieving the highest spectral resolution available. The obtained spectral resolution is of R
 $\sim$3600 (Jakobsen et al. Reference Jakobsen, Ferruit and Alves de Oliveira2022; Isobe et al. Reference Isobe, Ouchi and Nakajima2023). The wavelength range spans 2.87 to 5.27
 $\mu$m, covering Br
 $\alpha$, Pf
 $\gamma$, H
 $\beta$, HeII 4.29
 $\mu$m, HeII 4.76
 $\mu$m.
Each target was observed in a single visit, with 5-point primary dithers along the spatial dimension of NIRSpec’s microshutters. This enables a pixel-based background subtraction. The background subtraction is a crucial step to remove any possible contamination by nebular emission to the stellar Br $\alpha$ profile. This, with the consideration of the nebular environment during target selection, allowed the difficulties posed by background contamination described in Mang Román et al. (Reference Mang Román, Zeidler and Hamann2025) to be avoided. SNR of 150-200 is critical to trace the red wing absorption of Br
 $\alpha$ and properly distinguish the continuum from the Stark-broadened profile with a precision better than 1%. We refer to Garcia et al. (Reference Garcia, Fullerton and Najarro2025) for further details on the data reduction.
3. Br$\alpha$ atlas

We present in Figure 1 the Br $\alpha$ atlas of the slower rotators (vsini
 $\le$ 150 km/s) among the 15 targeted stars of this program, arranged by spectral type and luminosity class. We refer to Garcia et al. (Reference Garcia, Fullerton and Najarro2025) for the full sample atlas. We make the distinction between fast and slow rotators, because rotational velocity broadens the Br
 $\alpha$ emission. The stars exhibit Br
 $\alpha$ with core emission on top of broad Stark absorption wings that increase in strength in cooler stars. An exception to this is AzV 15, which shows pure and broad Br
 $\alpha$ emission. The asymmetry in the absorption component of Br
 $\alpha$ is caused by the HeI 4.048
 $\mu$m 5f-4d triplet and singlet transitions in the cooler stars of the sample. In hotter stars, the HeII 4.0495
 $\mu$m emission overlaps with Br
 $\alpha$, causing a shift of the peak to shorter wavelength, and an overall asymmetry in both the broad and narrow emission profiles. Although helium lines contaminate the blue wing, the red side of Br
 $\alpha$ is dominated by the hydrogen transition alone. Figure 1 shows the clear trend of morphology of the red wing absorption as a function of spectral type. The observed trend of the morphology matches the model predictions of narrow and broad Br
 $\alpha$ profiles, with the exception of AzV 223, for which broad emission was expected
Br $\alpha$ profiles for the slow rotators sample stars. The ‘B’, ‘N’ and ‘T’ identifiers respectively specify the ‘broad’, ‘narrow’ and ‘thin’ regimes that are expected. The dotted vertical lines identify the Br
 $\alpha$ (red), the He I (blue), and the He II (orange) components. In AzV 15, the Stark absorption wings of the Br
 $\alpha$ are absent. This absorption increases toward cooler spectral types. Reproduced by permission of the AAS, see Garcia et al. (Reference Garcia, Fullerton and Najarro2025).

4. Preliminary results & Conclusions
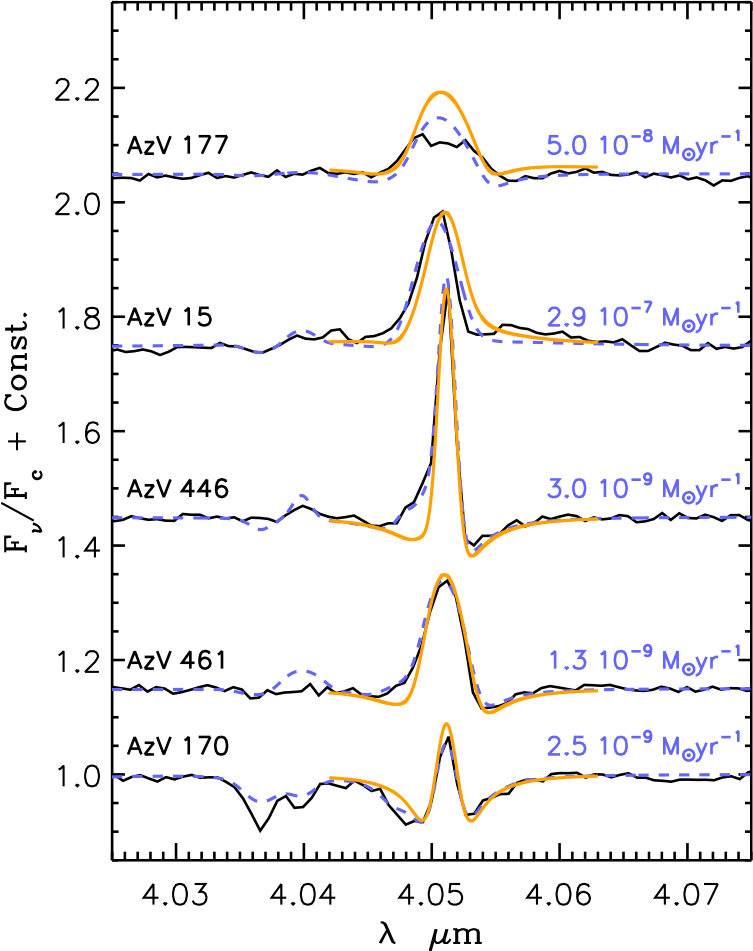
We performed the preliminary spectroscopic analyses of 5 stars in our sample, namely AzV 177, 15, 446, 461 and 170. We used the CMFGEN unified stellar atmosphere code (Hillier & Miller Reference Hillier and Miller1998), complemented with an independent analysis with the FASTWIND code (v10.6, Puls et al. Reference Puls, Urbaneja and Venero2005; Rivero González et al. Reference Rivero González, Puls and Najarro2011), and found consistent mass-loss rates between the UV/optical literature values and the results yielded by the two codes. We refer to Table 1 of Garcia et al. (Reference Garcia, Fullerton and Najarro2025) for the results. The best-fits from CMFGEN (blue) and from FASTWIND (yellow) are shown over the observed Br $\alpha$ profiles (black) of AzV 177, 15, 446, 461 and 170 in Figure 2.
Line fits of the subsample of 5 stars analyzed, covering the weak wind to strong wind regimes. The CMFGEN fit is shown in blue, and the FASTWIND independent fit is shown in orange. The mass-loss rate values derived using CMFGEN is provided in blue. Reproduced by permission of the AAS, see Garcia et al. (Reference Garcia, Fullerton and Najarro2025).

If present, the asymmetric broad photospheric absorption is well reproduced. The uncertainty on the mass-loss rate is estimated to be a factor of 2. This is caused by the influence of the transition velocity and the microturbulence on the formation of Br $\alpha$ in thin-winded stars. Br
 $\alpha$ forms in the transonic region of the atmosphere, where inhomogeneities and shocks are weak or absent.
The mass loss rates derived for the subsample of stars agree well with the literature UV values, showing that the effects of uncertainties are not important, and/or the underlying UV assumptions on X-rays and clumping are reliable. Furthermore, these preliminary results suggest that the low mass-loss rates measured in the UV, as well as the discrepancy by a factor of 1-2 orders of magnitude between the observed WLR and the one predicted by Vink et al. (Reference Vink, de Koter and Lamers2001) and scaled to SMC metallicity, are real (see Figure 3). Upcoming work will showcase the full analysis of the sample.
Wind-momentum–luminosity relation at SMC metallicity (in cgs units). Empirical smooth-wind mass-loss rate results using H $\alpha$ or from combined optical-UV analysis (grey symbols) are gathered from Massey et al. (Reference Massey, Bresolin and Kudritzki2004, Reference Massey, Puls and Pauldrach2005, Reference Massey, Zangari and Morrell2009); Heap et al. (Reference Heap, Lanz and Hubeny2006); Mokiem et al. (Reference Mokiem, de Koter and Evans2006, Reference Mokiem, de Koter and Vink2007); Bouret et al. (Reference Bouret, Lanz and Martins2013). H
 $\alpha$ only provides upper limits for mass-loss rates at log
 $\frac{L}{L\odot}$
 $\geq$ 5.2-5.4 (downward triangles). The Vink et al. (Reference Vink, de Koter and Lamers2001) WLR, scaled to SMC metallicity, is shown as the dotted-dashed grey line. We highlight the parameter space where we expect Br
 $\alpha$ to display a narrow emission in the shaded yellow area. The blue and green markers identify the targets of this program for which we expect broad emission and narrow in Br
 $\alpha$, respectively. The red markers the targets expected in the thin wind regime. The underlined objects have been analyzed by Garcia et al. (Reference Garcia, Fullerton and Najarro2025) and are presented in Figure 2. Reproduced by permission of the AAS, see Garcia et al. (Reference Garcia, Fullerton and Najarro2025).

Figure 3 Long description
Panel: A scatter plot. The horizontal axis represents the logarithm of luminosity (log(L/L☉)) with values ranging from 4.5 to 6.0. The vertical axis represents the logarithm of wind momentum (log(M v∞ [R/R☉]^(0.5))) with values ranging from 25 to 30. The plot includes various data points marked by different symbols and colors: red squares for Mdot-insensitive Hα, green squares for Narrow Brα, and blue squares for Broad Brα. A shaded yellow area indicates the parameter space where narrow Brα emission is expected. A dotted-dashed grey line represents the Vink et al. (2001) wind-luminosity relation scaled to SMC metallicity. Several data points are labeled with specific object names. The plot shows a general trend of increasing wind momentum with increasing luminosity.
Acknowledgements
A.L., M.G. and F.N. acknowledge support by grant PID2022-137779OB-C41. A.L. further acknowledges funding from grant PREP2022-000263. M.G. acknowledges grant PID2022-140483NB-C22, funded by the Spanish Ministry of Science, Innovation and Universities/State Agency of Research MICIU/AEI/10.13039/501100011033 and by “ERDF A way of making Europe.” M.G. and F.N. also acknowledge grant MAD4SPACE, TEC-2024/TEC-182 from Comunidad de Madrid (Spain).

 α
 α
 α

 α
 α
 LL⊙
 ≥
 α
 α

 Open access

